Evaluations
Evaluation of Infrastructure Canada's Economic Action Plan Initiatives
- Infrastructure Stimulus Fund
- Building Canada Fund Communities Component Top-Up
- National Recreational Trails
Evaluation Directorate
Infrastructure Canada
November 2012
Table of Contents
- Foreword
- Executive Summary
- 1. Introduction
- 2. Program Profiles
- 3. Methodology
- 4. Findings
- 5. Conclusions and Lessons Learned
- 6. Approval
- Annex 1 – List of Acronyms
- Annex 2 – Glossary of Terms
- Annex 3 – EAP Logic Model
- Annex 4 – Evaluation Matrix and Data Sources
- Annex 5 – Data Collection Instruments
Foreword
This is an evaluation of three Economic Action Plan (EAP) initiatives administered by Infrastructure Canada. The EAP was initially designed as a two year program from 2009 to 2011 (ending in 31 March). In December 2010, an extension was provided and the final deadline for project completions was revised to October 31, 2011.
The evaluation methodology and questions were designed before the extension was announced and is primarily geared towards accounting for the period up to March 31, 2011. Data collection was carried out throughout the spring 2011. However, adjustments were made to account for the extension period. Most notably, analysis was adjusted to account for new data received up to April 2012.
In keeping with standard evaluation methodological practices, the datasets were those available and were provided by the appropriate stakeholders up to April 2012. While subsequent data was provided, following the conclusion of the analysis and reporting phase in February 2012, the differences were considered minor.
Executive Summary
This report presents the results of an evaluation of three programs delivered by Infrastructure Canada (INFC), as part of the federal government's Economic Action Plan (EAP):
- The Infrastructure Stimulus Fund (ISF),
- The Building Canada Fund – Communities Component Top-Up (CC Top-Up), and
- The National Recreational Trails (NRT) program.
The federal government's EAP initiatives were guided by three defining principles – that stimulus should be "timely, targeted and temporary". Therefore, it is important to note that they do not follow the normal evaluation requirements of on-going programs as required by the TB Policy on Evaluation (2009) and the Policy on Transfer Payments (2008).
The Government of Canada took action to implement the Plan as quickly and effectively as possible, working with its partners in both the public and private sector, and provided regular quarterly updates to Canadians on progress made to date. The Department of Finance managed the overall coordination among federal departments of all measures identified under the EAP. In addition, it is the Department of Finance, not individual departments, that was responsible for tracking the Plan's performance in terms of stimulating the economy (the key objective of the EAP). The purpose of the evaluation is to inform Parliamentarians and Canadians of INFC's EAP initiatives and help inform priority-setting for the department.
The Department of Finance used a macro-economic model to measure the economic impacts of the EAP, including the number of jobs that were created or maintained. This approach was considered more reliable and methodologically-sound than seeking project-level data from proponents. In the 2012 Budget, the Department of Finance published its final estimates of the economic impacts of the Plan. In particular, it was noted that the Plan had created or maintained an estimated 248,000 jobs as of March 2011.
INFC EAP Initiatives within Executive Summary
The new INFC funding measures under the EAP were generally short-term in nature (i.e., one- or two-year timeframe) and focused on stimulating the economy. This represented a departure from traditional infrastructure programming, which focused on providing funding to infrastructure projects that contribute towards longer-term objectives (e.g., increasing productivity, improving the environment, etc.) and in achieving value-for-money.
In order to provide stimulus to the economy, the new funding measures, such as the ISF and the CC Top-Up needed to be timely and temporary. In addition, to maximize the stimulus effect of the measures, additional funding was leveraged.
The $4 billion ISF program was a two-year program (fiscal years 2009/10 and 2010/11). ISF received an extension for completing projects by October 31, 2011. ISF was intended to accelerate and increase the number of provincial/territorial, municipal, non-profit, and for-profit federal infrastructure projects. Eligible project categories were largely consistent with historical infrastructure programs and included water/wastewater, highways and roads, public transit, solid waste management, and culture. In addition, funding was also available for community centres and community services infrastructure, temporary shelter infrastructure, and parks/trails. Projects were selected based on their ability to be completed within the two-year timeframe.
The CC Top-Up program was an additional $500 million envelope to the existing $8.8 billion Building Canada Fund which was aimed at supporting strategic infrastructure investments. CC Top-Up ran over the same two fiscal years as the ISF program with the same extension to October 31, 2011. This program focused on projects in smaller communities, with populations of less than 100,000.
The NRT program was a $25 million one-year program (fiscal year 2009/10) intended to bring immediate seasonal economic activity to small rural communities in the form of job creation in the trails construction sector. This was to happen through the funding of projects to construct, upgrade, and/or rehabilitate motorized and non-motorized recreational trails.
The study addressed evaluation questions related to Relevance, Design and Delivery (given the programs' newness), and Performance (Effectiveness and Efficiency). Four data sources were analyzed in order to address these questions:
- Document and literature reviews,
- Program and project data held by INFC,
- Interviews of stakeholder groups, and
- Surveys of the ultimate recipients of program funds.
Study Conclusions within Executive Summary
The program delivery process within Executive Summary
The "need for speed" for economic stimulus was the driving factor behind the way in which these three initiatives were implemented. Key elements of the design were intended to deal explicitly with this factor, such as the risk-based approach used to review project proposals. In spite of the need to deliver these programs very quickly, all the important components of the design and delivery process for these initiatives were thoroughly addressed by INFC, including: governance and accountability, roles and responsibilities of all the parties, implementation of authorities regarding project approvals, overall decision-making processes, risk management mechanisms, project and program progress reporting, as well as the specification and communication of guidelines regarding project eligibility, leveraging, and other key implementation details.
Almost all components worked well, and we found the implementation of the initiatives to be successful. Some best practices are noted, such as the establishment of the Project Review Panel and the risk rating system for the ISF initiative.
INFC successfully mobilized for EAP delivery — the necessary change management and organizational adjustments were identified early on (e.g., the need to hire additional staff, the need to create new organizational units to support program implementation, such as the Stimulus Fund Directorate), and these changes were fully and successfully implemented.
Based on the findings of this evaluation, of the three EAP initiatives, the ISF model had the features that were found to be the most effective to deliver "timely, targeted and temporary" funding.
While internal administration cost were not available for all three EAP programs, estimates for the ISF program indicated that the program was delivered efficiently with low internal administration costs of approximately 1.4% which were within the limits of program authorities.1
Program Outputs and Outcomes within Executive Summary
The main intended outputs of these three programs were achieved:
- The specified thresholds for federal funding and funding by other parties for each of the various types of projects were met, with only minor exceptions.
- A substantial amount of funding from other levels of government was leveraged — the federal government contributed 37% of the costs of ISF projects, 32% of the costs of CC Top-Up projects, and 41% of the costs of NRT projects. Provincial governments contributed 33% of the total costs of both ISF and CC Top-Up; Municipal governments contributed 25% and 34% respectively.
- All the agreements that were necessary for program delivery were in place.
INFC achieved a high rate of success in funding commitments in the first year of the ISF program: $3.88 billion or 99% of the total project funding2 was committed by January 29, 2010, the target date for the approval of funding set out by the EAP initiative. For CC Top-Up, $496 million3, or 99% of the total project funding was committed in the first year.
When the programs ended on October 31, 2011, 97% of the ISF and the CC Top-Up projects were completed. The majority of EAP projects were completed by the initial deadline of March 31, 2011 (67% of ISF projects and 49% of CC Top-Up projects). As a one year program, nearly all NRT projects were substantially completed by March 31, 2010.
There are several characteristics of projects (in both ISF and CC Top-Up) that contributed to the probability of completion more quickly:
- Materiality — smaller projects were more likely to have been completed earlier;
- Project type — local roads (and highway infrastructure) had the highest completion percentage by initial program deadline, and recreational and cultural infrastructure had the lowest completion percentage;
- Risk rating — risk ratings considered materiality and project complexity. Projects rated as lower risk were more likely to have been completed by March 31, 2011.
This implies that, in future infrastructure initiatives that need to be delivered quickly, these factors should be taken into consideration in project selection. It also suggests that the risk rating approach developed by INFC was highly accurate in identifying projects likely to be completed on time. Overall, about 32% of the projects required extensions representing 64% of the total value of projects funded. The main reasons for project delays that were reported for all three initiatives were "external factors" (e.g., weather conditions, and supplier and material availability) over which the department and ultimate recipients had no control.
LESSONS LEARNED AND BEST PRACTICES within Executive Summary
To help ensure success of short-term targeted initiatives such as the EAP, the following best practices and lessons learned should be considered:
Design and Delivery within Executive Summary
Lessons Learned: within Best Practices of Executive Summary
- Consider project-type (e.g., highway infrastructure) in assessing project readiness and likelihood of completion.
- Establish reasonable cost thresholds for project funding as lower cost projects had higher probability of completion on time.
- Early engagement with provinces/territories and other funding partners and stakeholders to clarify respective roles and responsibilities and avoid overlap and duplication (e.g., reporting requirements, payment processing).
- Assess capacity and resources of ultimate recipients to implement the project under short timelines to ensure government and leveraged support is sufficient so that the project will not be forced to seek funding from other sources or incur delays which could impact on performance and results.
- Ensure common understanding amongst partners of program-specific expectations and terms such as "substantially completed", "leveraging", "attestation" and "shared risk".
Best Practices: within Design and Delivery of Executive Summary
- Ensure sufficient thresholds of Ministerial spending authorities to streamline decision-making and project approvals.
- Use a risk-based assessment approach and allow projects to begin construction immediately upon announcement prior to agreements being signed. Use existing applications and projects already identified by a province or territory as construction-ready.
- Use project review committees for the collective review of proposals to expedite the approvals process and project risk management (e.g., program authorities including eligibility requirements are respected).
Change and Risk Management within Executive Summary
Lessons Learned within within Change and Risk Management of Executive Summary
- Establish clear and consistent internal communications with employees and reduce mixed messages with external stakeholders and recipients.
- Assess and identify the business process changes required and impact on stakeholders as early as possible.
- Use a variety of recruitment mechanisms including secondments, term and contract employees to avoid challenges on winding down short-term initiatives.
- Realign existing resources and establish dedicated HR unit or committee for recruitment and staffing.
Best Practiceswithin within Change and Risk Management of Executive Summary
- The ISF Risk Rating model was effective and should be considered for future INFC initiatives particularly where the Minister is directly accountable for spending and results.
- Use streamlined but regular (e.g., quarterly) reports for progress monitoring and encourage program staff to be proactive with recipients to get information through other means if necessary (e.g., emails, telephone, working groups, other reports).
1 Introduction
This report presents the results of an evaluation of three initiatives that were delivered by Infrastructure Canada (INFC), as part of the federal government's Economic Action Plan:
- The Infrastructure Stimulus Fund (ISF)
- The Building Canada Fund – Communities Component Top-Up (CC Top-Up), and
- The National Recreational Trails (NRT) program.
These three initiatives are described in section 2.0.
The methodology for this evaluation, including considerations and limitations, are found in section 3.0.
Section 4.0 presents the main findings of the evaluation study.
Conclusions and Lessons Learned are provided in section 5.0.
2 Program Profiles
2.1 Infrastructure Stimulus Fund
The $4 billion Infrastructure Stimulus Fund (ISF) was announced in Budget 2009 to accelerate and increase the number of provincial, territorial, municipal, for-profit and not-for-profit infrastructure projects in order to stimulate the national economy. This was to be a two year initiative beginning in 2009/10 and ending in 2010/11. Under the ISF, eligible project categories were expected to be largely consistent with historical infrastructure programs including water, wastewater, public transit, solid waste management, highways, roads, and culture. In addition, funding was also available for community centers and community services infrastructure, temporary shelter infrastructure, and parks and trails.
Projects were selected based on their ability to be completed within the two-year timeframe. Merit would be largely based on the extent to which a project was construction-ready. New construction would also be supported under the ISF, if it was determined that the new construction was possible within the two year window for which stimulus spending was targeted. Projects had to be able to attest that work was incremental and construction had not yet started, they were ready, and in the absence of federal stimulus funding, work would not have been completed before March 31, 2011.
2.1.1 Resources
At the outset, resources for the ISF totaled $4 billion over a two year timeframe. The financial resources, approved by the Treasury Board Secretariat (TBS), are shown in Table 1.
Table 1 – ISF Resources
| 2009-2010 ($ thousands) |
2010-2011 ($ thousands) |
|
|---|---|---|
| Initial Planned Spending (2009-2010) | 2,000,000 | 2,000,000 |
2.1.2 Delivery
The majority of funding flowed through federal-provincial/territorial funding agreements where provinces and territories agreed to work with Canada in funding and delivering the ISF. Ultimate recipients, who would be undertaking the actual infrastructure projects under the ISF, generally included:
- A province, territory, or local or regional government established by or under provincial or territorial statute;
- A public sector body established by or under provincial or territorial statute or by regulation or wholly owned by a province, territory or local government;
- A federal asset (through federal transfers);
- A not-for-profit private sector entity; and
- A for-profit private sector entity.
For non-federal assets, the federal funding share of a project, from all federal sources, could not exceed 50% of total eligible project costs. As such, federal funding was not to exceed 50% for provincial or territorial assets. Where projects were supporting private for-profit assets, up to 25% of funding from federal sources was the threshold. While the federal share of funding for local government and not-for-profit assets may have been up to 50% of total eligible projects costs, a cost sharing threshold of 33.3% for local government and not-for-profit assets was preferred. However, federal assets could be funded up to 100% of total eligible project costs.
For the most part, INFC provided funding to the province or territory that in turn made payments to the ultimate recipients. INFC also had flexibility to enter into specific agreements with local governments, for-profit, and not-for-profit sector proponents.
INFC was responsible for reviewing all project proposals against the program terms and conditions. A Project Review Panel (PRP) was adapted from a pre-existing INFC program as an internal review body, comprised of the Associate Deputy Minister, Assistant Deputy Ministers for Policy and Programs, and the INFC Chief Financial Officer as Chair. A PRP Secretariat was also established to support the panel, composed of staff from the department's Finance and Administration branch.
The PRP assured that projects were eligible for funding under the ISF, and the department recommended projects to the Minister for approval based on the PRP's assurance that the projects met the Program's terms and conditions. However, the final authority to approve or reject recommended projects rested with the federal Minister.
2.2 Building Canada Fund – Communities Component Top-Up
The BCF–CC Top-Up (CC Top-Up) funding was an additional investment in one of three original components to the Building Canada Fund (BCF), an $8.8 billion program over seven years that aimed to support strategic infrastructure investments. The CC Top-Up was focused on projects in smaller communities, with populations of less than 100,000, analogous to the root BCF–CC program under the BCF.
2.2.1 Resources
Resources for the CC Top-Up totaled $500 million over two years. The financial resources are shown in Table 2.
Table 2 – CC Top-Up Resources
| 2009-2010 ($ thousands) |
2010-2011 ($ thousands) |
|
|---|---|---|
| Initial Planned Spending (2009-2010) | 250,000 | 250,000 |
In order to access CC Top-Up funds, provinces were required to commit the full amount of the core BCF–CC funding and attest that the additional projects could be completed by the March 31, 2011 deadline. For the CC Top-Up, the maximum federal share, from all sources, of the total eligible project costs could be up to 50%, but this varied by project proponent. Overall, within a province, the maximum federal share could not exceed 33% for all projects.
2.2.2 Delivery
CC Top-Up was governed by federal-provincial contribution agreements in each province. CC Top-Up was delivered through existing partnership arrangements with provinces as well as implementing departments and agencies (called Federal Delivery Partners - FDPs) through a Service Level Agreement (SLA). FDPs for the CC Top-Up were the Atlantic Canada Opportunities Agency, Western Economic Diversification, Canada Economic Development for Quebec Regions, and the Federal Economic Development Agency for Southern Ontario. The FDPs were accountable to the Minister responsible for their respective departments for their role in the delivery of CC Top-Up.
Provinces shared management of agreements and administration of the program with INFC and FDPs. The provinces played essentially the same role as in the ISF – collection of applications, monitoring of projects, processing of claim payments, and administration of payments to ultimate recipients. The FDPs substituted, to some extent, for the role played by INFC in the ISF – reviewing applications and making recommendations to the Oversight Committee (see below), on-going monitoring of projects, processing financial claims, approving transfer payments to the provinces, and reporting to INFC.
Proposal selection and approval processes (except Quebec) included the involvement of a Joint Secretariat and an Oversight Committee. All project applications were subject to a competitive, application-based process, submitted through an on-line system developed and administered by INFC. The Joint Secretariat was made up of officials from the provincial government and the FDP that provided a first level of due diligence. The Oversight Committee was made up of both federal and provincial senior officials and through an iterative process presented recommendations for project approval to the Minister of Transport, Infrastructure and Communities, or the FDP Minister, according to delegations of authority.
Ultimate recipients, who undertook the infrastructure projects under the CC Top-Up included:
- A local or regional government, established by or under provincial statute;
- A provincial entity, as defined by provincial statute, that provides municipal-type services to local or regional governments or communities;
- A public sector body that is established by or under provincial statute or by regulation or is wholly owned by a province or municipality which provides municipal sector services in a given area; and
- A private sector body, including not-for-profit organizations, whose application is supported by a municipal or regional government resolution referred to above, which includes First Nations.
In all instances, the provinces entered into agreements with recipients. INFC and FDPs did not sign any direct CC Top-Up agreements with ultimate recipients.
2.3 National Recreational Trails
The main goal of the National Recreational Trails (NRT) initiative was to bring immediate seasonal economic activity to small rural communities in the form of job creation in the trails construction sector. This was to happen through the funding of projects to construct, upgrade, and/or rehabilitate motorized and non-motorized recreational trails.
A single contribution agreement with the National Trails Coalition (NTC) was signed, through which the NTC directed funds to ultimate recipients. The ultimate recipients of the funding all fall under the umbrella of one of three groups that compose the NTC and represent the vast majority of trail organizations across Canada. These ultimate recipients were:
- Member organizations of the Canadian Trails Federation or one of its provincial-territorial members;
- Provincial-territorial rider federations recognized by the Canadian Off-Highway Vehicle Distributors' Council, the Motorcyclists Confederation of Canada, or the ATV & Quad Council of Canada, or one of their provincial-territorial affiliates; and
- Provincial-territorial organizations recognized by the Canadian Council of Snowmobile Organizations or one of its member clubs.
2.3.1 Resources
Resources for the NRT totaled $25 million in 2009/10.
Federal funding in the NRT was intended to be cost-matched with the maximum federal share being 50%. Matching funds could be provided through provincial, municipal, private or other sources. In-kind contributions could not count towards the cost-matching.
The vast majority of federal funds were allocated through one intake.
2.3.2 Delivery
The federal government had no role in project selection for the NRT. The NTC chose all projects based on eligibility criteria in accordance with the provisions of the contribution agreement.
The ranking process of applications was administered by a Regional Committee that considered project readiness, extent to which the project supported multi-purpose trail use, and economic impact. The Regional Committees aimed to allocate one-third of funding to each of three types of recreational trails: non-motorized, snowmobile, and all terrain/off-road vehicles.
In terms of oversight, the Board of Directors of the NTC was responsible to ensure the NTC's assessment criteria were respected and funding had been allocated equally amongst the different trial types. In terms of control, an Agreement Management Committee (AMC) was established to monitor implementation of the contribution agreements and funding flow; resolve disputes; monitor risk; and ensure the principles of the agreement were respected. This committee had as a minimum an NTC co-chair, an NTC member, and a federal member.
3 Methodology
3.1 Evaluation scope and approach
The coverage and scope of the evaluation were determined by INFC's Evaluation Directorate through discussions with the Departmental Evaluation Committee (DEC) and the TBS Centre for Excellence in Evaluation (CEE).
The Economic Action Plan (EAP) was not an initiative in the traditional sense as it was a short-term, time-limited initiative. Accordingly, DEC recommended, and TBS recognized, that the evaluation could not focus on the full scope of traditional evaluation questions. Accordingly, the focus of the evaluation is on the expedited funding of projects — the 'need for speed' — and on infrastructure built. Taking into account the nature of the EAP and DEC recommendations, this evaluation does not address Relevance and Performance as defined in the TB Policy on Evaluation. The Evaluation Directorate sought TBS CEE advice for the proposed approach. CEE was supportive of the scope of the horizontal evaluation framework and the horizontal logic model.
The main objective of the evaluation is to assess the effectiveness of INFC's delivery of short-term funds for projects and infrastructure built (both aspects contribute to the larger government-wide goal of economic stimulus and job creation).
Table 3. Program Evaluation Elements and Rationale for Inclusion/Exclusion in the Study
Table 3 Part A – Core issue Relevance
| Core Issue — Relevance | Rationale | |
|---|---|---|
Continued need for program |
Assessment of the extent to which the program continues to address a demonstrable need and is responsive to the needs of Canadians. |
Excluded: EAP-related funding has two-year lifespan. |
Alignment with Government Priorities |
Assessment of the linkages between program objectives and (i) federal government priorities and (ii) departmental strategic outcome. |
Partial:
|
Alignment with Federal Roles and Responsibilities |
Assessment of the roles and responsibilities of the federal government in delivering the program. Assessment of whether the organization was the appropriate entity to deliver the program. |
Partial: The roles and responsibilities of INFC will be examined as part of program Design and Delivery and change management (Section 4.2). Evaluating the relevance of the federal role 'writ large' or whether INFC was the appropriate entity is out of scope of this evaluation. |
Table 3 Part B – Core issue Performance
| Core Issue — Performance | Rationale | |
|---|---|---|
Achievement of Expected Outcomes |
Assessment of progress toward expected outcomes (incl. immediate, intermediate and ultimate outcomes) with reference to performance targets and program reach, program design, including the linkages and contribution of outputs and outcomes. |
Included: The evaluation will follow the EAP logic model and will assess progress and achievement of expected outcomes:
|
Demonstration of Efficiency and Economy |
Assessment of resource utilization in relation to the production of outputs and progress toward expected outcomes. |
Partial: As per DEC decision on September 8, 2010 assessment of cost savings (economy) is not included as part of the evaluation. The assessment of efficiency is included as noted above under 'need for speed'. |
This evaluation addresses six questions in relation to four evaluation issues:
Relevance within Evaluation scope and approach
Question 1: Were the objectives of each of the three EAP initiatives in alignment with the departmental strategic outcomes?
Design and Delivery within Evaluation scope and approach
Question 2: To what extent were the EAP initiatives implemented as planned, including key features implemented at the strategic and operational levels to accommodate the "need for speed"?
Question 3: To what extent were the changes in the delivery process over the course of the program managed at the strategic and operational levels?
Question 4: To what extent did the EAP initiatives achieve the intended outputs?
Performance within Evaluation scope and approach
Question 5: To what extent did the EAP initiatives achieve desired outcomes?
Efficiency within Evaluation scope and approach
Question 6: Were the contribution funds of the EAP initiatives administered efficiently?
3.2 Lines of evidence
Four data sources were analyzed in order to address the six evaluation questions:
- Document review
- Program and project data held by INFC
- Interviews of stakeholder groups (96 interviews)
- Surveys of the ultimate recipients of program funds (658 respondents)
3.2.1 Document Review
One hundred and thirty (130) documents were reviewed corresponding to three main categories: (1) foundational, (2) corporate accountability, and (3) program material and operational.
The breakdown of documents reviewed by program area:
- EAP general documents (19)
- CC Top-Up specific documents (50)
- ISF specific documents (37)
- NRT specific documents (24)
The information extracted from the documents was entered into an evidence matrix and analyzed in accordance with the evaluation questions and indicators.
3.2.2 Analysis of Program and Project Data
Three data sources were analyzed:
- INFC's Shared Information Management System Interface (SIMSI)
- A spreadsheet maintained by the National Trail's Coalition (NTC)
- Financial claims data from INFC's Finance Directorate
SIMSI was the main data source. It contains project information collected from the ultimate recipients and program officers. The following projects are contained in the SIMSI database.
Table 4 – Projects in SIMSI Database in April 2012
| Program | Number of Projects | EAP Funds ($M) | Total Costs ($M) |
|---|---|---|---|
| ISF | 4,031 | 3,612 | 9,639 |
| CC Top-Up | 537 | 472 | 1,485 |
Note: The above table does not include cancelled projects and federal transfers. Also, there were a small number of projects held outside of SIMSI that were not considered in data analysis.
NTC data was maintained outside of SIMSI, and included projects listed by province with an indication of the type of trail, the project status, amount of funds shared between the various sources, payments made, and other notes or comments.
INFC's Finance and Administration Branch provided financial claims processed for each of the three initiatives. In addition to the amount paid, the data contain information on the organization receiving the funds and the date on which the funds were paid.
3.2.3 Stakeholder Interviews
Interviewees were drawn from three stakeholder groups for each initiative across Canada: (1) INFC management and staff, (2) delivery partners, and (3) ultimate recipients of EAP funding. Interviews were conducted in-person or by telephone. A total of 96 interviews were completed as follows:
Table 5 – Interviews Conducted, by Initiative and Category
| Initiative | Interviewee Category | Number Interviewed |
|---|---|---|
| ISF | INFC Senior Management | 4 |
| INFC Staff | 16 | |
| Provinces/Territories | 11 | |
| Recipients | 17 | |
| ISF Total | 48 | |
| BCF–CC Top-Up | INFC Senior Management and Staff | 7 |
| Federal Delivery Partners | 5 | |
| Provinces | 10 | |
| Recipients | 13 | |
| BCF–CC Top-Up Total | 35 | |
| NRT | INFC Staff | 3 |
| National Trails Coalition | 5 | |
| Recipients | 5 | |
| NRT Total | 13 |
The data were collected in an evidence matrix, and several steps were followed in order to arrive at a synthesized set of data broken down by initiative for each evaluation indicator (see the Interviews Technical Report for details and data tables).
3.2.4 Surveys
Surveys of the ultimate recipient groups for each of the three programs were conducted using an on-line tool. Invitations to complete the questionnaire were sent to people who managed one or more projects that received funding. The questionnaire for each of the programs varied slightly since some of the questions were not applicable to all three groups.
The number of invitations, individual respondents and response rate by program are shown below. Note that for both ISF and CC Top-Up, recipients in the province of Quebec were not included in the surveys.
Table 6 – Survey response rates
| ISF | CC Top-Up | NRT | |
|---|---|---|---|
| # of invitations | 748 | 386 | 429 |
| # of respondents | 308 | 179 | 171 |
| Response rate | 41% | 46% | 40% |
| 95% confidence interval5 | ±4.3% | ±5.4% | ±5.8% |
A number of tasks were performed on the data files to produce the summary statistics by evaluation indicator – such as collation of the data and reliability and validity checks. Also, for the ISF and CC Top-Up survey responses, we matched their responses to the project details found in the SIMSI database and added some project details. We were able to match the respondent data to at least one of the projects managed by 94 per cent of the respondents. No matching of NRT responses to project details was possible.
It was necessary to weight the responses. If the analysis had been done in the normal way, by number of responses, then a response from a recipient of NRT funds, for example, would have counted more than half as much as a response from a recipient of ISF funds, since the number of NRT responses was equal to 56 per cent of the number of ISF responses. But the NRT budget was less than one per cent of the ISF budget, so analyzing the data without weighting would have been inappropriate. The value of the projects covered in the surveys was used as the basis of the weighting. (See the Surveys Technical Report for details regarding the weighting methodology.)
Demographic characteristics of the survey respondents
The numbers and values of projects managed by respondents are summarized below:
| ISF: | Survey respondents were personally responsible, on average, for about five projects, but seven respondents indicated that they managed more than 50 projects. Most of the projects (79%) were for the rehabilitation or improvement of existing infrastructure. The survey respondents represented about half the projects funded through ISF. Seventy-one per cent of the respondents managed projects that had total eligible costs of greater than $1 million, and the average overall value of projects managed by respondents was about $13 million. |
|---|---|
| CC Top-Up: | The majority of these respondents (over 80%) managed only one project. Most of the projects were for the rehabilitation or improvement of existing infrastructure. The respondents represented about half the projects funded through CC Top-Up. The projects CC Top-Up respondents were personally responsible for had an average value of just over $3 million. |
| NRT: | On average, a survey respondent was personally responsible for two projects. Seventy per cent of the projects were for work on existing infrastructure. The respondents represented about 70% of the projects funded through NRT. Data on the values of projects managed by respondents are not available from the survey. Program data shows the average value of an NRT project was $119 thousand. |
The following chart shows the types of organizations represented by respondents:
Chart 1 – Type of organization
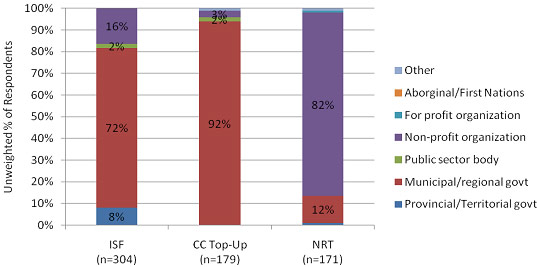
The vast majority of respondents for ISF and CC Top-Up were from municipal, local, or regional government organizations.
With regard to the location of respondents, 61% of the ISF respondents were from the province of Ontario. Ontario recipients also made up the largest group of CC Top-Up respondents, but were only 37% of the total respondent group in this case.
3.3 Considerations and Limitations
Limitations associated with program and project data sources include the following:
- Interview and survey data from Quebec were not undertaken and therefore are not represented in the evaluation report.
- The most noteworthy consideration for this evaluation is that there is significant time lag – about 10 months – between the collection of interview and survey data and the collection of project data from SIMSI. To report on the extension period, SIMSI data accounting for program activity up to the extension deadline of October 31, 2011 was integrated into our analysis of project data. This was done in March 2012, significantly later than the collection of survey and interview data, which occurred in Spring/early summer 2011.6 Thus the reader must note that survey and interview data are not reflective of the extension period, whereas SIMSI data is.
- Some of the information contained in SIMSI has been self-reported by the proponents (e.g., ultimate recipient), and, as such, may have inconsistencies. Such limitations are inevitable when working with live data that evolves as the program progresses as there are time lags between the date of reporting by the proponent to the province and the date of reporting by the province to INFC.
- Data on projects not selected for funding were limited in the SIMSI database system. Thus, the projects not selected for funding were not considered for analysis.
- The SIMSI data for ISF does not contain a field for contributions to projects from other federal sources; any share that would have been provided by other federal sources may have been included in the "Other" category. ISF program officers indicated that very few projects received funding from other federal sources. Since there was no practical way of obtaining the information on contributions from other federal sources, we assumed these contributions were zero.
- Administration costs for EAP initiatives are difficult to estimate. The administrative expenditures are not part of the project tracking system in SIMSI, as only the overall program costs are tracked on a departmental level for all programs; administrative costs were not attributed to individual programs. Isolating individual administrative costs was a challenge and are based on estimates.
The most serious of these limitations are numbers 3 and 6. With regard to #6, estimates of administration costs for the ISF program were derived from INFC Finance documents available in April 2012.
There were also some limitations with respect to both the collection and the analysis of the interview data.
- On occasion, different interviewees within each interview category were sometimes asked questions that others in the same category were not. (The data were analyzed in such a way that, if a response was provided, it was included in the analysis.)
- In some cases in which the interviewee was asked to provide a binary response of yes or no, a yes or no was not provided. In all of these cases comments were provided, and the comments were reviewed and interpreted to arrive at either a yes or no response.
- Interviews with representatives from the province of Quebec were not conducted for ISF and CC Top-Up.
Limitations regarding the analysis of the surveys include:
- As indicated above, the survey data do not include participants in the ISF and CC Top-Up initiatives in the province of Quebec.
- Insufficient responses from some provinces/territories were received. This was dealt with by combining some of the smaller response regions together for analysis purposes.
In the evaluation methodology report, evaluation question #4 included the use of focus groups to identify lessons learned from the design/delivery and change management aspects of the EAP. However, budgetary and time limitations made conducting focus groups impractical.
4 Findings
4.1 Relevance
This evaluation does not examine the need for INFC's EAP initiatives, as per the Terms of Reference for the study. Canada was not immune to the economic downturn that gripped much of the world in 2008 and slid into a recession in late 2008. The Canadian government, as many other governments including the U.S., responded by, among other things, expanding and accelerating federal investment in infrastructure in an effort to stimulate aggregate expenditures. INFC's EAP initiatives represent the bulk of this effort.
However, we did examine whether INFC EAP initiatives align with departmental strategic outcomes.
Evaluation Question 1: Were the objectives of each EAP initiative in alignment with departmental strategic outcomes?
Finding: ISF, CC Top-Up and NRT program objectives are aligned with INFC's Strategic Outcome of "providing construction-ready infrastructure projects with federal funding support."
We examined the degree of alignment between program objectives and the departmental Strategic Outcome 3: "Construction-ready infrastructure projects are provided with federal funding support."
The document review shows that the ISF, CC Top-Up and Fund for NRT closely align with this strategic outcome.
For ISF, "the primary focus of the $4 billion ISF is to provide short-term stimulus to provincial, territorial and municipal infrastructure projects that are construction ready and can be built over the next two years."
This is reiterated in a number of other documents, such as the provincial contribution agreements, that state: "through the funding of these projects Canada and [Province or Territory] are providing timely, targeted and temporary stimulus to the Canadian economy."
For CC Top-Up, the Amended Terms and Conditions state "construction-readiness will now play a larger role in project selection. The focus has shifted to funding initiatives that are construction ready and can be built over the next two years."
The main objective of NRT funding is to bring immediate seasonal economic activity to small rural communities in the form of job creation, construction projects as well as the upgrade and rehabilitation of new or existing motorized and non-motorized recreational trails.
We also examined the degree of consistency in statements that describe EAP objectives in foundational and corporate documents. We found that the objectives of each initiative were consistently expressed across all documentation.
The objectives of the ISF are consistent across corporate documents such as the Departmental Performance Report (DPR), Report on Plans and Priorities (RPP), as well as foundational program documents. Similarly, for CC Top-Up, the foundational program documents and corporate documents consistently describe the objectives of the CC Top-Up as aiming to help smaller communities address their infrastructure pressures. The objectives of the NRT are also consistently stated across all foundational and corporate documents, which state the program objectives as investing in "shovel ready" projects to assist Canada emerge from the current economic downturn.
4.2 Design and Delivery
Evaluation Question 2: To what extent were the EAP initiatives implemented as planned, including key features implemented at the strategic and operational level to accommodate the "need for speed"?
The main driver for all three EAP initiatives being evaluated was the "need for speed" — i.e., the need to facilitate the construction of a large number of infrastructure projects and commit federal funding as quickly as possible, in order to stimulate the economy and create jobs. The analysis in this section primarily concentrates on the extent to which this implementation was successful.
Summaryfor Evaluation Question 2
As noted above, the "need for speed" was the driving factor for which three initiatives were implemented, and several of the design features of these programs were intended to deal explicitly with this factor. However, a detailed analysis of the delivery process shows that, despite the significant challenges at hand, all the important components of the delivery process for these kinds of programs were addressed by INFC, and the implementation of this process was successful, with only a few exceptions. In particular:
- The governance regime for all three programs was well defined and comprehensive.
- The roles and responsibilities of all parties were defined, although there were some concerns expressed by stakeholders about possible overlap of responsibilities in a couple of areas.
- The decision-making processes were innovative and effective.
- The increased delegated of spending authority was useful, and Ministerial accountability was clearly defined.7
- Risk rating mechanisms were effective and well implemented in the two larger programs, and the information was relevant for decision-making and risk management in project selection.
- 67% of ISF projects were substantially completed by the initial program deadline of March 31, 2011. A majority of the completed projects were less costly, and rated as low risk.
- Capacity to respond to accelerated delivery was a challenge for a minority of provincial and FDPs in the CC Top-Up program, and for about a third of the ultimate recipients in the ISF program that experienced delays.
- Sixty per cent of ultimate recipients indicated challenges as a result of the short timelines, but over 40% said there were positive impacts. The main challenges were insufficient resources to manage projects (especially in ISF) and increased construction costs (especially in CC Top-Up).
To assess the extent to which INFC was successful in implementing its EAP initiatives quickly and effectively, we examined three areas:
- Governance
- Risk management
- Perceptions of funding recipient on program delivery models.
4.2.1 Governance
We examined the following key features of the governance8 regime for the three initiatives:
- Overall comprehensiveness (direction setting and management controls);
- Clarity and understanding of the roles and responsibilities of INFC and delivery partners;
- Effectiveness of decision-making bodies; and
- Use of increased spending authorities.
4.2.1.1 Direction setting and controls
Finding: The individual governance regimes for each of the three EAP initiatives were well defined and sufficiently comprehensive, in particular, the mechanisms used for project selection and controls.
For ISF direction-setting was done through the project eligibility criteria (which were established at the outset of the program) and the PRP. For CC Top-Up, pursuant to the Contribution Agreement with each province, the existing Oversight Committee was employed, consisting of senior federal and provincial officials. This committee served as the principal forum for direction setting. For NRT, direction setting was done initially through the definition of the eligibility criteria by the NTC. Refinements were made by Regional Advisory Committees established by the NTC, and these committees dealt with applications for funding. For all three programs, the mechanisms for direction setting were well defined and adequate.
Control mechanisms were also well defined and adequate. For ISF, control mechanisms were defined in the Contribution Agreements with proponents. These included quarterly claim and progress reports, financial audits and compliance audits related to specific agreements. In addition, the INFC Chief Financial Officer (CFO) was required to submit an annual report to TBS. For CC Top-Up, two levels of control already established for the CC program were used. Joint Secretariats, consisting of provincial government and Federal Delivery Partner representatives, provided the first level of due diligence, including environmental and legal review of the applications, and prepared briefing material for the Oversight Committees (the principal control body). Oversight Committees (except for Quebec) consisted of senior federal, provincial, and (sometimes) municipal officials. These committees reviewed applications and made recommendations to Ministers, and they were also responsible for recommending claims for approval (following their approval by the province). For NRT the funding agreements signed between NTC and all recipients included adequate controls for all cheque requisitions. Concurrently, these findings are consistent with the internal audit and OAG audit.
4.2.1.2 Roles and Responsibilities
Finding: For the most part, roles and responsibilities were clearly defined.
For all three programs roles and responsibilities were set out in documents such as Business Models, individual Contribution Agreements, Service Level Agreements, Terms of Reference, and Project Monitoring documents. However, there was a perception among some stakeholders (e.g. provinces) of overlap in responsibilities between the federal and provincial parties in both the ISF program (overlap regarding reporting requirements) and the CC Top-Up program (overlap regarding claims processing).
For ISF, roles and responsibilities were clearly defined in the funding agreements with each proponent, which clearly outline the responsibilities of the signatory and specific terms of funding to mitigate program risks. The provinces/territories administered the program through funding agreements with municipalities or other eligible recipients that were consistent with the ISF's terms and conditions. ISF contribution agreements with the private sector, municipalities, and not-for-profit organizations laid out the responsibilities and accountabilities of each signatory for delivery, administration, management and reporting.
In CC Top-Up, various agreements specified the roles and responsibilities of all parties – the contribution agreement between INFC and the provinces, contribution agreements between the provinces and the ultimate recipients, and the Service Level Agreement between INFC and the FDPs.
For NRT, the funding agreement between INFC and the NTC spells out the roles and responsibilities of each party, and the NTC agreed to include roles and responsibilities of the ultimate recipients in funding agreements with the ultimate recipients.
Overall, the majority of interview respondents in all three programs agreed that the roles and responsibilities between INFC and delivery partners were clear and well defined. However, in the ISF program, about a third of the provincial/territorial interviewees perceived some overlap in reporting between their own requirements and those of INFC9. In addition, the ISF -recipients rated the clarity of the roles and responsibilities of INFC as only 2.7 out of 4 (where a rating of "1" meant "strongly disagree" and "4" meant "strongly agree" with the statement that the requirements were clear).
In the CC Top-Up program, the interviewees involved with this program were generally satisfied with the division of roles and responsibilities, with the following exceptions:
- 45% of the interviewees perceived some overlap in claims processing between INFC and the FDPs, as there was the perception that it was done by both the FDPs and INFC.
- Three of the five FDP representatives rated the division of roles and responsibilities as only 1 (or "not satisfied") out of 4.
CC Top-Up survey respondents were positive about the roles and responsibilities of the province. (They were not asked about INFC or the FDPs.)
4.2.1.3 Decision-making mechanisms
Finding: The decision-making mechanisms, which consisted of the PRP for the ISF, the Oversight Committee for CC Top-Up, and the AMC for NRT, were effective – in fact, the PRP was regarded as a best practice.
The PRP was widely considered a best practice by interviewees. Rather than a single individual making recommendations, the PRP functioned as a collective review mechanism (INFC senior officials for Policy and Programs, and the INFC CFO as Chair) of projects that were being recommended for approval by the Minister. The PRP assured that a project met the Terms and Conditions of the program, including eligibility requirements, and that project risks were mitigated and managed, that Treasury Board policies have been adhered to and that the project's materiality falls within the Minister's delegated spending authorities. In all cases, the Minister made the final decision to approve projects based on PRP's assurance.
In addition, 71% of ISF respondents rated the decision process10 (balancing the need to expedite funding with the need to respect authorities and accountabilities) as 3 or 4 out of 4 (where 1 meant "Not effective" and 4 meant "Very effective").
For CC Top-Up, the ultimate decision-making responsibilities rested with one of the Ministers (FDP or INFC), supported by the Oversight Committee. This process was considered by interviewees as highly effective for the initial approvals. However, this was not the case for decisions regarding project extensions – the decision-making process was perceived by some provinces and ultimate recipients as unsatisfactory and overly lengthy.
The NTC Board of Directors was the decision-making body for the NRT, supported by the Regional Advisory Committees. AMC was the decision-making body for the contribution agreement with the NTC. It was a manageable size for decision-making and had adequate authority, resources, and information to support decision-making. It was reported as effective by NRT interview respondents.
4.2.1.4 Increased delegation of spending authority11
Finding: The threshold for Ministerial spending authority was effective in getting some of the larger projects launched quickly, and the accountability for decisions was clearly defined.
To accelerate the pace of project approvals, Treasury Board provided Federal Ministers involved in implementing EAP initiatives with increased delegated spending authority (up to $100 million), allowing them to sign agreements and approve projects without having to return to Treasury Board for approvals. This increased delegation of authority was recommended by Treasury Board Secretariat based on its knowledge of the department and previous assessments of the departments' management accountability frameworks.12 The increased spending authorities allowed for more efficient approval and implementation of projects at higher thresholds that would normally have required TBS approval. Accountability, due diligence and oversight were not compromised and innovative governance arrangements, such as the use of the Project Review Panel to review project proposals and the increased delegation of spending authorities, were used.
4.2.2 Risk management
Given the speed with which these initiatives needed to be implemented and the size of some of the projects (up to $32 million in federal funding alone), a means for assessing and managing the risks associated with projects was a critical component of program delivery. We examined the extent to which the risk approach was useful and relevant for decision-making and ensuring effective risk management.
Finding: In both the ISF program and the CC Top-Up program, risks were assessed at the outset of the projects and throughout project execution using a risk rating model comprised of various elements (e.g., project materiality). The NRT program had similar requirements, but these requirements were not always met, specifically, risk mitigation control measures such as requiring declaration of substantial completion by a third party as was the case with the ISF program. In all three programs, risk information was used for decision-making and effectively applied for project selection.
Finding: The risk model used for ISF was highly effective and should be considered a best practice for use in INFC programs. 72% of ISF projects rated as low risk were completed on time.
Finding: With regard to progress monitoring, there were some challenges in all three programs related to data quality and completeness due to design limitations in the SIMSI system and the "need for speed". ISF program staff developed proactive temporary solutions to obtain data for risk management and progress monitoring.
In the ISF program, project level risk assessment tools were used to assess projects at the outset prior approval and signing an agreement. Also during the implementation phase, each project underwent a quarterly risk assessment to determine the on-going risk level and the monitoring activities required to minimize the project's risks. A majority of interview respondents indicated that risk information was used as an input to decision-making.
In the CC Top-Up program, a risk assessment profile and mitigation measures were developed for the overall CC program, and project risks were assessed throughout project execution. The majority of interview respondents who answered this question indicated that risk information was used in decision-making.
In the NRT program, there were risk assessment requirements at both the overall program and the project level. The NTC was responsible for project-level risk management, while INFC was responsible for program-level risk management. However, the NRT Review (audit)13 found that these requirements were not always met, and that appropriate monitoring and mitigation strategies were not developed in all cases. A risk mitigation control measure, such as requiring the declaration of substantial completion by a third party, may have provided assurance as was the case with the ISF program. On the other hand, NRT interviewees indicated that risk information was used as an input to decision-making and that risk tools were used throughout the execution of projects.
Progress monitoring was intended to be an integral part of the on-going risk assessment process. However, there were challenges in all three programs:
- In ISF quarterly reporting from recipients was required using SIMSI. However, the SIMSI generated project risk assessment rating became less accurate as the program evolved over time as the system's risk algorithm could not be altered. As a result, analysts' project risk ratings became more relevant and there was a more noticeable divergence between the two risk ratings. To avoid confusion, analysts' project risk ratings took precedence.
- In CC Top-Up quarterly and annual progress reports were required from all recipients. However, numerous data quality issues were noted by interviewees as a result of limitations in the SIMSI system.
- In NRT recipients were required to report to NTC monthly, and NTC was required to report to INFC on a bi-monthly basis. The NRT Review cited inconsistencies in NTC's reported financial information.
The 'need for speed' required ISF staff to find inventive and adaptive solutions to track progress reporting data for decision-making. The evaluators were told that in addition to formal quarterly reports from recipients, ISF program recommendations and decisions were also made using other relevant information obtained through pro-active follow-up emails, calls and update meetings. In instances where it was not possible to collect additional information using SIMSI, or if SIMSI development could not meet deadlines as the SIMSI system was being developed concurrently with the delivery of the initiative, a number of temporary solutions were developed and built offline, such as through Excel or Access. Program staff believe these temporary solutions provided an alternate method to track additional project information on a timely basis. The evaluation did not independently assess the effectiveness of these offline solutions.
4.2.3 Funding recipient satisfaction with program delivery
The evaluation study investigated several aspects of the effectiveness of the delivery process as perceived by the funding recipients for the three programs that one would expect to be challenging in programs that had to be delivered so quickly:
- The clarity and understanding of eligibility and project selection criteria;
- The degree of satisfaction of the various partners with the level of engagement/consultation and communication; the funding approval and monitoring processes; and
- Perceptions of the capacity of partners and ultimate recipients to respond to the accelerated delivery approaches.
4.2.3.1 Clarity and understanding of criteria
Finding: Funding recipients felt that the information on project eligibility was available when needed and was clearly understood.
As shown in the following table, respondents to the survey of recipients felt that the information on project eligibility was available when needed — this information was available on numerous federal and provincial web sites, and it was contained in contribution agreements as well. They also felt that it was clear and that they understood which projects would be eligible for funding.
Table 7 – Recipient Perceptions of Project Eligibility Criteria
| Mean rating14 of these questions for the process used during the initial project selection | Mean rating14 of these questions for the process used during the deadline extension process | |
|---|---|---|
| Information on project eligibility was available when I needed it. | 3.0 | 2.8 |
| Information on project eligibility was clear. | 3.0 | 2.9 |
| I understood which projects would be eligible for funding (middle column) or extension (far right column) | 3.0 | 3.0 |
There were some differences among respondent groups:
- Those that participated in the extension process agreed slightly less with the first two statements (in relation to the original application process).
- ISF respondents from Manitoba and those with direct agreements with INFC did not feel they had as great an understanding as ISF respondents in other regions.
- Participants in the CC Top-Up program provided the highest ratings.
4.2.3.2 Satisfaction with the delivery process
Finding: Recipients and delivery partners were generally satisfied with the level of consultation and communication.
Finding: Recipients were reasonably satisfied with the funding approval process, with the exception of understanding why projects were rejected and, for those projects involved in the extension process, the timeliness of communicating funding decisions.
Finding: There was a low degree of satisfaction among recipients regarding the progress reporting process. While the overall average shows a positive rating of satisfaction, nearly 40% of the recipients surveyed expressed being less than satisfied; whereas a large percentage of INFC staff considered these reporting requirements to be an appropriate accountability mechanism.
The level of satisfaction of delivery partners and ultimate recipients with various aspects of the delivery process is discussed below.
First, regarding the level of consultation/engagement between delivery partners and ultimate recipients, the survey results were as follows:
- Recipients in the ISF program were satisfied with the advice and support they received from INFC (survey rating of 3.0 out of 4) and the province/territory with which they had an agreement (survey rating of 3.2).
- Recipients in the CC Top-Up program were satisfied with the advice and support they received from the province (survey rating of 3.3).
- Recipients in the NRT program were satisfied with the advice and support they received from the National Trails Coalition (survey rating of 3.3).
The interview data confirmed these satisfaction levels.
Regarding consultation between delivery partners themselves, the results of the interviews were that satisfaction with consultation/engagement and communication was generally rated as 3 out of 4 among those who responded (where 1 meant "not satisfied" and 4 meant "very satisfied"). A separate question asked interviewees about the level of cooperation among partners, and the results in all cases were that relationships and cooperation were strong.
Regarding the funding approval process, participants in the three programs gave the following average ratings (out of 4) to five statements related to the initial deadline process and to essentially the same statements related to the extension period process (see table 7).
All these statements regarding the funding approval process were rated reasonably highly, except for:
- Understanding why projects were rejected (in both the initial approval process and the extension process).
- Timeliness of communicating decisions (extension process).
Table 8 – Recipient Perceptions of Initial Deadline and Extension Process
| Statement | Average rating related to the initial deadline | Average rating related to the extension period process |
|---|---|---|
| Project approval decisions were communicated in a timely manner |
|
|
| Project approval decisions were clear |
|
|
| I understood why my project(s) was/were accepted |
|
|
| I understood why my project(s) was/were rejected |
|
|
| Overall I am satisfied with the project application and approval process/project extension process |
|
|
Participants in the three programs gave the following average ratings (out of 4) to four statements related to the reporting process.
Table 9 – Recipient Perceptions of Reporting Process
| Statement | Average Rating |
|---|---|
| The project reporting requirements were clear |
|
| Roles and responsibilities for project reporting were understood |
|
| Reporting requirements were not overly burdensome |
|
| Overall, I am satisfied with the project reporting requirements |
|
Perceptions regarding reporting:
- For ISF, the overall average ranged from 2.5 to 2.9, indicating respondents did not completely agree that project reporting requirements were clear, roles understood, not overly burdensome, and satisfactory. In addition, nearly 45% of respondents disagreed to a certain extent that the reporting requirement "was not burdensome".
- For CC Top-Up, of these four statements on project reporting, the one that the greatest number of respondents did not agree with was the "not overly burdensome" statement; close to 20% did not agree.
- For NRT, almost all the respondents (85% or higher) felt the project reporting requirements were clear, they understood their roles and responsibilities, and they were satisfied with the requirements. However, over 25% of respondents felt that the reporting requirements were overly burdensome.
Interviews with recipient respondents validated these findings. Particularly with regard to ISF, reporting was regarded as onerous, and SIMSI was not initially available because the system was still under development as ISF was being delivered. INFC staff acknowledged the challenges of reporting for recipients. However they consider this as an integral part of the program design to ensure an adequate level of accountability. According to ISF staff, the level of reporting was necessary to ensure better decision making. In addition, the reporting requirements for the EAP were relatively streamlined when compared to previous programs.
For ISF, some recipients also indicated that reporting requirements changed over the course of the program, that the frequency of reporting was excessive (monthly, quarterly and interim updates required) and that the level of detail required to support proof of payment was duplicative and cumbersome. In the case of CC Top-Up, some respondents indicated that multiple requests for status updates outside of the reporting schedule and the level of detail required to support proof of payment made the reporting process onerous. For NRT, monthly reporting was initially viewed as onerous and excessive; however, it became accepted.
4.2.3.3 Capacity to respond to accelerated delivery
Finding: Capacity to respond to accelerated delivery was a challenge for a minority of provincial and FDP delivery partners in the CC Top-Up program, and for about a third of the ultimate recipients in the ISF program that experienced delays.
Finding: Sixty per cent of ultimate recipients indicated challenges arose from the short timelines, but over 40% said there were positive impacts. The main challenges were insufficient human resources to manage projects (especially in ISF) and increased construction costs (especially in CC Top-Up), but noted that, given the need for speed, these were beyond the control of the program.
With regard to the capacity to respond to accelerated delivery approaches, this was investigated for both delivery partners and ultimate recipients.
Delivery partners for the Section 4.2.3.3
With regard to ISF, the majority of provincial/territorial representatives said they had the capacity to respond to the accelerated delivery. However, staffing at the municipal level was reported as difficult, particularly when there were multiple projects or only volunteer staff. For CC Top-Up, a majority of the provincial and FDP representatives reported that they had the capacity to respond, but 40% (in both cases) disagreed. Regarding NRT, 80% of NTC representatives reported that they had the capacity to respond.
Ultimate recipients for the Section 4.2.3.3
In the survey, ultimate recipients were asked about four possible resourcing issues that might have contributed to delays. For ISF, 34% of the respondents cited resourcing issues within their own organization; 11% cited insufficient trades or expertise available to perform the work. For CC Top-Up, only 1% cited resourcing issues within their own organization; 10% cited insufficient trades or expertise available to perform the work. For NRT, 8% cited resourcing issues within their own organization; there do not appear to have been any other significant resourcing issues.
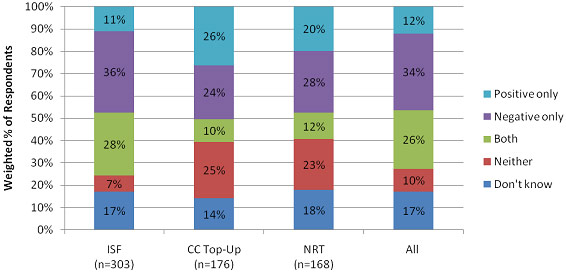
Impacts of short timelines
Sixty per cent of survey respondents indicated challenges arose from the short timelines.15 This is illustrated below.
Chart 2 – Impact(s) of short timelines on your organization
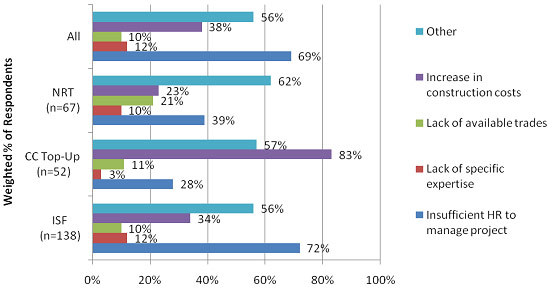
As shown in the following chart, the main challenges were insufficient resources for ultimate recipients to manage projects (especially in ISF) and increased construction costs (especially in CC Top-Up). Some recipients expressed that there were significant challenges in acquiring staff needed to support these initiatives due to budget, lack of available candidates and shortage of consultants.
Chart 3 – Negative impact(s) of short timelines
Evaluation Question 3: To what extent were the changes in the delivery process over the course of the program managed at the strategic and operational levels?
This question dealt with whether the necessary organizational changes to deliver the initiative effectively were made, as well as the extent to which these changes were well managed.
Summaryfor Evaluation Question 3
The evidence indicates that INFC mobilized to an adequate extent for EAP delivery:
- The necessary organizational changes, such as increasing staff and structural re-organization, were identified early on;
- Changes were fully implemented — sufficient additional staff for INFC were hired and necessary organizational changes were made; and
- People management appears to have been done well — in spite of the significant workload, the majority of INFC staff felt they were engaged and informed and received clear direction.
We deal sequentially with the identification of the required organizational changes, the implementation of these changes, and the people management considerations that accompanied the implementation of these changes.
Finding: INFC identified the necessary changes as a result of EAP commitments early on and instituted the necessary adjustments to accommodate the new programs. The department increased its staff during the EAP period, mostly to support the EAP programs, and created the necessary groups to support implementation.
INFC recognized change was required as a result of EAP commitments and the "need for speed". Requirements were documented initially in the 2009-12 Departmental Business and Human Resources Plan (HR plan), and then subsequently updated in 2010-13. Additionally, human resource risks related to administrative and monitoring requirements were noted during initial planning for both CC Top-Up and NRT.
The HR plan for 2010-13 describes the adjustments that were made for EAP — e.g., new Full-Time Equivalents (FTEs) were added, a persistent FTE gap was closed, a working group was formed to address systematic recruitment, a branding statement was developed, as well as a recruitment strategy, which included the development of a web page to support recruitment activities, the implementation of an ambassador program, and specific strategies for attracting candidates from three target markets.
During the period of this evaluation, INFC increased its staff by 89 employees overall, with 20 staff dedicated to the ISF program. The Stimulus Fund Directorate was first created under the Policy and Communications Branch and was later moved to the Program Operations Branch once the program was in full implementation.
In CC Top-Up, there was some perception (by about 30% of the interview respondents) that INFC staff were new to their positions and did not have extensive knowledge of the issues. However, this was not reported for the other programs. In general, it took a significant effort in hiring, movement from within the Department (i.e., reassignment of staff from other areas of the Department), and workload pressures to deliver EAP on time.
The conclusion of the interviews regarding this issue is that the challenges were appropriately dealt with by having a committed group of individuals operating under strong leadership of both the Assistant Deputy Minister and the Associate Deputy Minister. The modest size of the department enabled resources to be realigned quickly and effectively.
The staff workload was significant, and employees had differing reactions to the overtime required. While some employees were willing to work overtime for the experience and exposure it offered, the workload pressures were difficult on others. Nevertheless, staff reported that they were engaged and informed and received clear direction throughout implementation.
Regarding the extent to which ISF staff agreed with the statement that they received clear direction, 50% of interviewees rated this as a 3 or 4 out of 4 (50% did not respond). Similarly, regarding the extent to which ISF staff were engaged and informed, 50% rated this as a 3 or 4 out of 4 (44% did not respond).
In the CC Top-Up program, 57% rated the extent to which they received clear direction as a 3 or 4 out of 4 (29% did not respond). In addition, 57% rated the extent to which they were engaged and informed as a 3 or 4 out of 4 (29% did not respond).
Evaluation Question 4: To what extent did the EAP initiatives achieve the intended outputs?
The logic model for the EAP initiative indicates that there were two main intended outputs of these three programs:
- The leveraging of additional funds from other sources to support the infrastructure projects; and
- The implementation of agreements regarding program delivery with all the delivery partners.
Under this question we report on the extent to which these outputs occurred, with particular emphasis on the details of the leveraging that occurred.
Summaryfor Evaluation Question 4
The evidence indicates that the main intended outputs of these three programs were achieved:
- The contribution agreements for each province/territory spelled out thresholds for federal and other funding for each of the various types of assets, and, with only a few minor exceptions, all these funding thresholds were met.
- The federal government contributed 37% of the costs of ISF projects, 32% of the costs of CC Top-Up projects, and 41% of the costs of NRT projects. Provincial governments contributed 33% of the total costs of both ISF and CC Top-Up; municipal governments contributed 25% and 34% respectively.
- All the agreements that were necessary for program delivery were in place.
4.2.4 Leveraging
4.2.4.1 Leveraging of Funding
Finding: The contribution agreements for each province/territory spelled out thresholds for federal and other funding for each of the various types of assets — e.g., for ISF provincial/territorial assets a maximum of 50% of federal funding; for CC Top-Up projects a maximum of 33% of federal funding in each province. The available data indicate that, with only a few minor exceptions, all these leveraging thresholds were met.
The maximum thresholds for ISF funding by type of asset were:
- (A) Provincial/territorial assets – maximum 50% from federal sources
- (B) Local/non-profit assets – 33.3% from federal sources, up to 50% allowed
- (C) For profit assets – maximum of 25% from federal sources.
- (D) For federal assets – up to 100%
The following chart shows that funding for ISF at an aggregate level was within the threshold outlined above for federal and other funding. Furthermore, funding by the types of assets was also within the threshold, with the exception of the "Non-Profit Private Sector Asset."
Chart 4 – Sources of funding for each type of asset
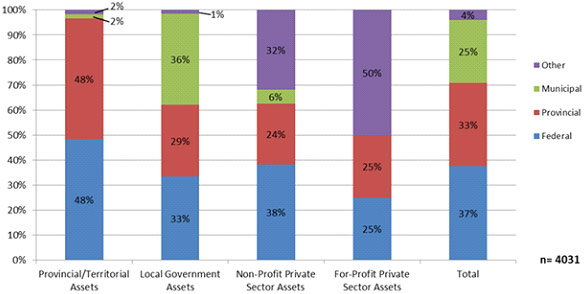
The cost-sharing thresholds for CC Top-Up projects were as follows:
- (E) Regional/local airports:
- Private sector assets – maximum of 25% from federal sources
- Provincial contribution no less than federal
- Local/regional contribution 33%
- (F) Maximum funding from federal sources in each province, for all projects, is 33.3%
- (G) Individual projects – funding from federal sources can be up to 50%, except for a private sector asset, where the maximum is 25%.
The following chart shows that, at an aggregate level (i.e., for CC top-Up overall) criterion E was met (since there were no private sector assets in this category) and criterion F was met in most provinces with funding matched at near 33% with slightly higher values shown for Saskatchewan, Ontario and Nova Scotia (see Table 10 below). We cannot draw definitive conclusions regarding criterion G, but it is likely that this criterion was met as well, since "non-governmental" includes both non-profit non-governmental organizations and private sector organizations, and since federal funding for this category was only 33%.
Chart 5 – CC Top-Up sources of funding for each type of asset
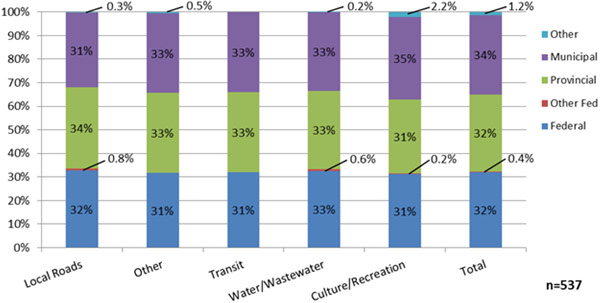
The following table provides more detail regarding threshold criterion F. It shows that almost all provinces met this one-third requirement. Saskatchewan, Ontario, and Nova Scotia projects were slightly over this threshold (shown in red).
Table 10 – Funding from Federal Sources by Province
| Province | # of projects | CC Top-Up | Other Federal | Total Eligible | % of Total from Federal Sources | ||
|---|---|---|---|---|---|---|---|
| (n) | (%) | ($ 000s) | (%) | ($ 000s) | ($ 000s) | ||
| BC | 55 | 10.2% | $61,137 | 12.9% | $1,713 | $213,034 | 29.5% |
| AB | 36 | 6.7% | $44,494 | 9.4% | $0 | $145,466 | 30.6% |
| SK | 49 | 9.1% | $14,412 | 3.1% | $511 | $43,235 | 34.5% |
| MB | 22 | 4.1% | $17,874 | 3.8% | $0 | $57,829 | 30.9% |
| ON | 187 | 34.8% | $191,593 | 40.6% | $2,583 | $575,758 | 33.7% |
| QC | 105 | 19.6% | $108,789 | 23.0% | $0 | $343,700 | 31.7% |
| NB | 21 | 3.9% | $11,104 | 2.4% | $0 | $37,811 | 29.4% |
| PE | 1 | 0.2% | $2,100 | 0.48% | $0 | $6,300 | 33.3% |
| NS | 43 | 8.0% | $13,209 | 2.8% | $1,605 | $39,701 | 37.3% |
| NL | 18 | 3.4% | $7,407 | 1.6% | $0 | $22,220 | 33.3% |
| Total | 537 | 100.0% | $472,119 | 100.0% | $6,412 | $1,485,055 | 32.2% |
The threshold for funding for NRT projects was that federal funding had to be cost-matched from provincial, municipal, private, or other sources. The program data indicated that 473 out of the 474 projects were funded by NRT up to the 50% level, and one project was over by $289 (0.1%).
4.2.4.2 Sources of leveraged funds
Finding: All projects leveraged funding from other sources. The main sources utilized were the other two levels of government: provincial and municipal. The federal government contributed 37% of the costs of ISF projects, 32% of the costs of CC Top-Up projects, and 41% of the costs of NRT projects.
Overall, as shown below, the federal government contributed 37% of the total eligible cost of ISF projects and leveraged $6 billion from provincial, territorial, municipal, and other partners, to invest close to $10 billion in infrastructure projects. The main partners in these projects came from the two other levels of government, and only 4% came from non-government sources.
Chart 6 – ISF sources of funding
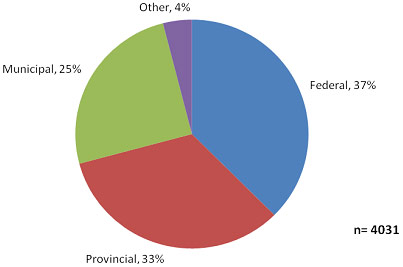
The following is a breakdown of ISF sources of funding by province:
Chart 7 – ISF funding sources by province
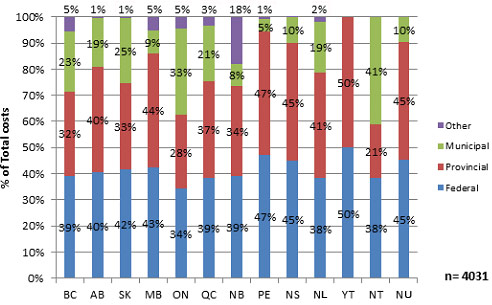
The fifteen ISF projects in the Yukon were funded equally by the federal and territorial governments. Projects that received a low percentage of funds from municipal governments were located in Manitoba, New Brunswick, PEI, and Nunavut.
On a project by project basis, the table below shows that close to 60% of the projects were cost-shared by all three levels of government concurrently, with most of the projects being funded equally between the three levels. This reflects the requirements of the program.
Table 11 – ISF Funding by Level of Government
| Source(s) of funding between governments | Projects | Federal Funds | Total Costs | % Total from ISF | Most Common Split | ||||
|---|---|---|---|---|---|---|---|---|---|
| (n) | % | ($Ms) | % | ($Ms) | % | Split with Federal | (n) | ||
| Provincial and Municipal | 2,380 | 59% | $1,792.6 | 50% | $5,410.9 | 56% | 33.1% | 33/33/33 | 2,203 |
| 25/25/50 | 58 | ||||||||
| Provincial only | 824 | 20% | $1,091.7 | 30% | $2,202.3 | 23% | 46.9% | 50/50 | 785 |
| Municipal only | 574 | 14% | $262.3 | 7% | $777.4 | 8% | 33.7% | 33/67 | 577 |
| Provincial and Other16 | 95 | 2% | $183.7 | 5% | $509.6 | 5% | 36.0% | - | - |
| All | 97 | 2% | $130.7 | 4% | $395.7 | 4% | 33.0% | - | - |
| Other only | 55 | 1% | $142.9 | 4% | $315.4 | 3% | 45.3% | - | - |
| Municipal and Other | 6 | 0% | $9.0 | 0% | $28.0 | 0% | 32.2% | - | - |
| Total | 4,031 | 100% | $3,612.9 | 100% | $9,639.3 | 100% | 37.5% | - | - |
Note: Percentages rounded to closest per cent.
Funding of the $1.5 billion in total costs for the CC Top-Up program came roughly equally from the three levels of government as shown below.
Chart 8 – CC Top-Up funding sources
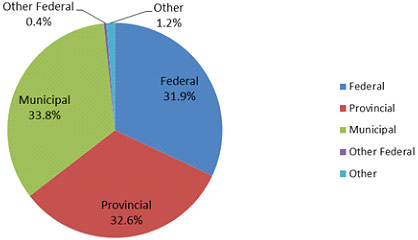
The following is a breakdown by province.
Chart 9 – CC Top-Up funding partners by province
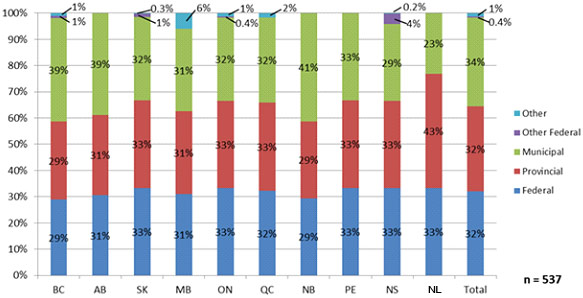
The following table shows that close to 90% of projects had the two other levels of government (municipal and provincial) as funding partners, with most of the costs-shared equally between the three levels of government for those projects.
Table 12 – CC Top-Up Funding by Level of Government
| Source(s) of funding between governments | # of projects | Federal – CC Top-Up | Other Federal ($Ms) | Total Eligible ($Ms) | % of Total from Federal Sources | Most Common Splits | |||
|---|---|---|---|---|---|---|---|---|---|
| (n) | % | ($Ms) | % | Split with Federal | (n) | ||||
| Provincial and Municipal | 471 | 87.7% | 414.0 | 87.7% | $5.5 | $1,309.7 | 32.0% | 33/33/33 | 409 |
| 45/45/10 | 26 | ||||||||
| 33/37/30 | 9 | ||||||||
| Provincial, Municipal, Other Federal | 37 | 6.9% | $30.6 | 6.5% | $0.7 | $91.0 | 34.4% | 33/33/17/1 | 11 |
| 45/45/5/5 | 5 | ||||||||
| Provincial, Municipal and Other17 | 16 | 3.0% | $22.3 | 4.7% | $0.0 | $67.2 | 33.2% | 33/33/33 | 3 |
| Provincial and Other | 6 | 1.1% | $2.9 | 0.6% | $0.0 | $9.4 | 30.8% | - | - |
| All | 6 | 1.1% | $2.1 | 0.4% | $0.2 | $7.3 | 31.7% | - | - |
| Provincial, Other Federal and Other | 1 | 0.2% | $0.2 | 0.0% | $0.0 | $0.5 | 45.0% | - | - |
| Total | 537 | 100.0% | $472.1 | 100.0% | $6.4 | $1,485.1 | 32.2% | - | - |
Note: Percentages rounded to closest per cent.
The NTC's program data categorized¸ various non-INFC sources of funding as provincial government, municipal government, other federal and 'other'. The following table summarizes the number and value of projects by sources of funding. Close to 40% of projects were funded through NRT and other sources with mainly a split of (or close to) 50/50.
Table 13 – NRT Funding by Level of Government
| Source(s) of funding between governments | # of projects | Federal-NRT Fund | Total Cost ($000s) | NRT as % of Total | Most Common Splits | |||
|---|---|---|---|---|---|---|---|---|
| (n) | % | ($000s) | (%) | Split with NRT | (n) | |||
| Other only | 180 | 38.0% | $4,668 | 20.1% | $9,609 | 48.6% | 50/50 | 131 |
| 49/51 | 13 | |||||||
| 48/52 | 10 | |||||||
| Provincial only | 86 | 18.1% | $5,513 | 23.7% | $12,285 | 44.5% | 50/50 | 62 |
| 49/51 | 8 | |||||||
| Provincial and Other18 | 72 | 15.2% | $3,830 | 16.5% | $8,779 | 43.6% | 50/26/24 | 5 |
| 50/50/1 | 5 | |||||||
| Municipal only | 50 | 10.5% | $2,769 | 11.9% | $6,639 | 41.7% | 50/50 | 18 |
| Provincial, Municipal and Other | 33 | 7.0% | $2,784 | 12.0% | $8,251 | 33.7% | 50/45/1/5 | 9 |
| Municipal and Other | 29 | 6.1% | $1,567 | 6.7% | $3,531 | 44.4% | - | - |
| Provincial and Municipal | 16 | 3.4% | $1,468 | 6.3% | $3,650 | 40.2% | - | - |
| Provincial, Other Federal and Other | 4 | 0.8% | $385 | 1.7% | $2,008 | 19.1% | - | - |
| All four | 3 | 0.6% | $212 | 0.9% | $1,601 | 13.2% | - | - |
| Municipal, Other Federal and Other | 1 | 0.2% | $28 | 0.1% | $128 | 21.8% | - | - |
| Total | 474 | 100.0% | $23,223 | 100.0% | $56,581 | 41.0% | - | - |
Note: Percentages rounded to closest per cent.
4.2.5 Number and nature of agreements
Finding: All necessary agreements required to distribute the project funds were in place with the provinces/territories, FDPs, the NTC, and the parties with direct federal contribution agreements where applicable.
Contribution agreements were put into place with the provinces or territories to assist in the collection and administration of project applications and monitoring for both the ISF and CC Top-Up initiatives. For the CC Top-Up initiative, a Service Level Agreement was also signed with the FDPs. The third initiative, NRT, was delivered through an agreement with the National Trails Coalition.
For ISF, projects within some provinces were funded through provincial/territorial agreements, the exceptions being BC, Alberta, Saskatchewan, Ontario, and Quebec. In these five provinces, some projects were approved through direct federal contribution agreements with local governments, non-profit organizations, and federal port authorities. For some federal projects, Treasury Board approval was given to facilitate federal transfers to other federal organizations.
For CC Top-Up funds were delivered by FDPs through a Service Level Agreement with INFC. The Ministers responsible for the FDPs in each province were authorized to sign-off on projects to a ceiling amount and any projects over the ceiling were authorized by the Minister of Transport, Infrastructure, and Communities.
4.3 Performance
Evaluation Question 5: To what extent did the EAP initiatives achieve desired outcomes?
The main intended outcomes of these components of the EAP initiative were to:
- Facilitate the construction of "shovel-ready" infrastructure projects through the provision of timely and temporary federal funding support.
- To ensure that new infrastructure is built and existing infrastructure is improved.
In this section we examine the extent to which these outcomes were achieved. While we take into account the EAP extension period up to October 31, 2011, we also identify characteristics of projects that relate to their success in meeting the initial March 31st, 2011 deadline for project completion.
Summaryfor Evaluation Question 5
- INFC was able to commit a majority of the ISF funding in the first year of the program. $3.88 billion, or 99% of the total project funds, was committed to projects by January 29, 2010, the target date for the approval of funding set out by the initiative.
- By the time the program ended on October 31, 2011, 97% of ISF projects and 97% of CC Top-Up projects were completed. 67% of ISF projects and 49% of CC Top-Up projects were substantially completed by the initial program deadline of March 31, 2011. As a one year program nearly all NRT projects were substantially completed by March 31, 2010. The program completion rate reflects the effectiveness of project selection and the quality of projects that met the "construction-ready" criteria.
- Overall, about 32% of EAP projects (ISF and CC Top-Up) sought an extension.
- The data indicate that there are several characteristics of projects that are related to the probability of their having met the initial March 31, 2011 deadline for project completion:
- Materiality – less expensive projects were more likely to have been completed earlier;
- Project type – local roads (and highway infrastructure) had the highest completion percentage, and recreational and cultural infrastructure had the lowest completion percentage;
- Risk rating – projects rated initially as lower risk were more likely to have been completed by March 31, 2011. These relationships held for both the ISF and CC Top-Up programs.
4.3.1 Construction-Ready Projects were provided with Funding
Finding: A majority of the EAP funding (ISF & CC Top-Up) was committed to approved projects the first year of the program. For ISF, $3.88 billion, or 99% of the total project funds19, were committed by January 29, 2010, the target date for the approval of funding set out by the EAP initiative. For CC Top-Up, $496 million, or 99% of the CC Top-Up funding had been committed.
A key objective of EAP initiatives was to commit the funding quickly to recipients. This would enable "construction ready" projects to initiate or accelerate the acquisition of materials, signing of contracts and hiring of people. Since the speed was of essence for the success of EAP ("timely stimulus"), the basic premise for the evaluation was that the earlier funds were committed, the earlier projects would begin to do their part in stimulating the economy.20 For the analysis of funds committed for both ISF and CC Top-Up, we used the earlier date between the project announcement date and Contribution Agreement Schedule sign date.
4.3.2 Infrastructure Built
We examined the extent to which infrastructure was built and existing infrastructure improved within the EAP timelines. Our evaluation confirms that by the time the initiatives ended on October 31, 2011, 97% of both the ISF and the CC Top-Up projects were completed.
Percentage of ISF projects complete
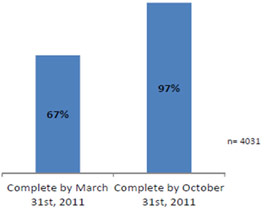
Percentage of CC Top-Up projects complete
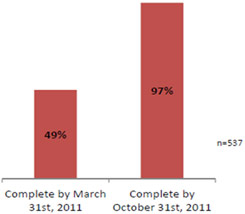
Overall, about 32% of the projects were completed after the initial EAP deadline of March 31, 2011. By initiative, 33% of ISF and 51% for CC Top-Up received an extension beyond the initial deadline. As a one year program, the deadline for NRT was March 31, 2010; no NRT projects sought extensions.
Data available at the time (April, 2012) indicates the following actual or planned completion dates for extended ISF projects (Chart 10).
Chart 10 – Completion dates for ISF projects requiring an extension
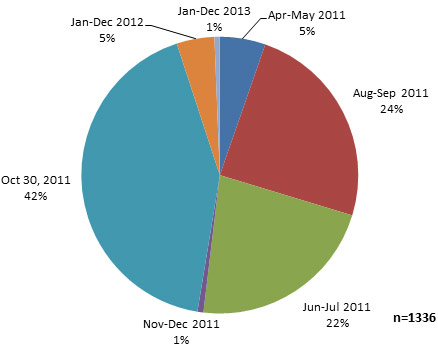
Note: Excludes PRECO projects.
Only 3% (or 14 projects) of CC Top-Up projects were not completed by the extension deadline of October 31, 2011. They are scheduled for completion by November 2012.
We also analyzed how certain variables related to project completion timelines. The basic premise was that speedier project completion was desirable, given that in the stimulus scenario the overall goal was to influence aggregate demand through rapid injection of money into the economy.
We used the initial EAP deadline of March 31, 2011 as a yardstick. However, we should caution the reader that the importance of this deadline should not be overstated. We understand that while a large number of projects were already completed by March 31, 2011 some project proponents in all likelihood took advantage of the extension period to adjust their schedule and complete their projects after March 31, 2011 even though it may have been possible for them to meet the original deadline.
As such, we tested whether the positive correlation that would be expected in theory between completion dates and variables such as materiality, would be observed in reality. Specifically, we examined the following variables in relation to project completion dates:
- Materiality
- Project category
- Project risk rating
4.3.2.1 Materiality
Finding: For both ISF and CC Top-Up, there appears to be a clear relation between the probability of project completion earlier (e.g. by March 31, 2011) and project materiality — i.e., less expensive projects were more likely to have been completed by March 31, 2011.
Our analysis shows that while one-third of the ISF projects received an extension beyond the initial deadline of March 31, 2011, those represented roughly two-thirds (60%) of the funds that were approved. This shows that, as expected, smaller projects tended to be completed more quickly.
To further examine the impact of project materiality, we examined the relationship between total eligible costs of projects and their likelihood of being completed by the initial EAP deadline of March 31, 2011. The chart below illustrates the ISF completion percentage based upon materiality of the total eligible costs. We see a decrease in the completion percentage with an increase in the value of the total eligible costs.
Chart 11 – % of ISF projects and value of projects substantially completed by March 31st, 2011 by materiality (total eligible costs)
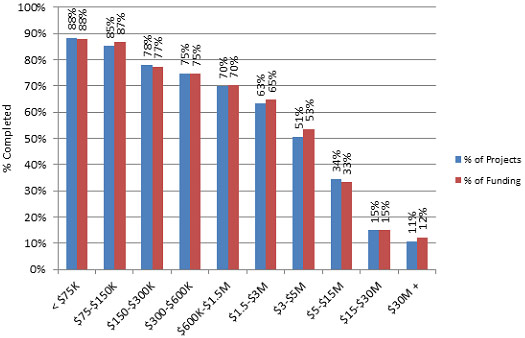
As with ISF, we found that the percentage of CC Top-Up projects that were substantially completed by the initial deadline decreased as the materiality of funds increased. Over 80% of projects with eligible costs of less than $250 thousand were completed by March 31, 2011, whereas only 4% for the projects that cost $10 million or more were completed by then.
Chart 12 – % of CC Top-Up projects and value of projects substantially completed by March 31st, 2011 by materiality (total eligible costs)
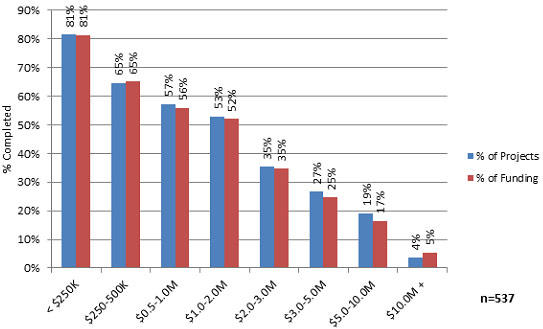
4.3.2.2 Project category
We examined how project categories related to completion timelines. The following chart shows the distribution of ISF projects by category. One-third of the projects were water or wastewater infrastructure, 26% were local roads projects, and 15% involved highway infrastructure. For CC Top-Up, 36% of CC Top-Up projects were for water or wastewater infrastructure, 30% were for community infrastructure, and 28% were local roads projects.
Chart 13 – Distribution of funded ISF projects by project category
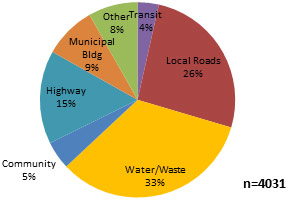
Chart 14 – Distribution of funded CC Top-Up projects by project category
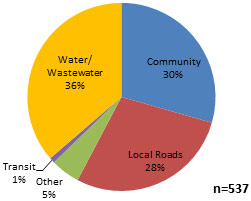
The NRT program aimed to devote one-third of its funding to each of three types of trails — non-motorized, snowmobile, and all terrain/off-road vehicles. However, as shown below, less was spent on all terrain/off-road trails and more was spent on non-motorized trails.
Chart 15 – Distribution of funded NRT projects by project category
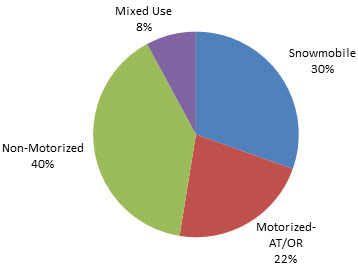
Finding: For both ISF and CC Top-Up, local roads (and highway infrastructure) had the highest completion rate while community infrastructure (consisting of recreational and cultural projects) had the lowest completion rate by the initial deadline.
For the ISF program, comparing the percentages completed by project categories, we see that a high percentage of the local roads and highway infrastructure projects were completed by the initial deadline. Only 32% of the projects (representing 10% of ISF funding) for community facilities were completed within the same timeframe.
Chart 16 – % of ISF projects and value of projects completed on March 31st, 2011 by project category
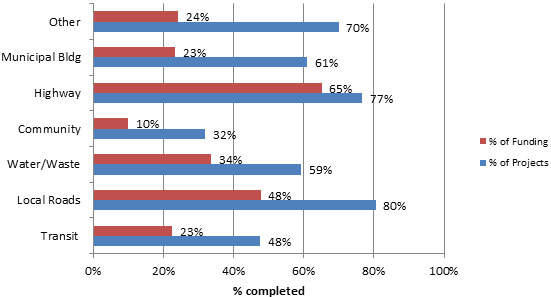
CC Top-Up shows a similar pattern. By project category, we see that local roads had the highest completion percentage at 68% of projects and 39% of funding value. Community projects (recreational or cultural infrastructure) had the lowest completion percentage at 36% of projects and 13% of funding value.
Chart 17 – % of CC Top-Up projects and value of projects completed on March 31st by project category
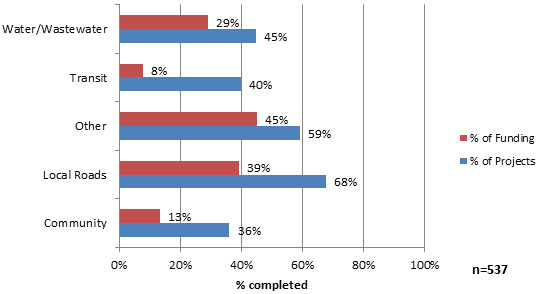
4.3.2.3 Risk rating
Finding: For both ISF and CC Top-Up, there appears to be a clear relationship between the probability of project completion by the initial deadline and the risk rating — i.e., projects rated as lower risk were more likely to have been completed by the deadline.
At the time of project approval, projects were assigned a risk rating. INFC analysts then reviewed project risk ratings on a quarterly basis. A project's original risk rating was based on a number of areas, including:
- Organizational risk (whether the ultimate recipient was a province, territory, municipality, or non-profit organization [governance, capacity to deliver the project, history of project delivery])
- Financial risk (such as financial materiality of the project, cost-sharing, funding security)
- Program risk (such as the proposed construction timelines, status of obtaining permits, plans, designs and contract tender readiness, and other approvals as may be required, etc.)
- Other risk (such as environmental assessment and aboriginal consultation requirements or other risks/issues identified)
The chart below shows the percentage of completed ISF projects (by the initial deadline) based upon their earliest risk rating; we see that the percentage of completed projects decreases (for both the number and value) with an increase in risk rating.
Chart 18 – % of ISF projects and value of projects substantially completed by March 31st, 2011 by earliest risk rating
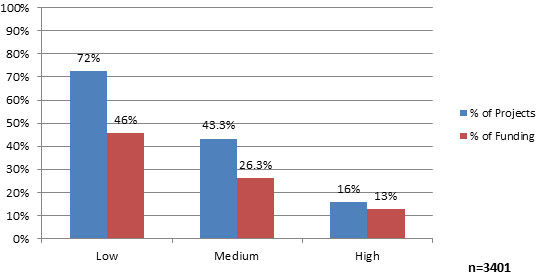
Note: excludes 28 projects for which no risk rating was available; excludes PRECO projects.
The same is true for CC Top-Up projects. Most of the CC Top-Up projects were given an initial risk rating of "low." Fifty-one per cent of these projects were completed by the initial deadline, while only 18% of the projects with a "medium" risk rating were completed within the same time frame.
Chart 19 – % of CC Top-Up projects and value of projects completed by March 31st, 2011 by initial risk rating
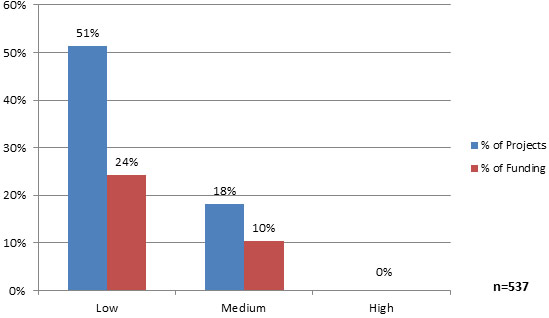
In addition to examining through database analysis the impact of variables such as materiality on project timelines, we also asked funding recipients to identify reasons that contributed to project delays.
Finding: The main reasons given for project delays that were experienced in ISF and CC Top-Up were "external factors" over which there was no control. The timeliness of project approvals was the least important factor in ISF and the 3rd most important factor in CC Top-Up in causing project delays.
Based on the results of the survey of participants, the main reasons for the project delay(s) were "external factors" over which there was no control. Most prominent among these factors were weather conditions, selected by over 80% of all respondents, and supplier and material availability. Other noteworthy reasons were:
- More than 40% of ISF respondents also selected
- expansion in project scope
- tendering (of subcontractors) taking longer
- not enough planning time
- 20% or more of CC Top-Up respondents selected
- expansion in project scope
- timeliness of project approval
- Over 60% NRT respondents selected
- timeliness of project approval
- and close to 30% selected longer tendering and more planning needed
- delays did not impact the deadline, since no projects sought extensions.
The timeliness of project approvals was identified by funding recipients as the least important factor (6th most important) in ISF and the 3rd most important factor in CC Top-Up. Some recipients also noted delays in getting projects approved as a significant factor in late start for many projects.21
The details are shown in the chart below, which has been derived from the survey data.
Chart 20 – Reasons for Delays
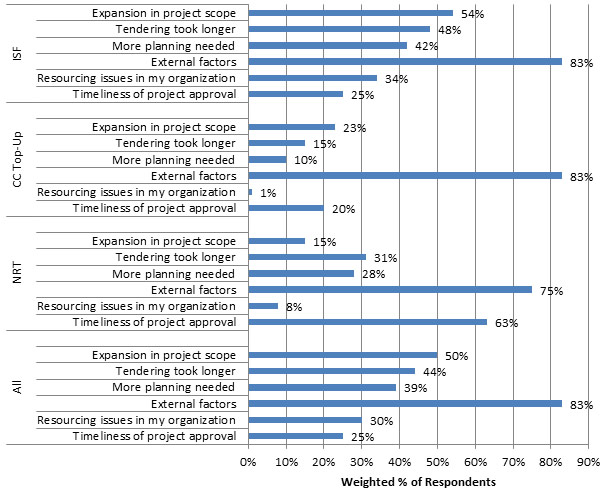
4.4 Efficiency
Evaluation Question 6: Were the contributions of funds of the EAP initiatives administered efficiently?
The question of the efficiency and economy of program delivery is a required evaluation question under current TBS evaluation guidelines. Under this question we consider:
- Whether there are more efficient program delivery models that could have been used or changes to the program delivery process that would have made it more efficient; and
- The costs of administering the EAP initiatives.
Summaryfor Evaluation Question 6
- Of the three delivery models examined, the ISF model was identified by interviewees including INFC officials and some recipients, as the best model for quick delivery of these types of infrastructure programs. There were no changes recommended to the delivery process to significantly improve the efficiency the three programs.
- The ISF initiative was delivered within the allotted 3% funding provided for administration under the program authorities. Based on the data available, the costs of ISF delivery were 1.4% of total program costs which were well within the limits of ISF's program authorities.
4.4.1 Analysis of EAP Delivery Models
Finding: The ISF was an effective model for quick delivery of infrastructure funding.
INFC Program delivery officials and program participants involved in the ISF and CC Top-Up programs suggested that ISF was a better model, for several reasons:
- The claims were processed at INFC, instead of by the FDPs. This ensured that the process was shorter and more efficient.
- This model also reduced the level of risk to the Government of Canada. Requiring the provinces and territories to attest in Contribution Agreements that they had the capacity to manage projects lowered the risk of incompletion.
- For expedited projects, it was viewed as more effective to have a single federal department responsible for program delivery.
However, some of the INFC staff who were involved in the ISF program reported that unrealistic expectations may have been created regarding how future infrastructure programs would be delivered and noted, in particular, that this program may not provide a good model for future program delivery unless the program had to be delivered very quickly. Staff who responded in this manner indicated several reasons why this method of delivering an infrastructure program as not sustainable. Among the reasons cited were:
- a) Expecting employees to work long hours on a regular basis to deliver programming was not realistic; and
- b) Many infrastructure projects need significant time for planning, which was not permitted in some cases under ISF.
In the case of CC Top-Up, according to interviewees from the provinces, it was simpler for the provinces to work directly with INFC rather than with other FDPs. Dealing with one department or agency would make such programs more efficient. Quick project approval was the key. The design of a more robust communications plan would reportedly have improved communication and increased clarity as well.
In the case of NRT, interviewees felt that it was appropriate that INFC was not involved in project selection as they were with the other programs (this role was performed by NTC). There was not enough time to get all projects done in the one year timeframe if they had. Some felt that earlier negotiation could have been better because construction may have begun closer to the start of the construction season, offering more time for projects.
4.4.2 Efficiency of Administrative Spending
Finding: It is estimated that 1.4% of total funding for ISF was spent on internal administration.
It was not possible to isolate the administrative costs for all the EAP programs. The department tracks administrative costs at the departmental level. Existing systems do not track or tie specific administrative costs to a particular program or project. An estimated figure for ISF provided by INFC Finance was used to assess the efficiency of administrative spending. According to internal documents, the estimate for the total cost of administration for ISF was $56.3M at the time when the evaluation was undertaken. Since projects approved totalled $3.88B, approximately 1.4% of program was spent as the administrative portion for the ISF. The program authorities provided for up to 3% operating costs for program delivery, thus, ISF was found to be well within the authorities for the initiative.
For CC Top-Up and NRT, internal administration costs for these programs were generally unavailable. CC Top-Up is an extension of a pre-existing program (BCF–CC) and the administration costs were not separated exclusively for the CC Top-Up portion. Externally, FDPs for CC Top-Up could receive up to 3.5% of funds from the initial CC allocations, and up to a further 2% for communications and environmental assessments. Actual administrative costs expended by FDPs were not included in calculations as they were unavailable. In the case of NRT, the delivery partner (NTC) and funding recipients bore a large portion of the administration costs. A 4% allocation from total funding was available for this purpose and according to NTC's Financial Summary Final Report the actual amount was reported to be under this threshold at approximately 3.4%.
5 Conclusions and Lessons Learned
The program delivery process
The "need for speed" was the driving factor in the way in which the three EAP initiatives were designed and implemented, and key features of these programs to ensure success were:
- increased Ministerial delegated spending authority for project approvals
- effective risk rating and management tools
- use of committees for the collective review of proposals to ensure due diligence
While the need to deliver funding quickly was the priority, all the key components for effective delivery were addressed by INFC, including: the governance regime, the specification and communication of the roles and responsibilities of all the parties, the specification of authorities for decision-making regarding project approvals, risk management mechanisms, project and program progress reporting as well as the specification and communication of guidelines regarding project eligibility, leveraging, and other key implementation details.
Almost all of these components worked well, and implementation of the programs was successful. There were some best practices, such as the use of the PRP, which brought senior INFC management together for collective decision-making.
In order to avoid possible overlap and duplication, early engagement with provinces/territories and other funding partners to clarify roles and responsibilities is important.
INFC successfully mobilized for EAP delivery — the necessary organizational changes were identified early on (e.g., the need to hire additional staff, the need to create new organizational units to support program implementation, such as the Stimulus Fund Directorate), and these changes were fully and successfully implemented. However, further thought could have been given to winding down the programs in particular the redeployment of staff or alternatively, whether more temporary solutions could have been considered including a greater use of secondments and terms.
Of the three EAP initiatives, the ISF model was found to be, in our view, the most appropriate model for the "timely, targeted and temporary" delivery of infrastructure funding. Utilization of the PRP for effective project reviews and ensuring projects were approved in a timely manner was seen as a best practice.
While internal administration cost were not available for all three EAP programs, estimates for the ISF program indicated that the program was delivered efficiently with low internal administration costs of apporximately 1.4% which were within the limits of program authorities22. Based on the materiality of the ISF program, the EAP initiative was considered to have been delivered efficiently.
Program Outputs and Outcomes
The main intended outputs of these three programs were achieved:
- The specified thresholds for federal funding and funding by other sources for each of the various types of assets were all met, with only a few minor exceptions.
- A substantial amount of funding from other levels of government was leveraged (cost-shared) — the federal government contributed 38% of the costs of ISF projects, 32% of the costs of CC Top-Up projects, and 41% of the costs of NRT projects. Provincial governments contributed 33% of the total costs of both ISF and CC Top-Up; municipal governments contributed 25% and 34% respectively.
- All agreements necessary for program delivery were in place.
The main categories of projects funded in the two major programs were water/wastewater infrastructure and local roads.
INFC achieved a high level of funding commitment in the first year of the ISF: $3.88 billion, 99% of the total project funding committed by January 29, 2010, the target date for the approval of funding set out by the EAP initiative; for CC Top-Up $496 million, or 99% of the total project funding was committed in the first year.
By the time the EAP initiatives ended on October 31, 2011, 97% of both the ISF and CC Top-Up projects were completed. The majority of EAP projects were completed by the initial deadline of March 31, 2011 (67% of ISF projects and 49% of CC Top-Up projects). However, in terms of the value of projects, completed projects represented a minority of the planned funding in both ISF and CC Top-Up.
There were several characteristics of projects (in both ISF and CC Top-Up) that relate to the probability of being completed more quickly:
- Materiality – less costly projects were more likely to have been completed earlier;
- Project type – local roads (and highway infrastructure) had the highest completion percentage by the initial program deadline, and recreational and cultural infrastructure had the lowest completion percentage for the initial program deadline;
- Risk rating – projects initially rated as lower risk were more likely to have been completed by March 31, 2011.
This implies that, in future infrastructure programs, where quick delivery is a key component, the above three factors — materiality, project type and risk rating — should be taken into consideration in project selection. In particular, the risk rating approach appeared to be highly accurate and capable of identifying projects that are likely to be completed within timelines.
Overall, 32% of the projects required an extension, representing 64% of the total value of projects funded. The main reasons cited for project delays that were experienced in all three programs were "external factors", most notably, weather conditions.
In general, the INFC components of the EAP program were delivered effectively and efficiently, and there were no major problems. In addition, the intended outputs and outcomes of these initiatives were achieved.
The following lessons learned are provided for consideration for future INFC programs, including but not limited to short term and targeted programs.
LESSONS LEARNED AND BEST PRACTICES
To help ensure success of short-term targeted initiatives such as the EAP, the following lessons learned and best practices should be considered:
Design and Delivery
Lessons Learned for Design and Delivery
- Consider project-type (e.g., highway infrastructure) in assessing project readiness and likelihood of completion.
- Establish reasonable cost thresholds for project funding as lower cost projects had higher probability of completion on time.
- Early engagement with provinces/territories and other funding partners and stakeholders to clarify respective roles and responsibilities and avoid overlap and duplication (e.g., reporting requirements, payment processing).
- Assess capacity and resources of ultimate recipients to implement the project under short timelines to ensure government and leveraged support is sufficient so that the project will not be forced to seek funding from other sources or incur delays which could impact on performance and results.
- Ensure common understanding amongst partners of program-specific expectations and terms such as "substantially completed", "leveraging", "attestation" and "shared risk".
Best Practices for Design and Delivery
- Ensure sufficient thresholds of Ministerial spending authorities to streamline decision-making and project approvals.
- Use a risk-based assessment approach and allow projects to begin construction immediately upon announcement prior to agreements being signed.
- Use existing applications and projects already identified by a province or territory as construction-ready.
- Use project review committees for the collective review of proposals to expedite the approvals process and project risk management (e.g., program authorities including eligibility requirements are respected).
Change and Risk Management
Lessons Learned for Change and Risk Management
- Establish clear and consistent internal communications with employees and reduce mixed messages with external stakeholders and recipients.
- Assess and identify the business process changes required and impact on stakeholders as early as possible.
- Use a variety of recruitment mechanisms including secondments, term and contract employees to avoid challenges on winding down short-term initiatives.
- Realign existing resources and establish dedicated HR unit or committee for recruitment and staffing.
Best Practices for Change and Risk Management
- The ISF Risk Rating model was effective and should be considered for future INFC initiatives particularly where the Minister is directly accountable for spending and results.
- Use streamlined but regular (e.g., quarterly) reports for progress monitoring and encourage program staff to be proactive with recipients to get information through other means if necessary (e.g., emails, telephone, working groups, other reports).
6. Approval
Original signed by
Raymond Kunze
Chief Audit and Evaluation Executive
Audit and Evaluation Branch
Infrastructure Canada
Yaprak Baltacıoğlu
Deputy Minister
Infrastructure Canada
Annex 1 - List of Acronyms
- AB
- Alberta
- ADM
- Assistant Deputy Minister
- ATV
- All Terrain Vehicle
- B
- Billion (usually $B, meaning billion dollars)
- BC
- British Columbia
- BCF
- Building Canada Fund (sometimes "BCP" is used for Building Canada Plan)
- CA
- Contribution Agreement (direct funding agreement between INFC and recipients of EAP funding)
- CC Top-Up (or CC)
- Funding Top-Up to the Communities Component of the BCF
- CFO
- Chief Financial Officer
- DM
- Deputy Minister
- DPR
- Departmental Performance Report
- EAP
- Economic Action Plan (of the Government of Canada)
- FDP
- Federal Delivery Partner
- FTE
- Full-Time Equivalent (people) [i.e., two people working half-time = one FTE]
- HR
- Human Resources
- INFC
- Infrastructure Canada
- ISF
- Infrastructure Stimulus Fund
- K
- Thousand (usally $K, meaning thousand dollars)
- M
- Million (usually $M, meaning million dollars)
- MB
- Manitoba
- MOU
- Memorandum of Understanding
- NA
- Not Applicable
- NB
- New Brunswick
- NL
- Newfoundland and Labrador
- NRT
- The National Recreational Trails program
- NS
- Nova Scotia
- NT
- Northwest Territories
- NTC
- National Trails Coalition
- NU
- Nunavut
- ON
- Ontario
- P/T
- Provincial and Territorial
- PE
- Prince Edward Island
- PMS
- Performance Measurement Strategy
- PRP
- Project Review Panel (an internal review body for the ISF program)
- QC
- Quebec
- RPP
- [Departmental] Report on Plans and Priorities
- SK
- Saskatchewan
- YT
- Yukon
Annex 2 - Glossary of Terms
- Federal Delivery Partner –
- A federal department or agency who administers all or part of a given program in partnership with Infrastructure Canada.
- Incremental –
- The funding provided to recipients must be of additional benefit and does not replace, displace or remove existing funding from other sources.
- Leveraging –
- The federal funding provided is used as the basis to acquire additional capital, materials or services for the project from provincial and territorial partners in order to maximize stimulus impact.
- Need for speed –
- The federal Economic Action Plan emphasized the need to provide funding quickly in order to commence projects and to inject capital into the economy as stimulus.
- Shovel-ready/Construction ready –
- The projects must be ready to begin construction right away.
- Timely, temporary and targeted –
- Referring to the Budget 2011's commitment to Canada's Economic Action Plan in addressing the global economic and financial crisis to provide fast, relevant and focused actions
- Timely –
- Approvals for projects were fast-tracked and the pace at which federal funds were flowed was accelerated.
- Temporary –
- To avoid creating long-term deficits, the measures identified in the EAP needed to be phased out as the economy recovered. As such, costs incurred after the deadline set for the program funding would not be reimbursed.
- Targeted –
- Areas of specific stimulus including infrastructure were identified under the EAP initiative.
Annex 3 - EAP Logic Model
Annex 4 - Evaluation Matrix and Data Sources
Annex 5 - Data Collection Instruments
Footnotes
[1] See Section 3.3 Considerations and Limitations.
[2] Total project funding available for recipients was estimated at $3.92B based on the notional allocation to the provinces and territories.
[3] The funcing commitment for CC Top-Up fluctuated over time due to cost savings, project cancellations and other decisions. The maximum amount reached was $496M in January 2010.
[4] In the 2010-2012 RPP the strategic outcome 3 states that "Construction-ready infrastructure projects are provided with federal funding support".
[5] Assuming a simple random sample for a finite population.
[6] The reason for the lag is as follows: the contracting agency retained to carry out database analysis (as well as other evaluation work), ceased operations in July 2011 and was not available to complete the Statement of Work. This unforeseen circumstance delayed evaluation timelines considerably but also presented an opportunity, as it allowed the evaluation to take into account more fully the EAP extension period up to October 31, 2011. However, the data to cover the extension period only became entirely available in January/February 2012.
[7] Delegation of spending authorities was increased prior to EAP initiatives.
[8] A process by which organizations are directed and controlled; including mechanisms used to set direction (e.g. strategic decision making documents) and control (e.g. accountability mechanisms and performance and risk monitoring).
[9] Comments were that the province had one database, but that recipients also had to report through SIMSI for federal expenditures.
[10] This question was asked to INFC Senior Management, staff, and provincial officials.
[11] Not applicable to CC Top-Up. No CC Top-Up project exceeded the threshold for Ministerial spending authority.
[12] In INFC's case, the $100 million threshold for delegated Ministerial spending authority existed for other INFC programs prior to the EAP.
[13] The NRT Review was conducted by INFC Internal Audit in 2011. It reviews the programs and funds spent.
[14] For these ratings (and those that follow), a rating of 1 meant "strongly disagree" and 4 meant "strongly agree," unless indicated otherwise.
[15] Percentage of negative impact, 60%, is obtained by adding "Negative only" (34%) and "Both" (26%) categories from Chart 2. Similarly, the percentage of positive impact, 40%, is obtained by adding "Positive only" (13%) and "Both" (26%).
[16] "Other" refers to non-governmental sources of funding.
[17] "Other" refers to non-governmental sources of funding.
[18] "Other" refers to non-governmental sources of funding.
[19] The maximum funding commitment for ISF fluctuated over time due to cost savings, project cancellations and other decisions. The maximum amount reached was $3.92B in January 2010.
[20] Funds were considered committed as soon as a public announcement was made. If a Contribution Agreement was signed before any announcements were made, the funds were considered as having been committed on the date of signing.
[21] Report of the Auditor General, Fall 2011, section 1.50, page 18.
[22] See Section 3.3 Considerations and Limitations.
- Date modified: