
Office of Infrastructure of Canada
Quarterly Financial Report for the quarter ended June 30, 2020
Office of Infrastructure of Canada
Quarterly Financial Report for the quarter ended June 30, 2020
Quarterly Financial Report for the quarter ended June 30, 2020 (PDF version) (668.43 KB)
Help on accessing alternative formats, such as PDF, PPT and ZIP files, can be obtained in the alternate format help section.
Statement outlining results, risks and significant changes in operations, personnel and programs
Introduction
This quarterly report has been prepared by management as required by Section 65.1 of the Financial Administration Act and in the form and manner prescribed by the Treasury Board. This quarterly report should be read in conjunction with the Main Estimates as well as Budget 2020.
The key to building Canada for the 21st century is a strategic and collaborative long-term infrastructure plan that builds economically vibrant, strategically planned, sustainable and inclusive communities. Infrastructure Canada (INFC) works closely with all orders of government and other partners to enable investments in social, green, public transit and other core public infrastructure, as well as trade and transportation infrastructure.
Further information on INFC's mandate, responsibilities, and programs can be found in INFC's 2020-21 Main Estimates.
Basis of Presentation
This quarterly report has been prepared by management using an expenditure basis of accounting. The accompanying Statement of Authorities includes INFC's spending authorities granted by Parliament and those used by INFC consistent with the Main Estimates and Supplementary Estimates for the 2020-21 fiscal year (FY). This quarterly report has been prepared using a special purpose financial reporting framework designed to meet financial information needs with respect to the use of spending authorities.
The authority of Parliament is required before monies can be spent by the government. Approvals are given in the form of annually approved limits through Appropriation Acts or through legislation in the form of statutory spending authority for specific purposes.
INFC uses the full accrual method of accounting to prepare and present its annual departmental financial statements that are part of the departmental performance reporting process. However, the spending authorities voted by Parliament remain on an expenditure basis.
In the past, INFC has worked in collaboration with other federal departments and agencies to deliver some of its transfer payment programs (collectively known as federal delivery partners).
It should be noted that this quarterly report has not been subject to an external audit or review.
Highlights of Fiscal Quarter and Fiscal Year-to-Date Results
This section highlights the significant items that contributed to the change in resources available for use from 2019-20 to 2020-21 and in actual expenditures as of June 30, 2019 and June 30, 2020.
Authorities
Graph 1: Comparison of Authorities Available as of June 30, 2019 and June 30, 2020
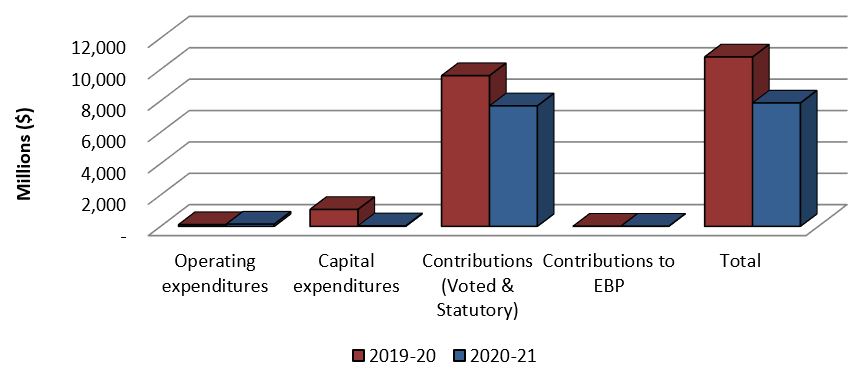
Text description of Graph 1
Bar graph showing the comparison of authorities available for use as of June 30, 2019 and June 30, 2020.
- Operating authorities available as of Q1 2019-20 were $108.03 million, compared with $140.61 million as of Q1 2020-21.
- Capital authorities available as of Q1 2019-21were $1.08 billion, compared with $32.59 million as of Q1 2020-21.
- Contribution (Voted and Statutory) authorities available as of Q1 2019-20 were $9.60 billion, compared with $7.68 billion as of Q1 2020-21.
- Contributions to the Employee Benefit Plan authorities available as of Q1 2019-20 were $6.89 million, compared with $7.76 million as of Q1 2020-21.
- The total of authorities available for use as of Q1 2019-20 were $10.80 billion, compared with $7.86 billion as of Q1 2020-21.
As shown in the Statement of Authorities, INFC's total authorities available for 2020-21 are $7.861 billion as of the end of Quarter 1 (Q1) and represent a $2.936 billion decrease compared to the same quarter in the prior year.
This decrease is summarized in the table below:
| Authorities | Increase/(Decrease)
vs. Prior Year-to-date (000's) |
% Change vs. prior year |
|---|---|---|
| Operating Expenditures | 32,587 | 30.2% |
| Capital Expenditures | (1,044,467) | (97.0%) |
| Contributions (Voted and Statutory) | (1,925,098) | (20.0%) |
| Contributions to Employee Benefit Plans | 870 | 12.6 % |
The sources of significant year-over-year changes are summarized as follows:
- Operating Expenditures – This increase is mainly due to funding received to sustain departmental operations, a new branch was created to better support Canadian communities under the Rural Economic Development portfolio, and the transition from construction of the Samuel de Champlain Bridge Corridor project to the Operating, Maintenance and Rehabilitation (OMR) phase.
- Capital Expenditures – This decrease is attributable to the substantive completion of the construction for the Samuel De Champlain Bridge Corridor project in fiscal year 2019-20.
- Contributions (Voted and Statutory) – This decrease is mainly due to the one-time additional statutory funding announced as part of Budget 2019 for the Gas Tax Fund and the Municipal Asset Management Program.
- Contributions to Employee Benefit Plans – This increase is reflective of the growth in full time equivalents (FTEs).
Expenditure Analysis
Expenditures at the end of Q1 were $2.350 billion, compared to $312.6 million reported in the same period of 2019-20, representing an increase of 651.7% between Q1 of the two years. The source of the relative increase is demonstrated in the tables, graphs and analysis below.
Graph 2: Comparison of Total Expenditures as of June 30, 2019 and June 30, 2020
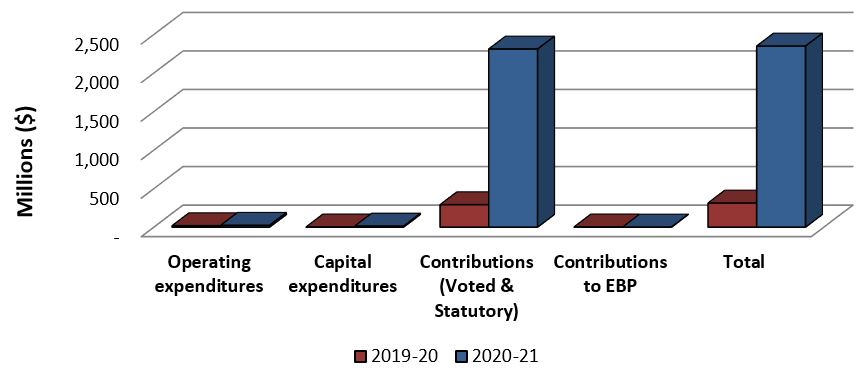
Text description of Graph 2
Bar graph showing the comparison of total expenditures used year-to-date as of June 30, 2019 and June 30, 2020.
- Authorities used for Operating as of Q1 2019-20 were $18.16 million, compared with $24.09 million as of Q1 2020-21.
- Authorities used for Capital as of Q1 2019-20 were $1.97 million, compared with $13.17 million as of Q1 2020-21.
- Authorities used for Contributions (Voted and Statutory) as of Q1 2019-20 were $290.76 million compared with $2.31 billion as of Q1 2020-21.
- Authorities used for Contributions to the Employee Benefit Plan as of Q1 2019-20 were $1.72 million, compared with $1.29 million as of Q1 2020-21.
- Total year-to-date budgetary expenditures as of Q1 2019-20 were $312.61 million, compared to $2.35 billion as of Q1 2020-21.
| Year-to-date expenditures | Increase/(Decrease)
vs. Prior Year-to-date (000's) |
% Change vs. prior year |
|---|---|---|
| Operating Expenditures | 5,938 | 32.7% |
| Capital Expenditures | 11,201 | 567.5% |
| Contributions (Voted and Statutory) | 2,020,730 | 695.0% |
| Contributions to Employee Benefit Plans | (429) | (24.9%) |
The sources of significant year-over-year changes are summarized as follows:
- Operating and Capital Expenditures – Details provided later in report, by standard object.
- Contributions (Voted and Statutory) – Details by program below.
- Contributions to Employee Benefit Plans – The decrease is mainly due to a timing difference in the posting of actual expenditures. The contributions to EBP is expected to increase in coming quarters due to the growth in full time equivalents (FTEs).
Graph 3: Comparison of Authorities used for Contributions as of June 30, 2019 and June 30, 2020
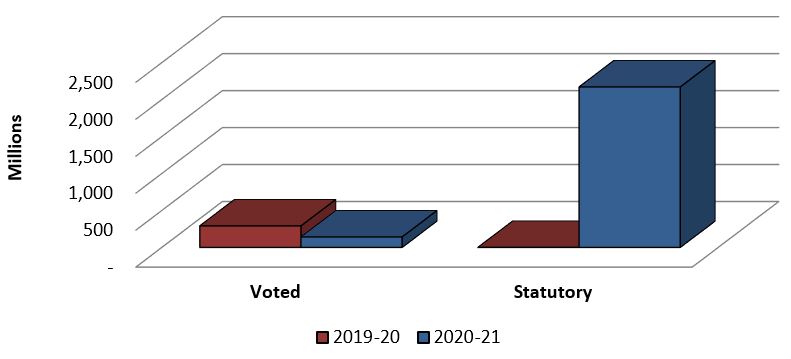
Text description of Graph 3
Bar graph showing the comparison of authorities used for Contributions (Voted) and Contributions (Statutory) as of June 30, 2019 and June 30, 2020.
- Contributions (Voted) expensed as of Q1 2019-20 were $290.76 million, compared with $141.17 million as of Q1 2020-21.
- Contributions (Statutory) expensed as of Q1 2019-20 were $0, compared with $2.17 billion as of Q1 2020-21.
Significant changes in year-to-date contribution expenditures between June 2019 and June 2020 were as follows:
| Program Fund | Increase/(Decrease)
vs. Prior Year-to-date (000's) |
% Change vs. prior year |
|---|---|---|
| Gas Tax Fund (GTF)* | 2,170,316 | N/A |
| New Building Canada Fund-Provincial-Territorial Infrastructure Component-National and Regional Projects (NBCF-PTIC-NRP) | 50,716 | 169% |
| Disaster Mitigation and Adaptation Fund (DMAF)* | 7,035 | N/A |
| Capacity Building for Climate Change Challenges Fund (CB3C) | 5,176 | 67% |
| New Building Canada Fund-National Infrastructure Component (NBCF-NIC) | 5,031 | 1,274% |
| P3 Canada Fund (P3CF) | (35,179) | (72%) |
| Clean Water Wastewater Fund (CWWF) | (58,374) | (93%) |
| Building Canada Fund-Major Infrastructure Component (BCF-MIC) | (114,435) | (100%) |
* No expenditures were made as of Q1 2019-20.
The sources of significant year-over-year changes are summarized as follows:
- GTF – On June 1, 2020, the Government of Canada announced that the allocation of $2.2 billion under the federal Gas Tax Fund would be accelerated this year and provided in a single payment in June to help Canadian communities recover from the COVID-19 pandemic as quickly as possible while respecting public health guidelines.
- NBCF-PTIC-NRP – With significant projects underway in this program, there is an increase in claims being submitted in 2020-21.
- DMAF – Several contribution agreements were signed in the latter part of 2019-20. Those contribution agreements are now incurring costs and claims are being submitted to INFC.
- CB3C – Forecasts are significantly higher this year than last year and as a result, more claims have been submitted in Q1 of 2020-21 versus Q1 of last year.
- NBCF-NIC – With all contribution agreements in this programs now signed, many of the contribution agreements are claiming more compared to last year and causing an increase.
- P3CF – Some contribution agreements reached completion in 2019-20, there are fewer claims being made and this explains the decrease compared to last year.
- CWWF – Forecasts in these contribution agreements are decreasing and therefore fewer expenses are being made.
- BCF-MIC – There have been fewer claims compared to last fiscal year, however they are expected to increase in the coming quarters.
Departmental Budgetary Expenditures by Standard Object
The planned Departmental Budgetary Expenditures by Standard Object are set out in the table at the end of this report. Aggregate year-to-date expenditures in 2020-21 increased by $2.04 billion, compared with the same quarter last year. The largest single factor was an increase in transfer payments as explained above.
A breakdown of variances in year-to-date spending by standard object is below:
| Changes to Expenditures by Standard Object | Increase/(Decrease) vs. Prior Year-to-date (000's) | % Change vs. prior year |
|---|---|---|
| Transfer payments | 2,020,730 | 695.0% |
| Professional and special services | 5,837 | 91.9% |
| Acquisition of land, buildings and works* | 4,602 | N/A |
| Other subsidies and payments | 3,689 | 318,004.6% |
| Personnel | 2,028 | 14.1% |
| Repair and maintenance | 700 | 212.0% |
| Acquisition of machinery and equipment | 171 | 726.0% |
| Rentals | 93 | 32.8% |
| Utilities, materials and supplies | (13) | (57.2%) |
| Information | (131) | (87.2%) |
| Transportation and communications | (265) | (93.5%) |
* No expenditures were made as of Q1 2019-20.
The sources of significant year-over-year changes are summarized as follows:
- Transfer payments – Details were previously discussed.
- Professional and special services – The increase is mainly due to an increase in engineering costs related to payments for the Réseau Express Métropolitain (REM) project which will be reimbursed based on an agreement between REM Inc. and Infrastructure Canada.
- Acquisition of land, buildings and works – No expenditures were made as of Q1 2019-20.
- Other subsidies and payments – The increase is mostly explained by an interest expense payment made for the Samuel De Champlain Bridge corridor project.
- Personnel – Increase in number of employees.
Overall, INFC has spent 29.9% of its current Total Authorities as of June 30, 2020, compared to 2.9% at the end of Q1 of the previous fiscal year.
Risks and Uncertainties
In most cases, INFC funds projects via a Contribution Agreement or Integrated Bilateral Agreement between Canada and a Provincial/Territorial (PT) government. PT governments then enter into their own agreements with municipalities, who are ultimately responsible for project management and construction of the infrastructure.
Most of INFC's programs are structured in such a way that funding flows from the Department based on requests for reimbursements. It is important to note that federal spending is not an accurate measure of when the economic activity created by infrastructure spending occurs. When projects are approved, work begins and economic activity is generated by provinces, territories (PT) and municipalities, which are responsible for implementing projects and incurring costs. Infrastructure Canada makes the federal contribution only when requested by partners.
There are a variety of reasons that can affect the timing of requests for reimbursements, which can contribute to a variance between planned spending and actual spending. Some projects, once approved, move quickly into the construction phase while others have longer lead times for planning, and local approval processes (e.g. zoning and permitting). Regardless of how long planning takes or how soon ground can break, eligible costs can be submitted for reimbursement throughout the life of the project.
INFC encourages PTs to submit claims in a timely manner to ensure the flow of funding as planned. Parliamentary authority to spend typically expires at the end of the fiscal year; however, in response to the needs of its project partners, INFC reprofiles its authorities as needed so that the funding committed to specific projects continues to be available in future years when needed.
INFC is working with provinces and territories on exploring new approaches and tools to better align federal investments with construction activity taking place and ensure better predictability in the flow of funding.
Over the last four and a half years, the Department has been in a state of transformation. The introduction of new programs and responsibilities has resulted in structural changes to better support the delivery of new business lines, as well as required the department to move to more specialized skills and experience necessary for key positions. INFC is working to ensure it attracts and retains employees with the skill sets and experience necessary to fulfil the department's evolving mandate.
Significant Changes in Relation to Operations, Personnel and Programs
Infrastructure Canada continues to grow and evolve. Since the last Quarterly Financial Report, the following significant changes have taken place within the department:
- The department has increased its workforce to meet the additional operational requirements.
- Funding was received for the new branch created to better support Canadian communities under the Rural Economic Development portfolio.
- The transition from construction of the Samuel de Champlain Bridge Corridor project to the Operating, Maintenance and Rehabilitation (OMR) phase.
Approval by Senior Officials
Approved by:
Kelly Gillis
Deputy Head
Nathalie Bertrand
Chief Financial Officer
Signed at Ottawa, Canada
Office of Infrastructure Canada
Quarterly Financial Report
For the quarter ended June 30, 2020
Departmental budgetary expenditures by Standard Objects (unaudited)
(in thousands of dollars)
Fiscal year 2020-21
| N/A | Planned expenditures
for the year ending March 31, 2021 |
Expended during the
quarter ended June 30, 2020 |
Year-to-date used
at quarter-end |
|---|---|---|---|
| Expenditures: | |||
| Personnel | 60,260 | 16,434 | 16,434 |
| Transportation and communications | 1,563 | 18 | 18 |
| Information | 659 | 19 | 19 |
| Professional and special services | 36,099 | 12,186 | 12,186 |
| Rentals | 1,494 | 377 | 377 |
| Repair and maintenance | 46,238 | 1,030 | 1,030 |
| Utilities, materials and supplies | 163 | 10 | 10 |
| Acquisition of land, buildings and works | 4,602 | 4,602 | 4,602 |
| Acquisition of machinery and equipment | 3,048 | 194 | 194 |
| Transfer payments | 7,679,596 | 2,311,490 | 2,311,490 |
| Public debt charges | - | - | - |
| Other subsidies and payments | 26,835 | 3,690 | 3,690 |
| Total net budgetary expenditures | 7,860,557 | 2,350,050 | 2,350,050 |
Departmental budgetary expenditures by Standard Objects (unaudited)
(in thousands of dollars)
Fiscal year 2019-20
| N/A | Planned expenditures
for the year ending March 31, 2020 |
Expended during the
quarter ended June 30, 2019 |
Year-to-date used
at quarter-end |
|---|---|---|---|
| Expenditures: | |||
| Personnel | 51,992 | 14,407 | 14,407 |
| Transportation and communications | 1,054 | 283 | 283 |
| Information | 546 | 150 | 150 |
| Professional and special services | 77,868 | 6,351 | 6,351 |
| Rentals | 2,562 | 284 | 284 |
| Repair and maintenance | 5,643 | 330 | 330 |
| Utilities, materials and supplies | 192 | 22 | 22 |
| Acquisition of land, buildings and works | 1,050,000 | - | - |
| Acquisition of machinery and equipment | 2,114 | 24 | 24 |
| Transfer payments | 9,604,694 | 290,760 | 290,760 |
| Public debt charges | - | - | - |
| Other subsidies and payments | - | 2 | 2 |
| Total net budgetary expenditures | 10,796,665 | 312,613 | 312,613 |
Download
If the following document is not accessible to you, please contact infc.info.infc@canada.ca for assistance.
- Departmental budgetary expenditures by Standard Objects (PDF version) (20.70 KB)
Help on accessing alternative formats, such as PDF, PPT and ZIP files, can be obtained in the alternate format help section.
Office of Infrastructure Canada
Quarterly Financial Report
For the quarter ended June 30, 2020
Statement of Authorities (unaudited)
(in thousands of dollars)
Fiscal Year 2020-21
| N/A | Total available for use for the year ending March 31, 2021 |
Used during the quarter ended June 30, 2020 |
Year-to-date used at quarter-end |
|---|---|---|---|
| Vote 1 – Operating expenditures | 140,525 | 24,085 | 24,085 |
| Vote 5 – Capital expenditures | 32,590 | 13,174 | 13,174 |
| Vote 10 – Contributions | 5,509,280 | 141,174 | 141,174 |
| Budgetary Statutory Authorities | |||
| (S) – Contributions to employee benefit plans | 7,757 | 1,293 | 1,293 |
| (S) – Gas Tax Fund | 2,170,316 | 2,170,316 | 2,170,316 |
| (S) – Municipal Asset Management Program | - | - | - |
| (S) – Minister salary and car allowance | 89 | 8 | 8 |
| Total Budgetary Authorities | 7,860,557 | 2,350,050 | 2,350,050 |
| Non-Budgetary Authorities | - | - | - |
| Total Authorities | 7,860,557 | 2,350,050 | 2,350,050 |
Statement of Authorities (unaudited)
(in thousands of dollars)
Fiscal Year 2019-20
| N/A | Total available for use for the year ending March 31, 2020 |
Used during the quarter ended June 30, 2019 |
Year-to-date used at quarter-end |
|---|---|---|---|
| Vote 1 – Operating expenditures | 107,938 | 18,134 | 18,134 |
| Vote 5 – Capital expenditures | 1,077,057 | 1,974 | 1,974 |
| Vote 10 – Contributions | 5,203,781 | 290,761 | 290,761 |
| Budgetary Statutory Authorities | |||
| (S) – Contributions to employee benefit plans | 6,887 | 1,722 | 1,722 |
| (S) – Gas Tax Fund | 4,340,912 | - | - |
| (S) – Municipal Asset Management Program | 60,000 | - | - |
| (S) – Minister salary and car allowance | 90 | 22 | 22 |
| Total Budgetary Authorities | 10,796,665 | 312,613 | 312,613 |
| Non-Budgetary Authorities | - | - | - |
| Total Authorities | 10,796,665 | 312,613 | 312,613 |
Download
If the following document is not accessible to you, please contact infc.info.infc@canada.ca for assistance.
- Statement of Authorities (PDF version) (20.60 KB)
Help on accessing alternative formats, such as PDF, PPT and ZIP files, can be obtained in the alternate format help section.
Report a problem on this page
- Date modified: