
Evaluation of the Green Infrastructure Fund
Evaluation of Public Transit Infrastructure Fund — April 2021

Evaluation of Public Transit Infrastructure
Fund —
April 2021
(PDF Version)
- List of Acronyms
- 1.0 Executive Summary
- 2.0 Program Overview
- 3.0 Evaluation Objectives, Scope and Questions
- 4.0 Methodology, Limitations and Mitigation Strategies
- 5.0 Findings
- 6.0 Conclusions
- Annex A: PTIF Outcomes and Indicators Mapped with Evaluation Findings
- Annex B: PTIF Results Matrix
List of Acronyms
- CCPI
- Canada’s Core Public Infrastructure
- CUTA
- Canadian Urban Transit Association
- FAA
- Financial Administration Act
- GBA+
- Gender-based Analysis Plus
- IFR
- Infrastructure Financial Report
- INFC
- Infrastructure Canada
- PTIF
- Public Transit Infrastructure Fund
1.0 Executive Summary
Program Overview
The Public Transit Infrastructure Fund (PTIF) was a three-year (2016-17 to 2018-19), $3.4 billion program that provided short-term funding to help accelerate municipal funding to support the rehabilitation of transit systems, new capital projects, and planning studies for future transit expansion to foster long-term transit plans.
Evaluation Objective and Scope
The objective of this evaluation was to meet the requirements of section 42.1 of the Financial Administration Act (FAA) and to consider Gender-based Analysis Plus (GBA+) as expressed in the Treasury Board Directive on Results.
The evaluation looked at all approved and announced projects for PTIF from April 1, 2016 to March 31, 2019. Claims for PTIF projects continued to be paid and outcome reports received after this period, though these were outside of the scope of this evaluation.
Key Findings and Conclusions
Relevance
PTIF has addressed public transit needs.
Progress towards achievement of outcomes
Overall PTIF funding resulted in progress towards the immediate and intermediate expected outcomes outlined in its performance information profile:
- Communities benefitted from incremental PTIF funding.
- PTIF made progress towards the planning and implementation of transit system improvements and expansions.
- PTIF made progress towards the rehabilitation, optimization, modernization, efficiency, accessibility and safety of public transit systems.
- As of 2016, public transit ridership was increasing, after showing a decline.
Inclusivity
The 2016 Directive on Results requires evaluators to consider government-wide policy commitments, including Gender-based Analysis Plus (GBA+). PTIF met the government’s GBA+ requirementsFootnote 1 in its development and implementation.
The evaluation went beyond assessing the extent to which PTIF met the requirements for GBA+ in program development and implementation, to examine program results and external data through an inclusiveness lens more broadly. The intention of this analysis was not to draw conclusions on the relevance or effectiveness of PTIF, but rather to use available data to identify potential areas to consider in the development of future infrastructure programming. The analysis was conducted in keeping with the spirit of GBA+ to “assess how diverse groups of… people may experience government… programs”,Footnote 2 and should be considered supplemental to the evaluation of PTIF itself.
This supplemental GBA+ analysis looked at the proximity of public transit to social housing to determine if populations that would be most reliant on public transit due to economic status had access. Supplemental GBA+ analysis found that PTIF funding was concentrated within provinces to locations where social housing was within 1,000 metres of public transit stations and stops.
This indicates that funding supported areas that are well positioned to serve population groups that may rely on public transit, particularly in larger population centres. At the same time, it shows a gap where future public transit programming could be expanded to include areas where proximity to social housing is not within 1,000 metres.
Recommendations
The evaluation has no recommendations, as issues identified with the program’s performance measurement are being addressed through the Investing in Canada Infrastructure Program’s performance measurement strategy.
2.0 Program Overview
PTIF was a three-year (2016-17 to 2018-19), $3.4-billion contribution program. PTIF provided short-term funding to help accelerate municipal funding to support the rehabilitation of transit systems, new capital projects, and planning studies for future transit expansion to foster long-term transit plans.
PTIF funding was cost-shared between the government of Canada, provinces and territories and/or municipalities. The program was managed through funding agreements between INFC and each province and territory. Provinces and territories were responsible for program administration and distributing the funds to eligible recipients, which included municipal or regional governments, and transit agency authorities or organizations. Table 1 illustrates the number of approved projects under PTIF as well as INFC’s contribution and claims paid up to March 31, 2019.
| Number of Approved Projects | Number of Completed Projects | Program Contribution | Claims Paid |
|---|---|---|---|
| 1,204 | 428 | $3,184,640,425 | $853,614,842 |
Source: INFC’s Funding Reports. April 3, 2019.
3.0 Evaluation Objectives, Scope and Questions
The objective of this evaluation was to meet the requirements of section 42.1 of the FAA that requires, for programs with average spending greater than $5 million per year, an assessment every five years of relevance and effectiveness as defined by the Treasury Board:
- Relevance: the extent to which a program, policy or other entity addresses and is responsive to a demonstrable need. Relevance may also consider if a program, policy or other entity is a government priority or a federal responsibility.
- Effectiveness: the impacts of a program, policy or other entity, or the extent to which it is achieving its expected outcomes.Footnote 3
This evaluation also took into account the government-wide consideration of GBA+ in evaluations as outlined in the Treasury Board Directive on Results.
The evaluation looked at all approved and announced projects for PTIF from April 1, 2016 to March 31, 2019. Claims for PTIF projects continued to be paid and outcome reports received after this period, though these were outside of the scope of this evaluation.
Based on the evaluation objectives, the evaluation examined the following questions:
- Q1. Has the program addressed the infrastructure needs of Canadians?
- Q2. What progress has been made towards expected outcomes?
- Q3. To what extent is the program efficient?
- Q4. To what extent did the program take into account inclusiveness?
4.0 Methodology, Limitations and Mitigation Strategies
In view of the Department shifting its capacity to focus on responding to the COVID-19 pandemic in spring 2020, this evaluation was scoped to make use of data the Evaluation Directorate already had access to, eliminating the need for additional data requests. Data collected as part of previous thematic evaluations, including the Combined Audit and Evaluation of the Impacts of INFC Programs in the Territories and the Evaluation of the Impact of INFC Programs in the Vancouver Area, was also leveraged as applicable. Due to the shift in priorities it was decided to not conduct interviews as part of this evaluation.
The lines of evidence for this evaluation included the following:
4.1 Document Review
The document review was used to assess program relevance and effectiveness. Documents provided evidence on the need for the program, while progress towards program outcomes was assessed through provincial and territorial annual progress outcome reports. News releases and INFC social media posts related to PTIF were also reviewed, to provide information on communications made to the public.
A limitation of the document review was that annual progress outcome reports were not available for one province and the territories for 2016-2018 inclusively. In addition, in the annual progress outcome reports, provinces reported on performance indicators that they selected as the most relevant to their projects, limiting the information available for some indicators. Moreover, data that was available from outcome progress reports was not consistent among provinces, making it difficult to have a comparable picture between provinces and a national picture of progress towards outcomes.
To mitigate this limitation, literature and data reviews were conducted to gather additional information related to need and progress towards program outcomes.
4.2 Data Review
Program data available through the Infrastructure Financial Report (IFR) provided an overview of all funded projects (including data such as number of projects by funding category, status of projects, funds allocated, and claims paid) and was used to assess program relevance and effectiveness. As well, other data sources from Statistics Canada related to infrastructure, including Canada’s Core Public Infrastructure (CCPI) survey, were used to assess relevance and the CUTA Transit Fact Book was used to assess progress towards expected program outcomes.
4.3 Literature Review
The literature review examined academic and non-academic literature to identify infrastructure needs and the impact of infrastructure funding on long-term growth, a clean environment and resilient communities. The main source for the literature review was EBSCO, an academic library that provides a research database of e-journals, magazines, and e-books. The literature review was included in the evaluation to supplement existing data in support of the evaluation question of relevance and mitigate existing limitations to the methodology.
5.0 Findings
5.1 Relevance
The evaluation looked at Canadians’ needs for public transit infrastructure and the extent to which PTIF has addressed them.
Finding 1: PTIF has addressed public transit needs
Public transit needs identified in the literature, document and data review included planning and asset management; improving public transit services through expansion, replacement or rehabilitation of existing systems; increasing accessibility; sustaining public transit use, including increasing modal share and meeting demands of population growth; and reducing pollution and traffic congestionFootnote 4.
The projects funded by PTIF align to these identified needs. Provinces and territories were responsible for identifying projects in their own jurisdictions, within PTIF’s eligible categories, with the assumption that they would seek funding for projects that support their specific public transit needs. Table 2 shows a breakdown by program sub-categories. The majority of public transit projects under PTIF focused on improving public transit services through rehabilitation.
| PTIF Sub-Category | Number of Approved Projects | Percent of Approved Projects by Funding Category | Federal Contribution Dollars per Funding Category ($ million) | Percent of Federal Contribution Dollars by Funding Category |
|---|---|---|---|---|
| Projects for System Expansion | 171 | 14.2% | 647 | 20.3% |
| Support Asset Management Capacity | 44 | 3.7% | 46 | 1.5% |
| Support Design & Planning for the Future | 147 | 12.2% | 364 | 11.4% |
| Capital projects for rehabilitation | 842 | 69.9% | 2,127 | 66.8% |
| Grand Total | 1,204 | 100.0% | 3,184 | 100.0% |
Source: INFC’s Funding Reports. April 3, 2019.
Table 3 demonstrates the alignment between the PTIF sub-categories and needs identified in the document, data and literature review. It also illustrates examples of PTIF projects that support the identified needs.
| Eligible Funding Sub-Category | Identified Need | Example of Funded ProjectFootnote 5 |
|---|---|---|
|
Capital projects for the rehabilitation, optimization and modernization of public transit infrastructure, or that improve the efficiency, accessibility and/or safety of public transit infrastructure |
Improving and rehabilitating services, and system expansion |
Prince Edward Island: Public Transit Phase II Upgrades included the modernization of the buses to improve the efficiency and safety of public transit. Phase II included the purchase of additional transit shelters, routing and shelter signage and upgrades to the transit IT technology. |
|
Increasing accessibility |
Manitoba: Accessibility upgrades for up to 160 bus stops which includes paving work, landing pads, improved lighting and installation of seating. |
|
|
Expenditures to support the asset management capacity of a public transit system |
Planning and asset management |
Ontario: Enterprise Asset Management (EAM) system that enables Metrolinx to store baseline data about assets, the network, asset age, and condition. An EAM system helps support and prioritize funding required to ensure Metrolinx assets are kept in a state of good repair. |
|
Expenditures to support the design and planning for the future expansion and improvements to public transit systems, including transportation demand management measures and studies and pilot projects related to innovative and transformative technologies |
Planning and asset management |
Nova Scotia: The purpose of this study was to conduct an analysis of the opportunities and feasibility of implementing a Bus Rapid Transit service in Halifax. |
|
Reducing pollution and traffic congestion |
Quebec: As part of its electrification program, and in accordance with the Quebec government's GHG reduction objectives, the Société de transport de Laval (STL) introduced its first totally electric bus route, as a demonstration project, but also in order to refine the processes for implementing this type of technology. The project consisted of carrying out a series of studies to prepare for the implementation of this electric route. |
|
|
Sustained public transit use, increasing modal share and meeting demands of population growth |
Alberta: Study, design and planning for future service expansion to keep up with geographic growth, service demand and potential regionalization of services - including alternative service delivery models. |
|
|
Projects for system expansion, which may include active transportation |
Reducing pollution and traffic congestion |
Newfoundland: Purchase of a transit priority system to give priority to public transit vehicles at identified intersections. This type of system enables transit vehicles to maintain schedules and can improve route timing by 10% making transit a more attractive travel option and can reduce fleet requirements. It can reduce traffic delays by up to 40%, minimize fuel costs up to 19% and greenhouse gas emissions up to 30%. |
|
Sustained public transit use, increasing modal share and meeting demands of population growth |
British Columbia: The project involved extending an existing bus only lane on Highway 1 (Douglas Street) by approximately 2 km from Tolmie Ave to Burnside Bridge to reduce transit travel times, improve reliability and support increased mode share on a primary transportation corridor experiencing significant levels of congestion. |
Source: INFC’s Funding Reports. April 3, 2019.
5.2 Progress Towards Expected Outcomes
The findings in this section are based on PTIF’s outcomes and indicators identified in the performance information profile (PIP). The assessment was conducted by looking at the indicators and the data sources identified in the PIP. The data sources are the Infrastructure Final Report, and provincial and territorial program outcome reports. A mapping of the findings related to progress towards outcomes and indicators as outlined in the PIP can be found in Annex A.
Finding 2: Communities benefited from incremental PTIF funding
The evaluation found that communities benefitted from the federal share of PTIF funding. Half of the costs for PTIF project funding were covered by federal contributions. As a result, communities benefitted from a federal program contribution of $3.18 billion in new funding for public transit under PTIF. Between April 1, 2016 and March 31, 2019, INFC approved 1,204 public transit projects. Table 4 provides the distribution of funding and projects by province and territory.
| Province / Territory | Approved | |
|---|---|---|
| Project Count | Federal Contribution | |
| British Columbia | 28 | $451,850,000 |
| Alberta | 74 | $347,189,326 |
| Saskatchewan | 14 | $28,710,000 |
| Manitoba | 64 | $69,479,369 |
| Ontario | 651 | $1,476,371,561 |
| Quebec | 324 | $766,369,474 |
| New Brunswick | 4 | $8,652,604 |
| Nova Scotia | 24 | $30,938,000 |
| Prince Edward Island | 2 | $653,400 |
| Newfoundland | 17 | $3,216,692 |
Northwest Territories |
1 |
$320,000 |
Yukon |
1 |
$890,000 |
| Total | 1,204 | $3,184,640,425 |
Source: INFC Financial Report. April 3, 2019.
Program funding was allocated to the provinces and territories based on the 2014 CUTA ridership data, including a minimum base amount of $50,000 for each recognized transit system within a jurisdiction.
Since the creation of PTIF, new data on public transit assets has been captured through the CCPI survey. As part of the evaluation, an analysis of the percentage of each province and territory’s public transit assets that are in poor or very poor condition, was conducted. This data was compared to the federal contribution for each province and territory. As seen in Figure 1, for the majority of provinces and territories, especially those with a larger percentage of assets in poor or very poor condition, the condition of assets did not align with the share of federal funding.
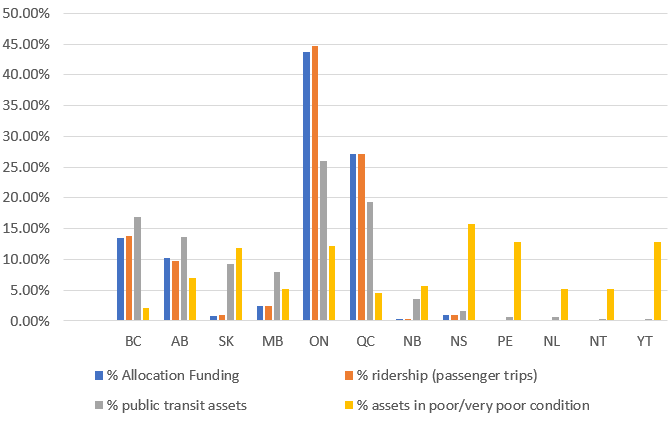
Description of Figure 1: Distribution of Public Transit Ridership, Quantity and Condition of Public Transit Assets Compared to PTIF Funding Allocations
This figure presents the percent of public transit assets compared to percent of program contribution, percent of ridership (passenger trips), percent of public transit assets and percent of assets in poor or very poor condition by province and territory. The distribution is as follows:
- British Columbia 14.19% program contribution, 16.83% public transit assets; 2.1% assets in poor/very poor condition; 13.79% ridership.
- Alberta 10.90% program contribution, 13.65% public transit assets; 6.9% assets in poor/very poor condition; 9.71 ridership
- Saskatchewan 0.90% program contribution, 9.21% public transit assets; 11.8% assets in poor/very poor condition; 0.89% ridership.
- Manitoba 2.18% program contribution, 7.94% public transit assets; 5.2% assets in poor/very poor condition; 2.41% ridership.
- Ontario 46.36% program contribution, 26.03% public transit assets; 12.2% assets in poor/very poor condition; 44.64% ridership.
- Quebec 24.06% program contribution, 19.37% public transit assets; 4.5% assets in poor/very poor condition; 27.12% ridership.
- New Brunswick 0.27% program contribution,3.49% public transit assets; 5.6%assets in poor/very poor condition; 0.28% ridership.
- Nova Scotia 0.97% program contribution, 1.59% public transit assets; 15.8% assets in poor/very poor condition; 0.94% ridership.
- Prince Edward Island 0.02% program contribution, 0.63% public transit assets; 12.8% assets in poor/very poor condition; 0.14% ridership.
- Newfoundland 0.10% program contribution, 0.63% public transit assets; assets in poor/very poor condition; ridership.
- Northwest Territories 0.01% program contribution, 0.32% public transit assets; 5.2%assets in poor/very poor condition; 0.04% ridership and
- Yukon 0.03% program contribution, 0.32% public transit assets; 12.9% assets in poor/very poor condition; 0.04% ridership.
Source: INFC Financial Report April 3, 2019, Canadian Core Public Infrastructure Survey 2016 and CUTA ridership data.
It is important to note that the quantity of assets on its own does not determine need or cost, as these vary depending on the type of asset, condition and frequency of use. Also, provinces and territories with a higher proportion of assets in poor or very poor condition generally have a lower proportion of assets overall compared to provinces with large urban centres and higher ridership. Therefore, each measure individually does not provide a complete picture of funding need.
While CCPI data on public transit assets was not available at the time the program was created, in future program development and implementation, it may be worth considering a funding allocation that considers quantity and condition of public transit asset, as well as ridership, for each province and territory.
Finding 3: PTIF led to progress towards the planning and implementation of transit system improvements and expansions
Four provinces reported the completion of projects that included the development and/or implementation of transit system improvement and expansion plans, accounting for 89 completed PTIF projects.
As seen in Table 5, in Ontario, Saskatchewan and Alberta, transit expansion plans funded through PTIF also led to 49,206,988 new passenger-kilometres travelled.Footnote 6
| Province | New Passenger-kilometres travelled as a result of funded systems expansion projects (in millions) |
|---|---|
| Ontario | 13.33 |
| Saskatchewan | 1.83 |
| Alberta | 34.04 |
| Total PTIF | 49.20 |
Source: PTIF Outcome Progress Reports 2019.
Although not specifically attributable to PTIF, CUTA data indicates the creation of 53 new fixed routes between 2016 and 2018, an increase of 1.7%Footnote 7. The total number of fixed routes in 2018 was 3,102, exceeding the PTIF program target of 2,970Footnote 8.
Finding 4: PTIF led to progress towards the rehabilitation, optimization, modernization, efficiency, accessibility and safety of public transit systems
Program data indicates that 210 completed PTIF projects supported the rehabilitation, optimization, modernization, efficiency, accessibility or safety of public transit assets. Eight provinces reported improvements to transit system accessibility, accounting for 162 PTIF projectsFootnote 9. Table 6 shows the number of projects that improved transit system accessibility for each province, as well as the increase in low-floor accessible fleetsFootnote 10, where applicable.
| Province | Number of projects that improve transit system accessibility | Average increase in percentage of transit fleet that is low-floor accessible (%) |
|---|---|---|
| Newfoundland & Labrador | 2 | 11 |
| Prince Edward Island | N/A Table Note A | 100 |
| New Brunswick | N/A Table Note A | 100 |
| Quebec | 33 | N/A Table Note B |
| Ontario | 74 | 39 |
| Manitoba | 37 | N/A Table Note B |
| Saskatchewan | 1 | 24 |
| Alberta | 15 | 82 |
| Total PTIF | 162 | N/A |
Source: PTIF Outcome Reports 2019.
A national value for the average increase in the percentage of transit fleet that is low-floor accessible was not calculated given the available program data. However, the average increase across the six provinces that reported was 61%. At the national level, CUTA data suggests that the percentage of accessible buses increased by 7.5% across all provinces and territoriesFootnote 11, including a 1.5% increase in low-floor accessible busesFootnote 12.
With respect to increased safety, several PTIF projects specifically resulted in added safety features or equipment, as shown in Table 7. Ontario also reported a 23.3% decrease in incidents (collision and non-collision) attributable to PTIF-funded projectsFootnote 13.
| Province | Number of projects that added safety features or equipment |
|---|---|
| Newfoundland & Labrador | 2 |
| Prince Edward Island | 1 |
| Nova Scotia | 8 |
| New Brunswick | 2 |
| Quebec | 14 |
| Ontario | 103 |
| Manitoba | 1 |
| Saskatchewan | <3 |
| Alberta | 16 |
| Total PTIF | 150 |
Source: PTIF Outcome Reports 2019.
As seen in Table 8, funding in capital transit projects contributed to increased operational efficiency through a decrease in average lifecycle costs of applicable transit system assets and led to improvements in the physical condition, useful life remaining, and unplanned service interruptions.
| Province | Percentage of assets with improved physical condition rating (%) | Increase in average number of years of useful life remaining (years) | Decrease in unplanned service interruptions per month (not related to weather) (%) | Decrease in average life cycle costs of applicable transit system assets after completion of funded projects (in $ millions) |
|---|---|---|---|---|
| Prince Edward Island | N/A Table Note A | 5 | N/A Table Note A | $3.6 |
| New Brunswick | unknown Table Note B | unknown Table Note B | unknown Table Note B | N/A Table Note A |
| Ontario | 59.74% | 15.16 | 29.56% | $17.0 |
| Manitoba | 8% | N/A Table Note A | N/A Table Note A | $1.7 |
| Saskatchewan | N/A Table Note A | N/A Table Note A | 2.55% | N/A Table Note A |
| Alberta | unknown Table Note B | unknown Table Note B | unknown Table Note B | unknown Table Note B |
Source: PTIF Outcome Reports 2019
The above improvements to transit systems are expected to contribute to reduced GHG emissions. For instance, Ontario reported an estimated decrease of 5,000 cubic metres of natural gas consumption and an estimated 251,855 kilowatt-hours saved as a result of PTIF funding. CUTA data supports overall reduction trends in kilowatt-hours saved with consumption decreasing from 428.8M in 2016 to 371.9M in 2018. Furthermore, Saskatchewan and Alberta reported a decrease in average litres of fuel per passenger-kilometres. However, only Saskatchewan had aggregated data to quantify that decrease, reporting an improvement of 0.066L/kmFootnote 14.
Finding 5: Public transit ridership increased by the end of 2018.
As seen in Figure 2, CUTA data indicates that public transit ridership showed a decline between 2014 and 2016. By 2018, ridership (regular linked trips) recovered and surpassed the 2014 rates with an overall increase of approximately 5% between 2016 and 2018Footnote 15. This rise was attributed in part to service expansion (higher efficiency, expanded services and hours), as well as population growthFootnote 16. However, it is not possible to attribute these trends specifically to PTIF. When accounting for population growth, trips per capita increased by 0.8% between 2016 and 2018. However, trips per capita in 2018 are still lower than the 2014 rate as ridership has not increased at the same rate as population growth.
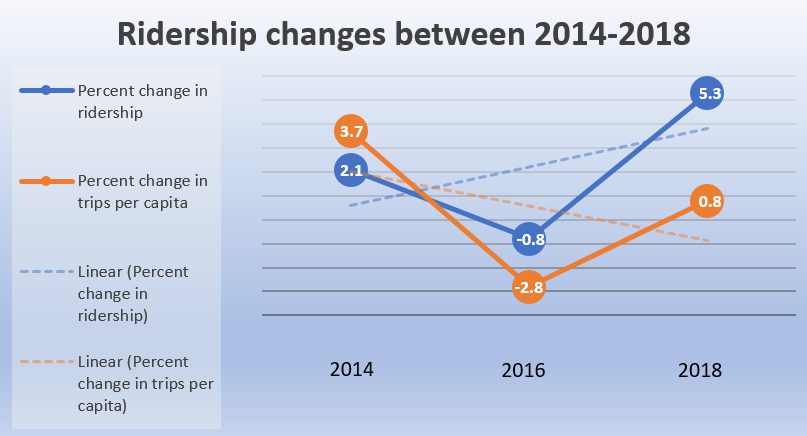
Description of figure 2: Ridership Changes across Canada, 2014-2018
This figure represents the decline in public transit ridership between 2014 and 2018. The distribution is as follows:
- 2014: 2.1% change in ridership, 3.7% change in trips per capita;
- 2016: -0.8% change in ridership, -2.8% change in trips per capita; and
- 2018: 5.3% change in ridership, 0.8% change in trips per capita.
Source: CUTA reports 2014, 2016, 2018.
5.3 Inclusivity
The 2016 Directive on Results requires evaluators to consider government-wide policy commitments, including Gender-based Analysis Plus (GBA+). PTIF met the government’s GBA+ requirementsFootnote 17 in its development and implementation.
The evaluation went beyond assessing the extent to which PTIF met the requirements for gender-based analysis in program development and implementation, to examine program results and external data through an inclusiveness lens more broadly. The intention of this analysis was not to draw conclusions on the relevance or effectiveness of PTIF, but rather to use available data to identify potential areas to consider in the development of future infrastructure programming. The analysis was conducted in keeping with the spirit of GBA+ to “assess how diverse groups of… people may experience government… programs”, Footnote 18 and should be considered supplemental to the evaluation of PTIF itself.
This supplemental GBA+ analysis looked at the proximity of public transit to social housing to determine if populations that would be most reliant on public transit due to economic status had access. The analysis found that program funding was concentrated within provinces to locations where social housing was within 1,000 metres of public transit stations and stops. This indicates that funding supported areas that are well positioned to serve population groups that may rely on public transit, particularly in larger population centres. At the same time, it shows a gap where future programming could be expanded to include areas where proximity to social housing is not within 1,000 metres of public transit stations or stops.
In order to conduct this analysis, data from the CCPI survey and the PTIF project list were used. The CCPI indicator that was used in the analysis provides the percentage of social housing units in a given location that are within 1,000 metres of public transit stops or stations. This analysis looked at whether PTIF funding was distributed within provinces to the locations having social housing and public transit.
Finding 6: For future programming, proximity of social housing and public transit stops and stations could be considered.
Supplemental GBA+ analysis found that PTIF funding was concentrated within provinces to locations where social housing was within 1,000 metres of public transit stations and stops. This indicates that funding may have supported areas that are well positioned to serve population groups that may rely on public transit, particularly in larger population centres. At the same time, it shows a gap where funding could perhaps be used to expand public transit in areas where proximity to social housing is not within 1,000 metres.
It was found that in Alberta, British Columbia, Ontario and Quebec the province-wide data indicated lower proximity than the PTIF data, as seen in Figure 3. This indicates that in these provinces, PTIF funding was directed more to locations that already had high proximity between social housing and public transit than it was to locations with the lowest proximity scores.
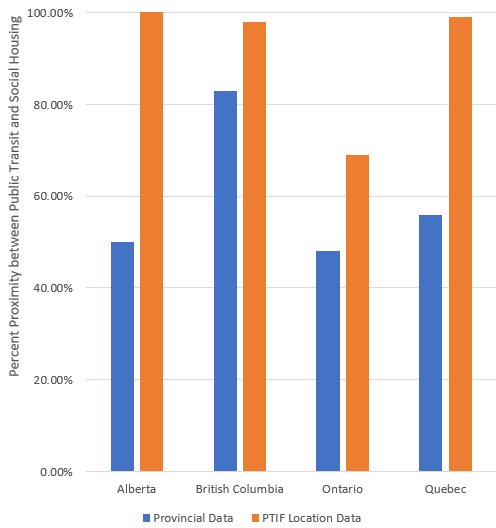
Description of figure 3: Comparison of PTIF Location Data and Provincial Data on distance between Public Transit and Social Housing
This figure represents the percent of how close public transit stations and stops are to social housing based on project location data and provincial data. The distribution is as flows:
- Alberta 50% provincial data and 100% PTIF location data
- British Columbia 83% provincial data and 98% PTIF location data
- Ontario 48% provincial data and 69% PTIF location data
- Quebec 56% provincial data and 99% PTIF location data
Source: PTIF project list and CCPI data 2016.
For a closer look at the locations where PTIF projects are taking place, the 2016 CCPI data was cross-referenced with 36 municipalities that received PTIF project funding, which represents 46% of all PTIF projects. Table 9 outlines the proximity scores of the 36 locations in the evaluation.
| Proximity between Social Housing and Public Transit | No Proximity (0%) |
Low Proximity (1-49%) |
Medium Proximity (50-74%) |
High Proximity (75-99%) |
Full Proximity (100%) |
Total Project Locations |
|---|---|---|---|---|---|---|
| Number of PTIF Project Locations by Proximity Score | 5 | 1 | 4 | 9 | 17 | 36 |
Source: PTIF project list and CCPI data 2016.
As seen in Figure 4, public transit is more accessible to those living within social housing in large and medium population centres compared to small ones. In particular, of the 36 PTIF project locations included in the analysis, 17 were large population centres, 12 were medium, and 7 were small. Moreover, the five large population centres of London, Longueuil, Montreal, Ottawa, and Toronto, accounted for 25% of all PTIF projects and at least 85% of social housing units in these locations were within 1,000 metres of public transit stations and stops. This supports the finding that population centres with already high proximity between social housing and public transit are receiving PTIF funding, and that they tended to be large population centres. A consideration for future programming could look at the gap found in this analysis that smaller municipalities aren’t always near social housing and public transit.
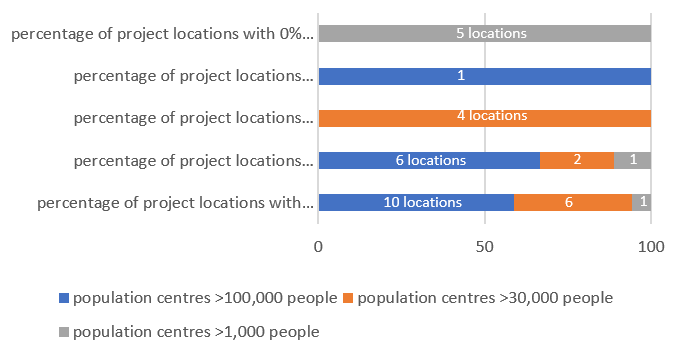
Description of figure 4 : Proximity of Public Transit Stops or Stations to Social Housing, by Population Size
This figure represents the proximity between social housing and public transit stops or stations by population size. The distribution is as follows:
Population centres greater than 100,000 people:
- 10 project locations with 100% proximity.
- 6 project locations between 75% and 99% proximity.
- 0 project locations between 50% and 74% proximity.
- 1 of project locations between 1% and 49% proximity.
- 0 of project locations with 0% proximity.
Population centres greater than 30,000 people
- 6of project locations with 100% proximity.
- 2 of project locations between 75% and 99% proximity.
- 4 of project locations between 50% and 74% proximity.
- 0 of project locations between 1% and 49% proximity.
- 0 of project locations with 0% proximity.
Population centres less than 1, 000 people
- 1 of project locations with 100% proximity.
- 1 of project locations between 75% and 99% proximity.
- 0 of project locations between 50% and 74% proximity.
- 0 of project locations between 1% and 49% proximity.
- 5 of project locations with 0% proximity.
Source: PTIF project list and CCPI data 2016.
Figure 4 illustrates that larger population centres reported high proximity between social housing and public transit more than smaller population centres. Five of seven population centres with populations between 1,000 and 30,000 people reported 0% of social housing units within 1,000 metres of public transit stops.
The PTIF project location data suggests that smaller population centres with low proximity between social housing and public transit could benefit from public transit infrastructure that targets accessibility for people with lower socioeconomic status. Although this analysis is not part of the evaluation of the program’s effectiveness, it does provide considerations for future public transit programming.
6.0 Conclusions
The evaluation found that PTIF met the overall needs of Canadians for public transit. Future programming could consider allocation formulas that also take asset quantity and condition into account now that this information is available.
Overall, program funding resulted in progress towards expected outcomes. The extent to which progress has been made is not possible to assess due to a lack of targets and missing provincial and territorial annual progress outcome reports.
Based on the analysis of funding allocation and GBA+, the evaluation identified that future public transit programs could consider the proximity of social housing to public transit stops and stations in communities of varying sizes.
The evaluation has no recommendations, as issues identified with the program’s performance measurement are being addressed through the Investing in Canada Infrastructure Program’s performance measurement strategy.
Annex A: PTIF Outcomes and Indicators Mapped with Evaluation FindingsFootnote 19
| Outcome | Indicator | Theme |
|---|---|---|
|
Cost-shared transit system projects to support the rehabilitation, optimization, modernization, efficiency, accessibility or safety are completed.Table note * |
# of cost-shared transit system projects that are completed by sub-categoryTable note * |
Finding 1: PTIF is aligned with identified public transit needs. |
|
Number of funded transit system projects that have incorporated modern, innovative technology.Table note * |
Finding 4: PTIF led to progress towards the rehabilitation, optimization, modernization, efficiency, accessibility and safety of public transit systems. |
|
|
Cost-shared transit system projects to design, and plan for future improvements and expansion are completed.Table note * |
# of cost-shared transit system designs or plans that are completedTable note * |
Finding 3: PTIF led to progress towards the planning and implementation of transit system improvements and expansions. |
|
Communities benefit from incremental fundingTable note * |
Increase in total actual spending relative to baseline of originally planned capital expenditures, as a result of federal fundingTable note * |
Finding 2: Communities benefited from incremental PTIF funding
|
|
% of attestations to incrementality received from recipientsTable note *. |
||
|
Funded plans for future transit system expansion and improvements are being implemented.Table note ** |
Number of funded plans and studies that have resulted in identified capital projects that are either included in capital planning documents with associated funding or that are in the process of being implemented.Table note ** |
Finding 3: PTIF led to progress towards the planning and implementation of transit system improvements and expansions. |
|
Funding has contributed to the rehabilitation of transit systems.Table note ** |
Average % decrease in unplanned service interruptions per month (not related to weather) that can be attributed to funded projects.Table note ** |
Finding 4: PTIF led to progress towards the rehabilitation, optimization, modernization, efficiency, accessibility and safety of public transit systems.
|
|
Average number of years of useful life remaining on transit assets, extended as a result of funded projects.Table note ** |
||
|
Percentage of assets that have improved their physical condition rating (as per reporting guideline) as a result of funding.Table note ** |
||
|
Funding for transit projects has contributed to increasing the safety of public transit systems.Table note ** |
Estimated % decrease in incidents (collision and non-collision) that can be attributed to funding.Table note ** |
|
|
Number of funded transit system projects that have added safety features or equipment.Table note ** |
||
|
Funding for transit projects has contributed to increasing the accessibility of public transit systems.Table note ** |
Average increase in % of transit fleet that is low-floor accessible as a result of funding.Table note ** |
|
|
Funding for capital transit projects has contributed to increased operational efficiencyTable note ** |
Average Life Cycle Costs of applicable transit system assets after completion of funded projectsTable note ** |
|
|
Funding for transit systems has contributed to increasing transit ridership and modal share, which will help reduce congestion in the future.Table note *** |
% increase in transit ridershipTable note *** |
Finding 5: Public transit ridership improving by the end of 2018, after showing a decline |
|
% change in public transport modal share (Stats Can)Table note *** |
||
|
Improvements to transit systems have contributed to reducing GHG emissions.Table note *** |
Average litres of fuel per passenger-kilometres after completion of funded projectsTable note *** |
Finding 4: PTIF made progress towards the rehabilitation, optimization, modernization, efficiency, accessibility and safety of public transit systems |
|
Total estimated cubic-metres of natural gas saved as a result of funding.Table note *** |
||
|
Total estimated kilowatt-hours saved as a result of funding.Table note *** |
||
|
The full implementation of funded transit improvement plans has contributed to the expansion of transit systemsTable note *** |
Total of new passenger –kilometres travelled as a result of funded systems expansion projects.Table note *** |
Finding 3: PTIF made progress towards the planning and implementation of transit system improvements and expansions |
|
% increase in number of fixed routesTable note *** |
Annex B: PTIF Results Matrix
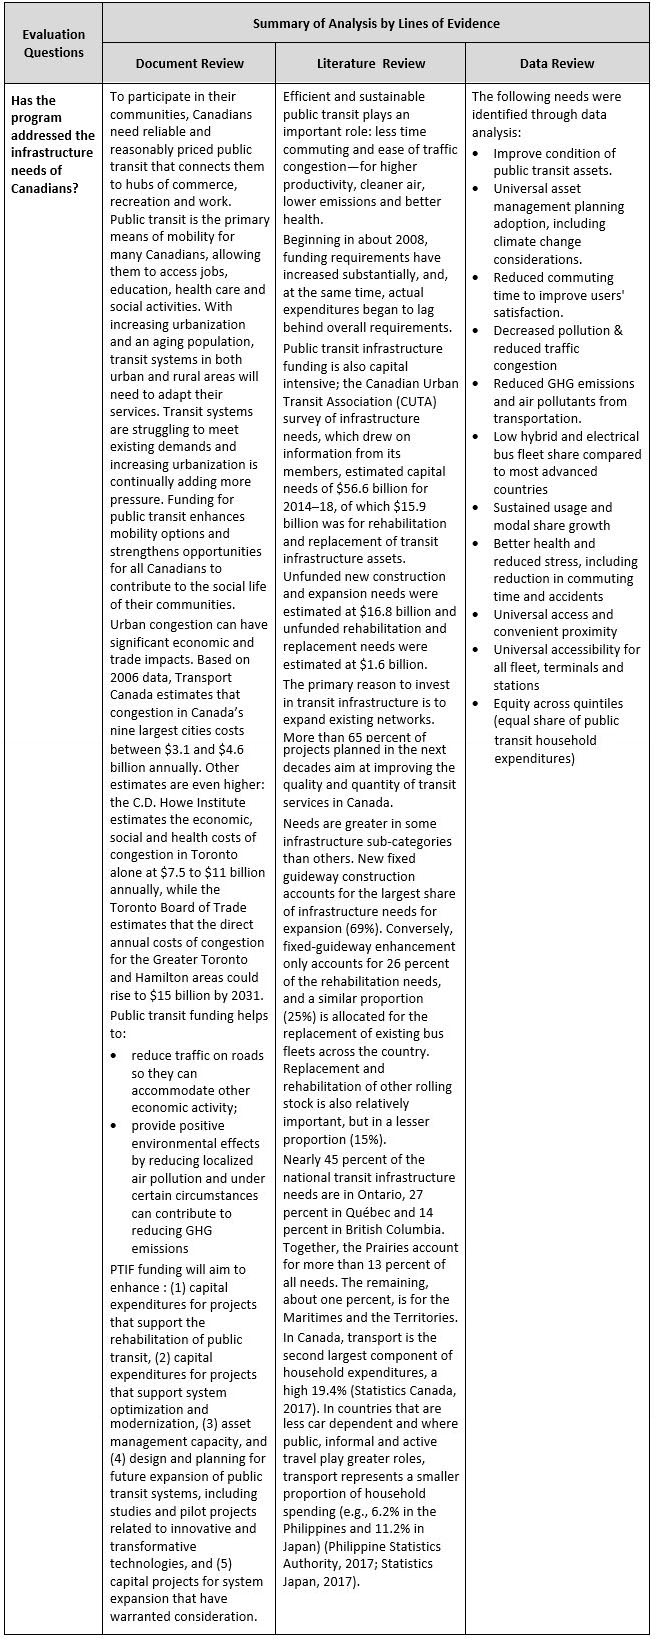
Description of figure 5: Evaluation Question - Has the program addressed the infrastructure needs of Canadians?
Summary of Analysis by Lines of Evidence
Document Review
To participate in their communities, Canadians need reliable and reasonably priced public transit that connects them to hubs of commerce, recreation and work. Public transit is the primary means of mobility for many Canadians, allowing them to access jobs, education, health care and social activities. With increasing urbanization and an aging population, transit systems in both urban and rural areas will need to adapt their services. Transit systems are struggling to meet existing demands and increasing urbanization is continually adding more pressure. Funding for public transit enhances mobility options and strengthens opportunities for all Canadians to contribute to the social life of their communities.
Urban congestion can have significant economic and trade impacts. Based on 2006 data, Transport Canada estimates that congestion in Canada’s nine largest cities costs between $3.1 and $4.6 billion annually. Other estimates are even higher: the C.D. Howe Institute estimates the economic, social and health costs of congestion in Toronto alone at $7.5 to $11 billion annually, while the Toronto Board of Trade estimates that the direct annual costs of congestion for the Greater Toronto and Hamilton areas could rise to $15 billion by 2031.
Public transit funding helps to:
- reduce traffic on roads so they can accommodate other economic activity;
- provide positive environmental effects by reducing localized air pollution and under certain circumstances can contribute to reducing GHG emissions
PTIF funding will aim to enhance : (1) capital expenditures for projects that support the rehabilitation of public transit, (2) capital expenditures for projects that support system optimization and modernization, (3) asset management capacity, and (4) design and planning for future expansion of public transit systems, including studies and pilot projects related to innovative and transformative technologies, and (5) capital projects for system expansion that have warranted consideration.
Literature Review
Efficient and sustainable public transit plays an important role: less time commuting and ease of traffic congestion—for higher productivity, cleaner air, lower emissions and better health.
Beginning in about 2008, funding requirements have increased substantially, and, at the same time, actual expenditures began to lag behind overall requirements.
Public transit infrastructure funding is also capital intensive; the Canadian Urban Transit Association (CUTA) survey of infrastructure needs, which drew on information from its members, estimated capital needs of $56.6 billion for 2014–18, of which $15.9 billion was for rehabilitation and replacement of transit infrastructure assets. Unfunded new construction and expansion needs were estimated at $16.8 billion and unfunded rehabilitation and replacement needs were estimated at $1.6 billion.
The primary reason to invest in transit infrastructure is to expand existing networks. More than 65 percent of projects planned in the next decades aim at improving the quality and quantity of transit services in Canada.
Needs are greater in some infrastructure sub-categories than others. New fixed guideway construction accounts for the largest share of infrastructure needs for expansion (69%). Conversely, fixed-guideway enhancement only accounts for 26 percent of the rehabilitation needs, and a similar proportion (25%) is allocated for the replacement of existing bus fleets across the country. Replacement and rehabilitation of other rolling stock is also relatively important, but in a lesser proportion (15%).
Nearly 45 percent of the national transit infrastructure needs are in Ontario, 27 percent in Québec and 14 percent in British Columbia. Together, the Prairies account for more than 13 percent of all needs. The remaining, about one percent, is for the Maritimes and the Territories.
In Canada, transport is the second largest component of household expenditures, a high 19.4% (Statistics Canada, 2017). In countries that are less car dependent and where public, informal and active travel play greater roles, transport represents a smaller proportion of household spending (e.g., 6.2% in the Philippines and 11.2% in Japan) (Philippine Statistics Authority, 2017; Statistics Japan, 2017).
Data Review
The following needs were identified through data analysis:
- Improve condition of public transit assets.
- Universal asset management planning adoption, including climate change considerations.
- Reduced commuting time to improve users' satisfaction.
- Decreased pollution & reduced traffic congestion
- Reduced GHG emissions and air pollutants from transportation.
- Low hybrid and electrical bus fleet share compared to most advanced countries
- Sustained usage and modal share growth
- Better health and reduced stress, including reduction in commuting time and accidents
- Universal access and convenient proximity
- Universal accessibility for all fleet, terminals and stations
- Equity across quintiles (equal share of public transit household expenditures)
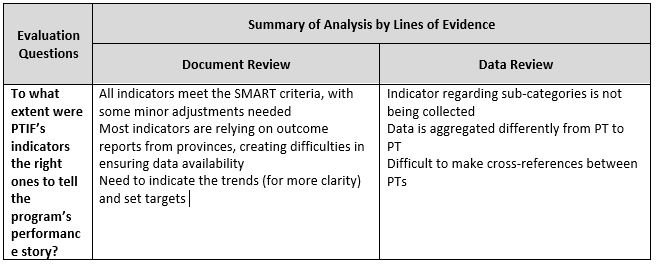
Description of figure 6: Evaluation Question - To what extent were PTIF’s indicators the right ones to tell the program’s performance story?
Summary of Analysis by Lines of Evidence
Document Review
- All indicators meet the SMART criteria, with some minor adjustments needed.
- Most indicators are relying on outcome reports from provinces, creating difficulties in ensuring data availability
- Need to indicate the trends (for more clarity) and set targets
Data Review
- Indicator regarding sub-categories is not being collected
- Data is aggregated differently from PT to PT
- Difficult to make cross-references between PTs
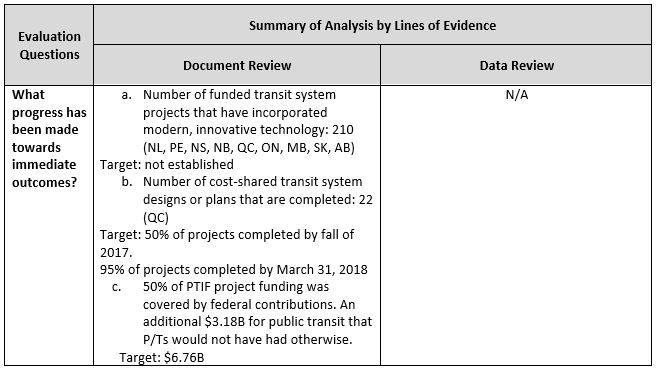
Description of figure 7: Evaluation Question - What progress has been made towards immediate outcomes?
Summary of Analysis by Lines of Evidence
Document Review
- a. Number of funded transit system projects that have incorporated modern, innovative technology: 210 (NL, PE, NS, NB, QC, ON, MB, SK, AB)
- Target: not established
- b. Number of cost-shared transit system designs or plans that are completed: 22 (QC)
- Target: 50% of projects completed by fall of 2017.
- 95% of projects completed by March 31, 2018
- c. 50% of PTIF project funding was covered by federal contributions. An additional $3.18B for public transit that P/Ts would not have had otherwise.
- Target: $6.76B
Data Review
N/A
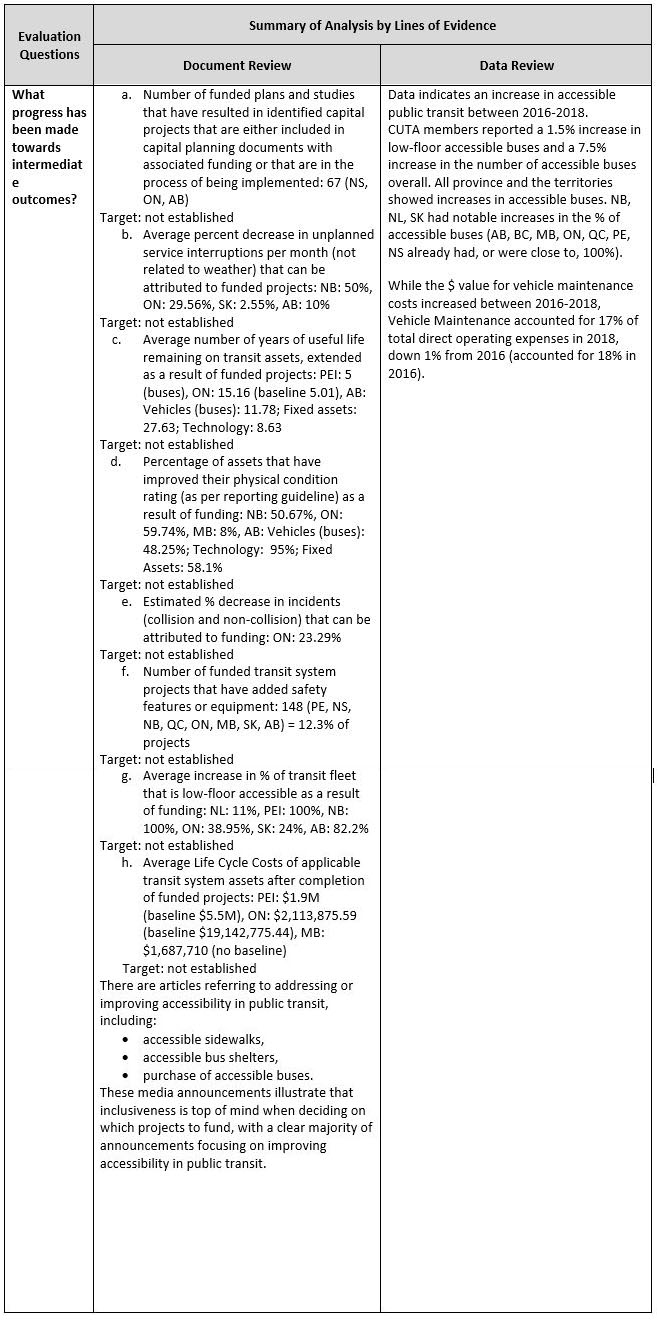
Description of figure 8: Evaluation Question - What progress has been made towards intermediate outcomes?
Summary of Analysis by Lines of Evidence
Document Review
- a. Number of funded plans and studies that have resulted in identified capital projects that are either included in capital planning documents with associated funding or that are in the process of being implemented: 67 (NS, ON, AB)
- Target: not established
- b. Average percent decrease in unplanned service interruptions per month (not related to weather) that can be attributed to funded projects: NB: 50%, ON: 29.56%, SK: 2.55%, AB: 10%
- Target: not established
- c. Average number of years of useful life remaining on transit assets, extended as a result of funded projects: PEI: 5 (buses), ON: 15.16 (baseline 5.01), AB: Vehicles (buses): 11.78; Fixed assets: 27.63; Technology: 8.63
- Target: not established
- d.Percentage of assets that have improved their physical condition rating (as per reporting guideline) as a result of funding: NB: 50.67%, ON: 59.74%, MB: 8%, AB: Vehicles (buses): 48.25%; Technology: 95%; Fixed Assets: 58.1%
- Target: not established
- e. Estimated % decrease in incidents (collision and non-collision) that can be attributed to funding: ON: 23.29%
- Target: not established
- f. Number of funded transit system projects that have added safety features or equipment: 148 (PE, NS, NB, QC, ON, MB, SK, AB) = 12.3% of projects
- Target: not established
- g. Average increase in % of transit fleet that is low-floor accessible as a result of funding: NL: 11%, PEI: 100%, NB: 100%, ON: 38.95%, SK: 24%, AB: 82.2%
- Target: not established
- h. Average Life Cycle Costs of applicable transit system assets after completion of funded projects: PEI: $1.9M (baseline $5.5M), ON: $2,113,875.59 (baseline $19,142,775.44), MB: $1,687,710 (no baseline)
- Target: not established
- There are articles referring to addressing or improving accessibility in public transit, including:
- accessible sidewalks,
- accessible bus shelters,
- purchase of accessible buses.
- These media announcements illustrate that inclusiveness is top of mind when deciding on which projects to fund, with a clear majority of announcements focusing on improving accessibility in public transit.
Data Review
Data indicates an increase in accessible public transit between 2016-2018.
CUTA members reported a 1.5% increase in low-floor accessible buses and a 7.5% increase in the number of accessible buses overall. All province and the territories showed increases in accessible buses. NB, NL, SK had notable increases in the % of accessible buses (AB, BC, MB, ON, QC, PE, NS already had, or were close to, 100%).
While the $ value for vehicle maintenance costs increased between 2016-2018, Vehicle Maintenance accounted for 17% of total direct operating expenses in 2018, down 1% from 2016 (accounted for 18% in 2016).
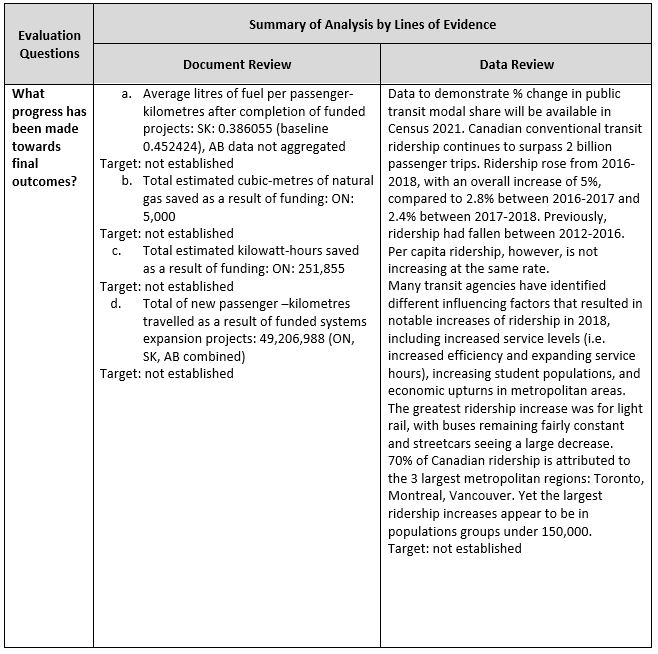
Description of figure 9: Evaluation Question - What progress has been made towards final outcomes?
Summary of Analysis by Lines of Evidence
Document Review
- a. Average litres of fuel per passenger-kilometres after completion of funded projects: SK: 0.386055 (baseline 0.452424), AB data not aggregated
- Target: not established
- b. Total estimated cubic-metres of natural gas saved as a result of funding: ON: 5,000
- Target: not established
- c. Total estimated kilowatt-hours saved as a result of funding: ON: 251,855
- Target: not established
- d. Total of new passenger –kilometres travelled as a result of funded systems expansion projects: 49,206,988 (ON, SK, AB combined)
- Target: not established
Data Review
Data to demonstrate % change in public transit modal share will be available in Census 2021. Canadian conventional transit ridership continues to surpass 2 billion passenger trips. Ridership rose from 2016-2018, with an overall increase of 5%, compared to 2.8% between 2016-2017 and 2.4% between 2017-2018. Previously, ridership had fallen between 2012-2016. Per capita ridership, however, is not increasing at the same rate.
Many transit agencies have identified different influencing factors that resulted in notable increases of ridership in 2018, including increased service levels (i.e. increased efficiency and expanding service hours), increasing student populations, and economic upturns in metropolitan areas. The greatest ridership increase was for light rail, with buses remaining fairly constant and streetcars seeing a large decrease.
70% of Canadian ridership is attributed to the 3 largest metropolitan regions: Toronto, Montreal, Vancouver. Yet the largest ridership increases appear to be in populations groups under 150,000.
Target: not established
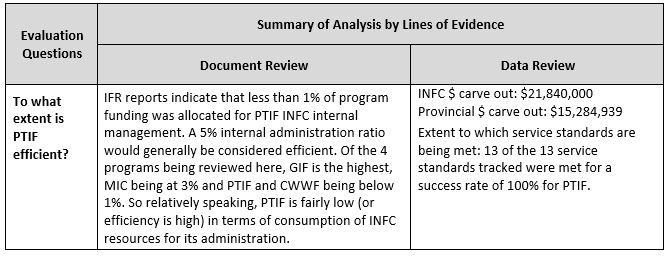
Description of figure 10: Evaluation Question - To what extent is PTIF efficient?
Summary of Analysis by Lines of Evidence
Document Review
IFR reports indicate that less than 1% of program funding was allocated for PTIF INFC internal management. A 5% internal administration ratio would generally be considered efficient. Of the 4 programs being reviewed here, GIF is the highest, MIC being at 3% and PTIF and CWWF being below 1%. So relatively speaking, PTIF is fairly low (or efficiency is high) in terms of consumption of INFC resources for its administration.
Data Review
- INFC $ carve out: $21,840,000
- Provincial $ carve out: $15,284,939
- Extent to which service standards are being met: 13 of the 13 service standards tracked were met for a success rate of 100% for PTIF.
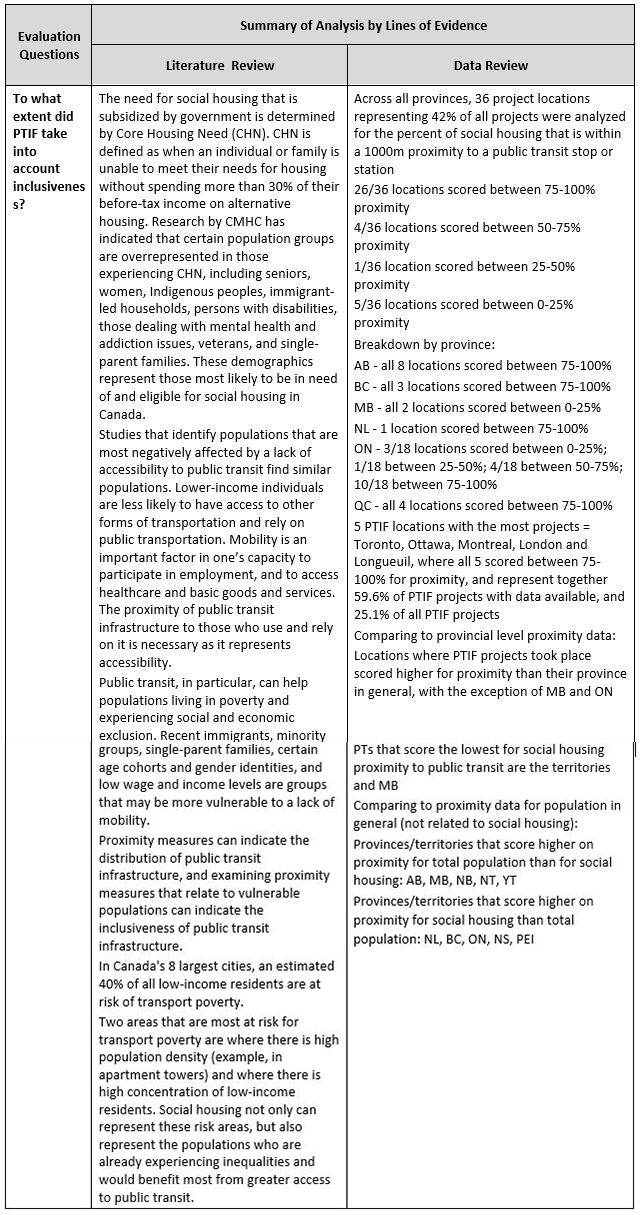
Description of figure 11: Evaluation Question - To what extent did PTIF take into account inclusiveness?
Summary of Analysis by Lines of Evidence
Literature Review
The need for social housing that is subsidized by government is determined by Core Housing Need (CHN). CHN is defined as when an individual or family is unable to meet their needs for housing without spending more than 30% of their before-tax income on alternative housing. Research by CMHC has indicated that certain population groups are overrepresented in those experiencing CHN, including seniors, women, Indigenous peoples, immigrant-led households, persons with disabilities, those dealing with mental health and addiction issues, veterans, and single-parent families. These demographics represent those most likely to be in need of and eligible for social housing in Canada.
Studies that identify populations that are most negatively affected by a lack of accessibility to public transit find similar populations. Lower-income individuals are less likely to have access to other forms of transportation and rely on public transportation. Mobility is an important factor in one’s capacity to participate in employment, and to access healthcare and basic goods and services. The proximity of public transit infrastructure to those who use and rely on it is necessary as it represents accessibility.
Public transit, in particular, can help populations living in poverty and experiencing social and economic exclusion. Recent immigrants, minority groups, single-parent families, certain age cohorts and gender identities, and low wage and income levels are groups that may be more vulnerable to a lack of mobility.
Proximity measures can indicate the distribution of public transit infrastructure, and examining proximity measures that relate to vulnerable populations can indicate the inclusiveness of public transit infrastructure.
In Canada's 8 largest cities, an estimated 40% of all low-income residents are at risk of transport poverty.
Two areas that are most at risk for transport poverty are where there is high population density (example, in apartment towers) and where there is high concentration of low-income residents. Social housing not only can represent these risk areas, but also represent the populations who are already experiencing inequalities and would benefit most from greater access to public transit.
Data Review
- Across all provinces, 36 project locations representing 42% of all projects were analyzed for the percent of social housing that is within a 1000m proximity to a public transit stop or station
- 26/36 locations scored between 75-100% proximity
- 4/36 locations scored between 50-75% proximity
- 1/36 location scored between 25-50% proximity
- 5/36 locations scored between 0-25% proximity
Breakdown by province:
- AB - all 8 locations scored between 75-100%
- BC - all 3 locations scored between 75-100%
- MB - all 2 locations scored between 0-25%
- NL - 1 location scored between 75-100%
- ON - 3/18 locations scored between 0-25%; 1/18 between 25-50%; 4/18 between 50-75%; 10/18 between 75-100%
- QC - all 4 locations scored between 75-100%
- 5 PTIF locations with the most projects = Toronto, Ottawa, Montreal, London and Longueuil, where all 5 scored between 75-100% for proximity, and represent together 59.6% of PTIF projects with data available, and 25.1% of all PTIF projects
Comparing to provincial level proximity data:
- Locations where PTIF projects took place scored higher for proximity than their province in general, with the exception of MB and ON
- PTs that score the lowest for social housing proximity to public transit are the territories and MB
- Comparing to proximity data for population in general (not related to social housing):
- Provinces/territories that score higher on proximity for total population than for social housing: AB, MB, NB, NT, YT
- Provinces/territories that score higher on proximity for social housing than total population: NL, BC, ON, NS, PEI
Report a problem on this page
- Date modified: