
Evaluation of the Green Infrastructure Fund
Evaluation of the Green Infrastructure Fund — April 2021

Evaluation of the Green Infrastructure
Fund
April
2021
(PDF Version)
Table of Contents
- List of Acronyms
- 1.0 Executive Summary
- 2.0 Program Overview
- 3.0 Evaluation Objectives, Scope and Questions
- 4.0 Methodology, Limitations and Mitigation Strategies
- 5.0 Findings
- 6.0 Conclusions
- Annex A: Mapping of GIF outcomes, indicators and theme
- Annex B: GIF Results Matrix
List of Acronyms
- ECCC
- Environment and Climate Change Canada
- FAA
- Financial Administration Act
- GBA+
- Gender-based Analysis Plus
- GIF
- Green Infrastructure Fund
- GHG
- Greenhouse Gas
- IFR
- Infrastructure Financial Report
- INFC
- Infrastructure Canada
- MLD
- Million Litres per day
- NTL
- Northwest Transmission Line
1.0 Executive Summary
Program Overview
The Green Infrastructure Fund (GIF) was a $735 million contribution program that funded large-scale green infrastructure projects of national or regional significance. Under the program, there were four categories that were eligible for funding: wastewater; green energy generation and transmission; carbon transmission and storage; and solid waste management. The program started in 2009-10 and is scheduled to end in March 2022.
Evaluation Objective and Scope
The objective of this evaluation was to meet the requirements of section 42.1 of the Financial Administration Act (FAA) and to consider Gender-based Analysis Plus (GBA+) as expressed in the Treasury Board Directive on Results.
The evaluation looked at all approved and announced projects for GIF from April 1, 2009 to March 31, 2019. Claims for GIF projects continued to be paid and outcome reports received after this period, though these were outside of the scope of this evaluation.
Key Findings and Conclusions
Relevance
GIF addressed needs for green infrastructure.
Progress towards achievement of outcomes
It is not possible to fully assess the extent of the progress made with available performance data and in the absence of established targets. However, progress has been made towards GIF’s outcomes:
- GIF has leveraged more funding from partners than other INFC green programs, particularly for projects in the green energy and solid waste asset categories.
- GIF has made progress in helping to improve environmental quality. From April 2009 to March 2019, INFC spent over $441 million for 21 green energy, solid waste and wastewater projects in five provinces and one territory, of which 12 were completed as of March 31 2019.
Inclusivity
The 2016 Directive on Results requires evaluators to consider government-wide policy commitments, including Gender-based Analysis Plus (GBA+). GIF met the government’s gender-based analysis requirementsFootnote 1 in its development and implementation.
The evaluation went beyond assessing the extent to which GIF met the requirements for gender-based analysis in program development and implementation, to examine program results and external data through an inclusiveness lens more broadly. The intention of this analysis was not to draw conclusions on the relevance or effectiveness of GIF, but rather to use available data to identify potential areas to consider in the development of future infrastructure programming. The analysis was conducted in line with the spirit of GBA+ to “assess how diverse groups of… people may experience government… programs”, Footnote 2 and should be considered supplemental to the evaluation of GIF itself.
This supplemental GBA+ analysis looked at locations where projects took place to determine the distribution across different population center sizes and across provinces and territories. The evaluation found that the need for green infrastructure was relevant to communities of diverse sizes across Canada and that these needs were addressed by wastewater, solid waste and green infrastructure projects funded under GIF.
Recommendations
The evaluation has no recommendations as GIF is sunsetting and all funds are committed.
2.0 Program Overview
GIF was a $735 millionFootnote 3 contribution program that funded large-scale green infrastructure projects of national or regional significance. The program started in 2009-10 and is scheduled to end in March 2022. At the time of the evaluation, the program funding was fully allocated.
Under the program, there were four eligible funding categories: wastewater; green energy generation and transmission; carbon transmission and storage; and solid waste management. Program recipients included provinces and territories, local and regional governments, public sector bodies, non-profit organizations, and/or private sector companies. Table 1 illustrates GIF’s number of approved projects as well as INFC’s contribution and claims paid as of March 31, 2019.
| Number of Approved Projects | Number of Completed Projects | Program Contribution | Claims Paid |
|---|---|---|---|
| 21 | 12 | $735,257,942 | $441,282,340 |
Source: Infrastructure Financial Report, April 3, 2019.
3.0 Evaluation Objectives, Scope and Questions
The objective of this evaluation was to meet the requirements of section 42.1 of the Financial Administration Act (FAA) that requires, for programs with average spending greater than $5 million per year, an assessment every five years of relevance and effectiveness as defined by the Treasury Board:
- Relevance: the extent to which a program, policy or other entity addresses and is responsive to a demonstrable need. Relevance may also consider if a program, policy or other entity is a government priority or a federal responsibility.
- Effectiveness: the impacts of a program, policy or other entity, or the extent to which it is achieving its expected outcomes.Footnote 4
This evaluation also considered a government-wide commitment to include GBA+ in evaluations as outlined in the Treasury Board Directive on Results.
The evaluation looked at all approved and announced projects for GIF from April 1, 2009 to March 31, 2019. Claims for GIF projects continued to be paid and outcome reports received after this period, though these were outside of the scope of this evaluation.
Based on the evaluation objectives, the evaluation examined the following questions:
- Q1. Has the program addressed the infrastructure needs of Canadians?
- Q2. What progress has been made towards expected outcomes?
- Q3. To what extent is the program efficient?
- Q4. To what extent did the program take into account inclusiveness?
4.0 Methodology, Limitations and Mitigation Strategies
In view of the Department shifting its capacity to focus on responding to the COVID-19 pandemic, the project was scoped in a way to make use of data the Evaluation Directorate already had access to, eliminating the need for additional data requests. Data collected as part of previous thematic evaluations, including the Combined Audit and Evaluation of the Impacts of INFC Programs in the Territories and the Evaluation of the Impact of INFC Programs in the Vancouver Area, was also leveraged as applicable. Due to the shift in priorities, it was decided to not conduct interviews as part of this evaluation.
The lines of evidence for this evaluation included the following:
4.1 Document Review
The document review was used to assess program relevance and effectiveness. Progress implementation reports were used where available to gather information on progress towards program outcomes. News releases related to GIF were also reviewed, to provide information on communications made to the public. To mitigate this limitation, program data was also reviewed.
4.2 Data Review
Program data available through the Infrastructure Financial Report (IFR) that provides an overview of all funded projects (including data such as number of projects by funding category, status of projects, funds allocated and claims paid) was used to assess program relevance.
A limitation to the data review was that program performance data related to immediate outcomes was not included as part of the IFR. A document review was conducted to gather information on progress towards outcomes to mitigate this limitation.
4.3 Literature Review
The literature review examined academic and non-academic literature to identify infrastructure needs. The main source for the literature review was EBSCO, an academic library that provides a research database of e-journals, magazines, and e-books. The literature review was included in the evaluation to supplement existing data in support of the evaluation question of relevance and mitigate existing limitations to the methodology.
5.0 Findings
5.1 Relevance
The evaluation examined Canadians’ needs for green energy, wastewater and solid waste infrastructure and the extent to which GIF has been able to address them.
Finding 1: GIF addressed the need for green infrastructure funding.
The literature review, document review and infrastructure data gapsFootnote 5 indicated that there is a continued need to support wastewater, solid waste and green energy infrastructure. It also identified a particularly pressing need in Northern Communities for green energy. The existing assets in these communities emit GHG and black carbon and are aging and must be replaced.
As shown in Table 2, GIF has addressed green infrastructure needs by funding projects in the areas of green energy, solid waste management and wastewater. These priority areas align with the needs identified through the document and literature review.
| Priorities/Needs identified from lines of evidence | Number of Approved projects by Funded CategoriesFootnote 6 | Number of Applications submitted | GIF Funding Allocation Approved ($ million) |
|---|---|---|---|
| Green Energy | 4 | 83 | 265.7 |
| Wastewater | 10 | 34 | 290.7 |
| Solid Waste Management | 7 | 36 | 178.5 |
| Total | 21 | 153 | 735 |
Source: Infrastructure Financial Report, April 3, 2019.
5.2 Progress Towards Expected Outcomes
The findings in this section are based on the program outcomes and indicators identified in the GIF performance measurement strategy. The data sources are the Infrastructure Financial Report and annual project progress reports. A mapping of the findings related to progress towards outcomes and the program performance measurement strategy can be found in Annex A.
Finding 2: GIF has leveraged more funding from external sources than any other INFC green program. In the absence of targets, the evaluation cannot confirm the extent of the success against program objectives.
GIF funding was cost-shared between the federal government, provinces/territories and municipalities. GIF has leveraged $3.2 billion for green infrastructure initiatives for 21 green infrastructure projects. Provincial/territorial and municipal levels of government funded $2.5 billion. INFC’s $735 million funding represented 22% of the total funding as seen in Table 3.
| Category and Location of GIF Funded Projects | Number of Projects | INFC Project Funding ($ million) |
Total Partners Project Funding ($ million) |
Total Project Funding ($ million) |
Proportion of INFC Funding (% of Total Project Funding) |
|---|---|---|---|---|---|
| Green Energy | 4 | 265 | 1,238 | 1,503 | 18% |
| British Columbia | 1 | 130 | 1,082 | 1,212 | 11% |
| Prince Edward Island | 2 | 65 | 65 | 130 | 50% |
| Yukon | 1 | 71 | 91 | 162 | 44% |
| Solid Waste Management | 7 | 179 | 741 | 920 | 19% |
| Quebec | 7 | 179 | 741 | 920 | 19% |
| Wastewater | 10 | 291 | 579 | 870 | 33% |
| British Columbia | 1 | 50 | 173 | 223 | 22% |
| Manitoba | 1 | 11 | 58 | 69 | 16% |
| Ontario | 8 | 230 | 347 | 577 | 40% |
| Grand Total | 21 | 735 | 2,558 | 3,293 | 22% |
Source: Infrastructure Financial Report, April 3, 2019.
GIF funding of green infrastructure projects has leveraged more funding from provincial, territorial, and municipal partners than any other INFC program for similar categories of assets eligible under GIF (green energy, solid waste and wastewater). As seen in Figure 1, GIF has the highest percentage of funds leveraged from INFC partners (78%) compared with other INFC green programs, such as the Canada Strategic Infrastructure Fund (51%) and National and Regional Projects (70%).
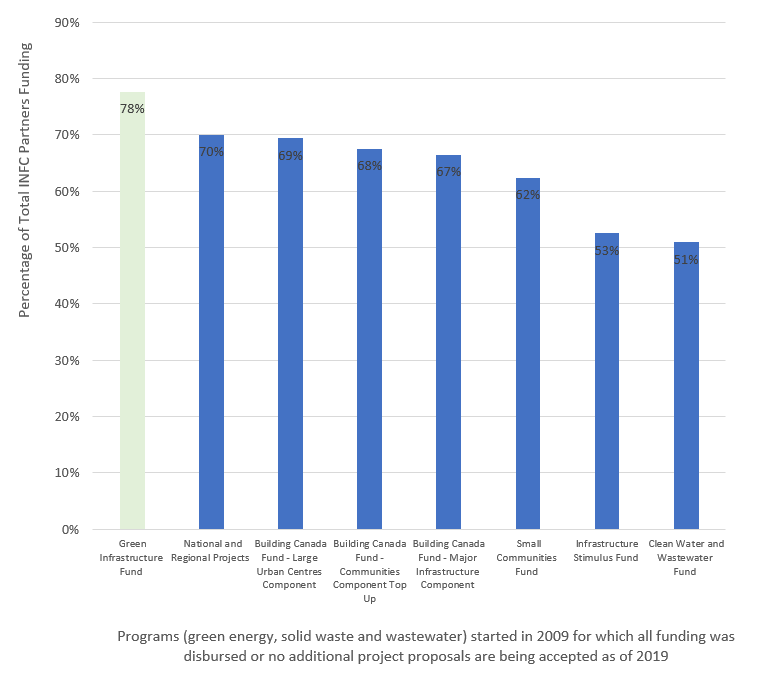
Description of figure 1: Leveraging Funding from Partners for GIF and other INFC programs
This figure presents the percent of funding GIF has leveraged from INFC partners for the funding categories of green energy, solid waste and wastewater. The distribution is as follows:
- Green Infrastructure Fund 78% of total INFC partners funding.
- National and Regional Projects 70% of total INFC partners funding.
- Building Canada Fund - Large Urban Centres Component 69% of total INFC partners funding.
- Building Canada Fund – Communities Component Top Up 68% of total INFC partners funding.
- Building Canada Fund – Major Infrastructure Component 67% of total INFC partners funding.
- Small Communities Fund 62% of total INFC partners funding.
- Infrastructure Stimulus Fund 53% of total INFC partners funding.
- Clean Water and Wastewater Fund 51% of total INFC partners funding.
Source: Infrastructure Financial Report, April 3, 2019.
With respect to funded asset categories and compared to other INFC green programs, GIF remains the program that had the most funding allocated to green energy (93% of INFC’s funding in this category) and solid waste management (76% of INFC’s funding in this category) from April 2009 to March 2019 as shown in Figure 2.
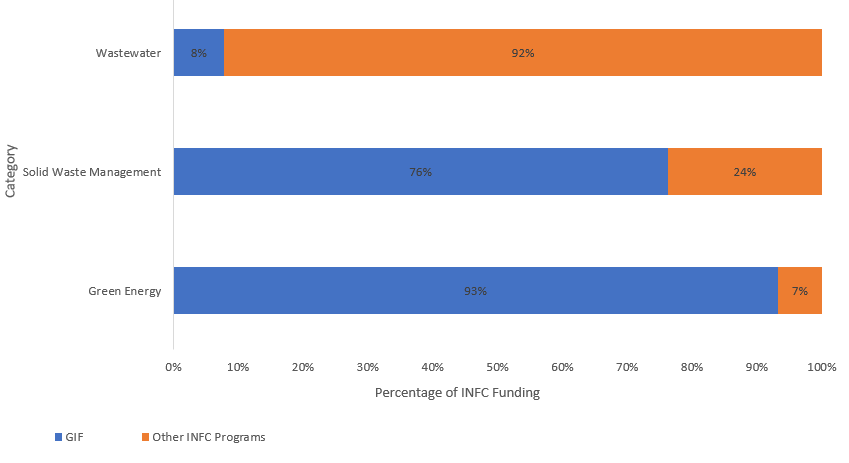
Description of figure 2:Percentage of Funding by Category, GIF and other INFC Programs, 2009-2019
This figure represents the percentage of funding by category for GIF and other INFC programs from 2009 to 2019. The distribution is as follows:
- Wastewater: 8% GIF and 92% other INFC programs.
- Solid Waste Management:76% GIF and 24% other INFC programs.
- Green Energy: 93% GIF and 7% other programs.
Source: Infrastructure Financial Report, April 3, 2019 and INFC Funding Programs Overview.
While GIF was the first Government of Canada program fully committed to green infrastructureFootnote 8, when GIF was launched there was some overlap between its eligible categories and those of other INFC programs.
Finding 3: Although progress has been made towards GIF’s final outcome of improving environmental quality, it is not possible to assess the extent of progress made without targets, with limited information in project reports, and without disaggregated project-level data.
GIF has made progress in helping to improve environmental quality. From April 2009 to March 2019, INFC spent over $441 million for 21 green energy, solid waste and wastewater projects in five provinces and one territory, of which 12 were completed as of March 31 2019. While final project reports indicate some benefits as a result of GIF funding, the magnitude of those benefits was not measurable due to the lack of established targets, limited information in the reports and no disaggregated project-level data. The following section presents examples of GIF projects’ impact on environmental quality.
Contribution to Improving Air and Water Quality
Literature suggests that wastewater effluents are the largest source of pollution by volume to surface water in Canada and may contain many pollutants and substances of concern including grit, debris, suspended solids, etc.Footnote 9 As of March 31, 2019, INFC had spent $162 million on ten wastewater projects in British Columbia, Ontario and Manitoba through GIF. Six of them are completed and implemented in Ontario.
As per the project final reports, some municipalities in Ontario have seen a decrease of volume of pollutants in their wastewater effluent. Table 4 illustrates which municipalities in Ontario met the Minimum Federal Requirement as stipulated in the Wastewater Systems Effluent Regulations (WSER)Footnote 10. The evaluation was not able to explain why Kirkland Lake was unable to meet these requirements.
| Type of Pollutant | Minimum Federal Requirements | Burlington(Halton Region) | City of Timmins | City of Cornwall | City of Owen Sound | Kirkland Lake |
|---|---|---|---|---|---|---|
| Biochemical Oxygen Demand of 5 days (BODS) | 25 | 3.8 | 9.2 | 1.9 | 6.3 | 7.53 |
| Total Suspended Solids (TSS) | 25 | 8.5 | 9.5 | 1.8 | 8.4 | 143.46 |
| Total Phosphorus | 1 | 0.41 | 0.24 | N/A | N/A | 3.7 |
Source: Projects Final reports. Information on total phosphorus is not available for cities of Cornwall and Owen Sound.
Figure 3 presents the particular case of the City of Timmins’ reduced volume of pollutants in wastewater effluent as a result of the Mattagami wastewater secondary level treatment plant project funded by INFC.
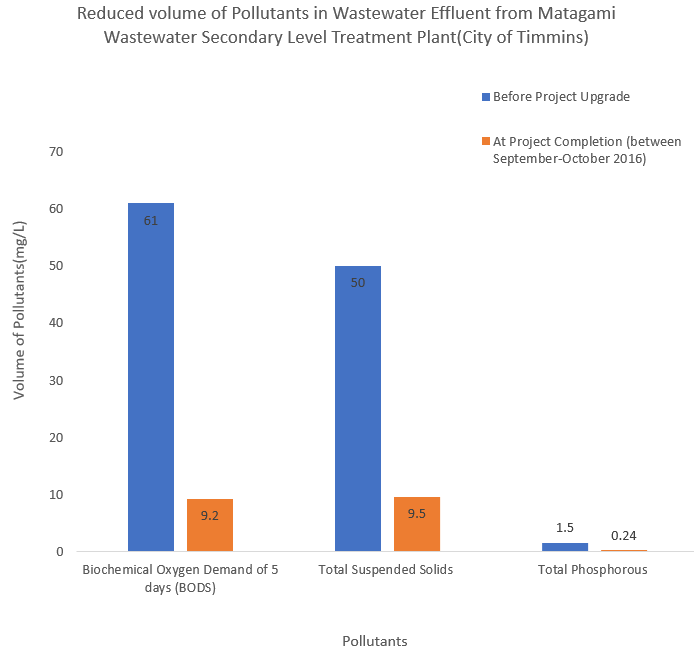
Description of figure 3: Reduction of the Volume of Pollutants in Wastewater Effluent in the City of Timmins
This figure represents the presents the particular case of the City of Timmins’ reduced volume of pollutants in wastewater effluent as a result of the Mattagami wastewater secondary level treatment plant project funded by INFC. The distribution is as follows:
- Biochemical Oxygen Demand of 5 days (BDO5):
Before the project upgrade 61 milligrams per liter. At completion: 9.2 - Total Suspended Solis:
Before: 50 miligrams per liter. At completion: 9.5 milligrams per liter - Total Phosphorus:
Before: 1.5 miligrams per liter. At completion: 0.24 miligrams per liter
Source: 2016 Project Final Report.
As per the National Pollutant Release Inventory, primary treatment removes 60 percent of the common pollutants in wastewater and using secondary treatment improves this to 90 percentFootnote 11. Moreover, insufficient wastewater treatment can lead to negative impacts on ecosystems and human healthFootnote 12. It can release emissions to the air, mostly in the form of carbon dioxide and methaneFootnote 13. The chemicals typically released in the largest volume include methane, carbon dioxide, oxides of nitrogen, hydrogen sulfide, chlorine (if used in the treatment process). Air pollutants include key air pollutants such as fine particulate matter, nitrogen, Sulphur Dioxide, and volatile organic compounds that are small enough to be inhaled and damage health and the environment Footnote 14.
The program data review reveals that, among ten wastewater projects funded under GIF, eight municipalities received funding to treat their wastewater to a higher quality as seen in Table 5.
| Municipality | Primary to Secondary Treatment | Secondary to Tertiary Treatment | OtherTable note * |
|---|---|---|---|
| Regional Municipality of Halton (Burlington), Ontario | X | ||
| City of Timmins, Ontario | x | ||
| The Victoria Capital Regional District (CRD), British Columbia | X | ||
| City of Winnipeg, Manitoba | X | ||
| City of Cornwall, Ontario | X | ||
| City of Owen Sound, Ontario | x | ||
| Town of Kirkland Lake, Ontario | X | ||
| Township of Red Rock, Ontario | x | ||
| City of Hamilton, Ontario | X | ||
| The Municipality of South Dundas, Ontario | X | ||
| Total Number of projects | 3 | 5 | 2 |
| Number of completed projects | 2 | 4 | 0 |
Source: Infrastructure Financial Report, April 3, 2019.
While some GIF funding recipients in Ontario benefited from wastewater that is treated to a higher quality, some others reported having increased the volume of treated wastewater discharged including:
- The Regional Municipality of Halton (Ontario) recorded an increase from 118 to 140 million litres per day (MLD) after receiving funding to upgrade the level of treatment (secondary to tertiary treatment).
- The City of Timmins reported a capacity of 140 MLD after the project completion. The municipality treated 82 MLD before the project upgrade.
While disaggregated project-level data on water and air quality is not available to better assess the extent of INFC’s contribution, literature on improvements in municipal wastewater treatment level and capacity show that GIF funding has a positive impact on water and air quality. The higher the level of treatment provided by a wastewater treatment plant, the cleaner the effluent and the smaller the impact on the environmentFootnote 15.
In addition to wastewater projects funded in Ontario, as of March 31, 2019, GIF has funded approximately $13 million for seven solid waste management projects in Quebec. Two out of these seven projects were completed and are part of nine anaerobic digestion facilities owned by QuebecFootnote 16. These projects included upgrading or constructing anaerobic digestion systems (biomethanation)Footnote 17 that capture and convert methane gas into fuel. The two project final reports outline project benefits and indicated municipalities have made progress regarding the quantity of solid waste diverted from disposal.
For instance, while the Municipality of Rivière-du-Loup (Quebec) reported 115 kg/capita of organics materials diverted from landfill disposal, the expected quantity (166 kg/capita) was not achieved. In the municipality of Saint-Hyacinthe 1,842 kg/capita of organic materials were diverted from landfill disposalFootnote 18. Between 2016 and 2018, the amount of organic materials diverted in Quebec grew by 168,000 tonnes (or 61%) to reach 432,000 tonnesFootnote 19.
According to Environment and Climate Change Canada (ECCC)Footnote 20, the most garbage collected for disposal ends up in landfills and a small amount is incinerated. This can lead to air emissions, land disturbance or water pollution. Diverting waste by recycling and composting can help reduce the impact of solid waste on the environment.
Although the number of completed projects is limited and the quantity of solid waste diverted from disposal is therefore not as much as expected as of March 31 2019, the GIF funding for solid waste management has the potential to further contribute to water and air quality once projects are completed.
Contribution to Reduction of Greenhouse Gas (GHG) emissions
Reduction of GHG Emissions from Green Energy (Hydro Electricity)
As of March 31, 2019, GIF funded $265 million for four green energy projects in Prince Edward Island, British Columbia and Yukon. All four green energy projects were completed. The projects involved the upgrades of hydro generation facilities, installation of power cables and electric transmission lines to increase clean energy generation capacity and help reduce GHG emissions by reducing the reliance on diesel generation. The projects’ reports highlighted some benefits including:
- Increasing Yukon Energy’s clean energy generation by an additional 5 Megawatts (MW) as a result of the new Mayo hydro generation facilityFootnote 21. Before the project, the capacity was rated as 5.4 MW per year. The new capacity is rated as 10.4 MW as expected. As seen in Table 6, the reduction of GHG emissions for 2013 as result of the project is estimated as 14,350 tonnes of CO2, which represents a diesel generation reduction of 20.5 Gigawatt hours. The Mayo Generating Station went into service at the end of December 2011.
- Increasing production of clean power and access to a clean energy source by communities and industry in British Columbia as a result of the Northwest Transmission Line (NTL) projectFootnote 22. The Forrest Kerr generating station that interconnects with the NTL with a capacity to produce 277 MW when the NTL went in service in December 2014. The community of Iskut was connected to BC Hydro’s grid, reducing the need for diesel generated power. The reduction in GHG emissions is estimated as 2,037 tonnes/year, below the expected 2,800 tonnes/year.
|
Estimated GHG emission reductions (tons of CO2) |
Electricity | Waste | Total | |
|---|---|---|---|---|
| Yukon Legacy Project 2013 |
Northwest Transmission Line (British Columbia) | Biomethanation Project Municipality of Rivière-du-Loup (Quebec) 2018 |
||
| 14,350 | 2,037 | 2,595 | 18,982 | |
Source: Project Final Reports.
Reduction of GHG Emissions from Solid Waste
Methane is the second most common GHG in Canada, responsible for about 15% of Canadian total GHG emissionsFootnote 23. Emissions from Canadian landfills account for 20% of national methane emissionsFootnote 24. As mentioned above, the seven solid waste projects funded through GIF involved the construction of anaerobic digestion and composting facilities to treat organic materials (from residential, agro-industrial, institutional, commercial and industrial sources), as well as to produce, capture and convert methane gas into fuel to power long-haul vehicles and heat buildings. One of the benefits of diverting organic materials from landfills (using composting or anaerobic digestion) enumerated by ECCC is reduced methane emissions and the production of renewable energyFootnote 25. For example, two municipalities in Quebec were able to divert 1,957kg/capita of organic materials from landfill disposal. Table 7 presents the volume of gas produced, recovered and recycled from anaerobic digestion for the two municipalities in Quebec in 2018 after the first year of project completion.
| GasFootnote 26 | Municipality of Saint-Hyacinthe | Municipality of Rivière-du-Loup | ||
|---|---|---|---|---|
| Volume | Recovered/Recycled Gas | Volume | Recovered/Recycled Gas | |
| Biogas (m3) | 4,241,541 | Heat buildings | 1,100,000 | 100% destroyed in a flare |
| Digestate (tons) | 22,045 | 100% recycled | 972 | 100% spread to agricultural fields |
| Biomethane(m3) | 2,789,941 | N/A | ||
Source: Project Annual Reports, 2018.
While it was not possible to assess the reduction of landfill gas emissions produced by the two projects, both have met the minimum federal requirement of 60% for recovery rate of organic materials for at least one of the two biogas or digestate gases.
INFC funding under GIF has contributed to reducing GHG emissions in categories such as electricity and solid waste. While this reduction is contributing to the national target to reduce methane emission at the national level by 45% by 2025 as per the Pan-Canadian Framework on Clean Growth and Climate Change, the extent to which the projects contributed to reducing GHG emissions cannot be quantified given there were only three (two in the Energy category and one in the solid waste category) out of 11 projects completed between April 1, 2009 to March 31, 2019 that have available information on GHG emissions reductions.
Improvements of Land Quality
Diverting waste from landfills does not only have the benefit of reducing methane emissions and, in turn, GHGs. This methane can also be spread in agricultural fields to improve the soil, as mentioned above in the case of projects funded in Quebec. Due to the limited number of completed projects, it is not possible to assess the contribution of GIF funding in the improvement of the land quality.
Although the evaluation found that progress was made towards program results, for some of them, the extent of progress made cannot be determined without targets. Moreover, the magnitude of benefits of GIF projects was not measurable, as a limited number of projects were completed and there was a lack of performance information provided in annual reports.
5.3 Inclusivity
The 2016 Directive on Results requires evaluators to consider government-wide policy commitments, including Gender-based Analysis Plus (GBA+). GIF met the government’s gender-based analysis requirementsFootnote 27 in its development and implementation.
The evaluation went beyond assessing the extent to which GIF met the requirements for gender-based analysis in program development and implementation, to examine program results and external data through an inclusiveness lens more broadly. The intention of this analysis was not to draw conclusions on the relevance or effectiveness of GIF, but rather to use available data to identify potential areas to consider in the development of future infrastructure programming. The analysis was conducted in line with the spirit of GBA+ to “assess how diverse groups of… people may experience government… programs”, Footnote 28 and should be considered supplemental to the evaluation of GIF itself.
This supplemental GBA+ analysis looked at locations where projects took place to determine the distribution across different population center sizes and across provinces and territories. The evaluation found that the need for green infrastructure was relevant to communities of diverse sizes across Canada and that these needs were addressed by wastewater, solid waste and green infrastructure projects funded under GIF.
Finding #6: Municipalities of diverse sizes had access to funding.
GIF funded projects were across five provinces and one territory, with the majority in the larger and more populous provinces of Ontario and Quebec. As seen in Table 8, GIF had an even distribution of projects across size of municipality, with close to 25% of all projects taking place in small and medium population centres, 33% of projects in large population centres, and 14% in rural areas. As many small municipalities as large municipalities (33%) have received GIF funding.
| Size of Municipality | Number of projects | Percentage of Total Projects |
|---|---|---|
| Large (>100,000) | 7 | 33% |
| Medium (>30,000) | 5 | 24% |
| Small (<1,000) | 5 | 24% |
| Rural (<1,000) | 3 | 14% |
| Mixed (more than one municipality) | 1 | 5% |
| Total | 21 | 100% |
Source: INFC Financial Report, April 3, 2019 and Statistics Canada Census Data 2016.
6.0 Conclusions
GIF addressed the infrastructure needs of Canadians for green energy, solid waste management and wastewater infrastructure. The need for green infrastructure was relevant to communities of diverse sizes across Canada.
Through GIF, INFC funded $735 million for projects related to green energy, solid waste management and wastewater. GIF has contributed to leveraging funding for green infrastructure by the department and improving environmental quality.
Due to the absence of disaggregated project-level data, absence of targets, and the limited completed projects, it was not possible to assess the extent to which progress towards expected outcomes was made.
The evaluation has no recommendations as GIF is sunsetting and all funds are committed.
Annex A: Mapping of GIF outcomes, indicators and theme
| Outcome | Indicator | Themes |
|---|---|---|
|
Infrastructure projects between the federal government, provinces, municipalities and private sector.Footnote * |
Total number of projects under the program
|
Finding 2: GIF has leveraged more funding from external sources than any other INFC green program. In the absence of targets, the evaluation cannot confirm the extent of the success against program objectives. |
|
# of strategic partners (provinces, municipality, NGO) and reach of partnershipsFootnote * |
||
|
The extent to which GIF funded projects have resulted in increased funding for green infrastructure initiatives.Footnote * |
Total amount of funding from INFC
|
|
|
Total amount of funding from INFC partners
|
||
|
Increased amount of modern and greener infrastructure in CanadaFootnote ** |
Total number and value of infrastructure projects by categoryFootnote ** |
|
|
Improved environment quality – Air qualityFootnote *** |
Decreased volume of emissions and pollutantsFootnote *** |
Finding 3: Although progress has been made towards GIF’s final outcome of improving environmental quality, it is not possible to assess the extent of progress made without targets and with insufficient and inconsistent data. |
|
Improved environment quality – Water qualityFootnote *** |
# of communities and households with untreated wastewater connected to sanitary sewer systems.Footnote *** |
|
|
Increased capacity of communities to treat waste water (volume per year).Footnote *** |
||
|
# of communities and households where Wastewater is treated to a higher qualityFootnote *** |
||
|
Improved environment quality – Greenhouse gases (GHG)Footnote *** |
GHG emitted per unit of economic activity in Canada. (Tons of GHG / GDP)Footnote *** |
|
|
GHG emissions by the following Canadian activity sectors:
|
||
|
% of Canadian energy generated by clean sourcesFootnote *** |
||
|
Improved environment quality – Land qualityFootnote *** |
Quantity (kg/capita) of solid waste diverted from disposal.Footnote *** |
|
|
Square Meters of landfill sites managed, reclaimed and/or remediated to certificate of conformity requirements.Footnote *** |
||
|
Decreased volume of landfill gas emissionsFootnote *** |
Annex B: GIF Results Matrix
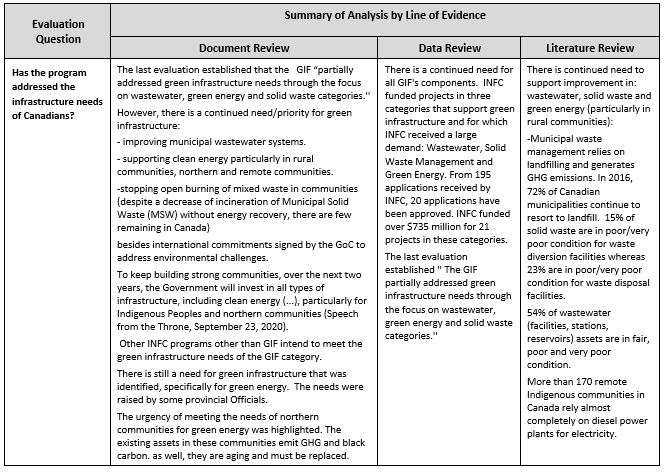
Description of figure 4: Evaluation Question - Has the program addressed the infrastructure needs of Canadians?
Summary of Analysis by Line of Evidence
Document Review
The last evaluation established that the GIF “partially addressed green infrastructure needs through the focus on wastewater, green energy and solid waste categories.''
However, there is a continued need/priority for green infrastructure:
- improving municipal wastewater systems.
- supporting clean energy particularly in rural communities, northern and remote communities.
- stopping open burning of mixed waste in communities (despite a decrease of incineration of Municipal Solid Waste (MSW) without energy recovery, there are few remaining in Canada) besides international commitments signed by the GoC to address environmental challenges.
To keep building strong communities, over the next two years, the Government will invest in all types of infrastructure, including clean energy (...), particularly for Indigenous Peoples and northern communities (Speech from the Throne, September 23, 2020).
Other INFC programs other than GIF intend to meet the green infrastructure needs of the GIF category.
There is still a need for green infrastructure that was identified, specifically for green energy. The needs were raised by some provincial Officials.
The urgency of meeting the needs of northern communities for green energy was highlighted. The existing assets in these communities emit GHG and black carbon. as well, they are aging and must be replaced.
Data Review
There is a continued need for all GIF's components. INFC funded projects in three categories that support green infrastructure and for which INFC received a large demand: Wastewater, Solid Waste Management and Green Energy. From 195 applications received by INFC, 20 applications have been approved. INFC funded over $735 million for 21 projects in these categories.
The last evaluation established '' The GIF partially addressed green infrastructure needs through the focus on wastewater, green energy and solid waste categories.''
Literature Review
There is continued need to support improvement in: wastewater, solid waste and green energy (particularly in rural communities):
- Municipal waste management relies on landfilling and generates GHG emissions. In 2016, 72% of Canadian municipalities continue to resort to landfill. 15% of solid waste are in poor/very poor condition for waste diversion facilities whereas 23% are in poor/very poor condition for waste disposal facilities.
- 54% of wastewater (facilities, stations, reservoirs) assets are in fair, poor and very poor condition.
- More than 170 remote Indigenous communities in Canada rely almost completely on diesel power plants for electricity.
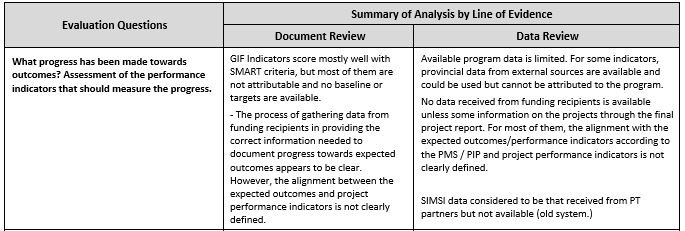
Description of figure 5: Evaluation Question - What progress has been made towards outcomes? Assessment of the performance indicators that should measure the progress.
Summary of Analysis by Line of Evidence
Document Review
GIF Indicators score mostly well with SMART criteria, but most of them are not attributable and no baseline or targets are available.
The process of gathering data from funding recipients in providing the correct information needed to document progress towards expected outcomes appears to be clear. However, the alignment between the expected outcomes and project performance indicators is not clearly defined.
Data Review
Available program data is limited. For some indicators, provincial data from external sources are available and could be used but cannot be attributed to the program.
No data received from funding recipients is available unless some information on the projects through the final project report. For most of them, the alignment with the expected outcomes/performance indicators according to the PMS / PIP and project performance indicators is not clearly defined.
SIMSI data considered to be that received from PT partners but not available (old system.)
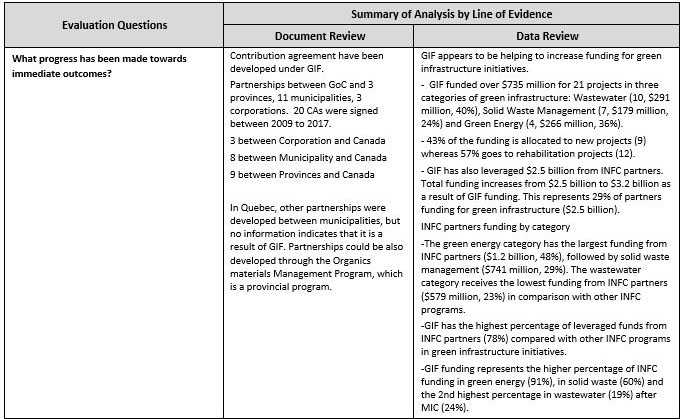
Description of figure 6: Evaluation Question - What progress has been made towards immediate outcomes?
Summary of Analysis by Line of Evidence
Document Review
- Contribution agreement have been developed under GIF.
- Partnerships between GoC and 3 provinces, 11 municipalities, 3 corporations. 20 CAs were signed between 2009 to 2017.
- 3 between Corporation and Canada
- 8 between Municipality and Canada
- 9 between Provinces and Canada
In Quebec, other partnerships were developed between municipalities, but no information indicates that it is a result of GIF. Partnerships could be also developed through the Organics materials Management Program, which is a provincial program.
Data Review
GIF appears to be helping to increase funding for green infrastructure initiatives.
- GIF funded over $735 million for 21 projects in three categories of green infrastructure: Wastewater (10, $291 million, 40%), Solid Waste Management (7, $179 million, 24%) and Green Energy (4, $266 million, 36%).
- 43% of the funding is allocated to new projects (9) whereas 57% goes to rehabilitation projects (12).
- GIF has also leveraged $2.5 billion from INFC partners. Total funding increases from $2.5 billion to $3.2 billion as a result of GIF funding. This represents 29% of partners funding for green infrastructure ($2.5 billion).
INFC partners funding by category
- The green energy category has the largest funding from INFC partners ($1.2 billion, 48%), followed by solid waste management ($741 million, 29%). The wastewater category receives the lowest funding from INFC partners ($579 million, 23%) in comparison with other INFC programs.
- GIF has the highest percentage of leveraged funds from INFC partners (78%) compared with other INFC programs in green infrastructure initiatives.
- GIF funding represents the higher percentage of INFC funding in green energy (91%), in solid waste (60%) and the 2nd highest percentage in wastewater (19%) after MIC (24%).
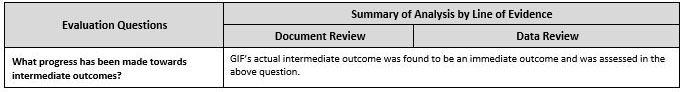
Description of figure 7: Evaluation Question - What progress has been made towards intermediate outcomes?
Summary of Analysis by Line of Evidence
Document Review (and Data review)
GIF’s actual intermediate outcome was found to be an immediate outcome and was assessed in the above question.
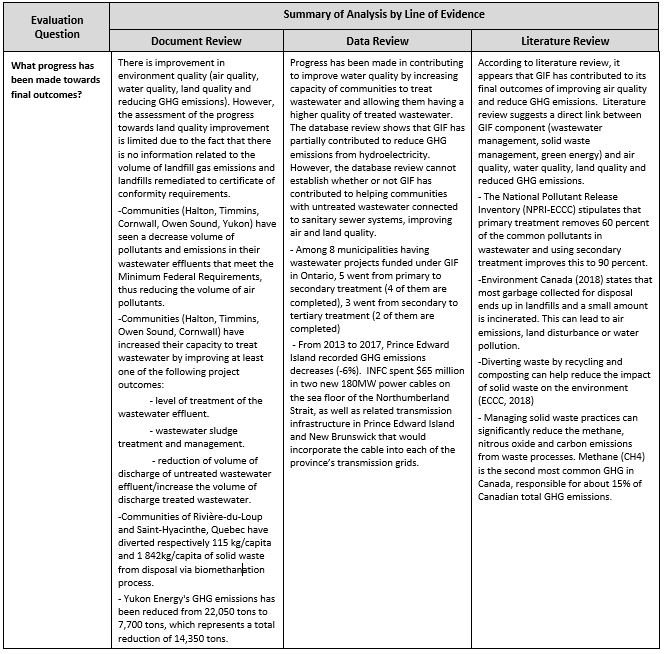
Description of figure 8: Evaluation Question - What progress has been made towards final outcomes?
Summary of Analysis by Line of Evidence
Document Review
There is improvement in environment quality (air quality, water quality, land quality and reducing GHG emissions). However, the assessment of the progress towards land quality improvement is limited due to the fact that there is no information related to the volume of landfill gas emissions and landfills remediated to certificate of conformity requirements.
Communities (Halton, Timmins, Cornwall, Owen Sound, Yukon) have seen a decrease volume of pollutants and emissions in their wastewater effluents that meet the Minimum Federal Requirements, thus reducing the volume of air pollutants.
Communities (Halton, Timmins, Owen Sound, Cornwall) have increased their capacity to treat wastewater by improving at least one of the following project outcomes:
- level of treatment of the wastewater effluent.
- wastewater sludge treatment and management.
- reduction of volume of discharge of untreated wastewater effluent/increase the volume of discharge treated wastewater.
- Communities of Rivière-du-Loup and Saint-Hyacinthe, Quebec have diverted respectively 115 kg/capita and 1 842kg/capita of solid waste from disposal via biomethanation process.
- Yukon Energy's GHG emissions has been reduced from 22,050 tons to 7,700 tons, which represents a total reduction of 14,350 tons.
Data Review
Progress has been made in contributing to improve water quality by increasing capacity of communities to treat wastewater and allowing them having a higher quality of treated wastewater. The database review shows that GIF has partially contributed to reduce GHG emissions from hydroelectricity. However, the database review cannot establish whether or not GIF has contributed to helping communities with untreated wastewater connected to sanitary sewer systems, improving air and land quality.
- Among 8 municipalities having wastewater projects funded under GIF in Ontario, 5 went from primary to secondary treatment (4 of them are completed), 3 went from secondary to tertiary treatment (2 of them are completed)
- From 2013 to 2017, Prince Edward Island recorded GHG emissions decreases (-6%). INFC spent $65 million in two new 180MW power cables on the sea floor of the Northumberland Strait, as well as related transmission infrastructure in Prince Edward Island and New Brunswick that would incorporate the cable into each of the province’s transmission grids.
Literature Review
According to literature review, it appears that GIF has contributed to its final outcomes of improving air quality and reduce GHG emissions. Literature review suggests a direct link between GIF component (wastewater management, solid waste management, green energy) and air quality, water quality, land quality and reduced GHG emissions.
- The National Pollutant Release Inventory (NPRI-ECCC) stipulates that primary treatment removes 60 percent of the common pollutants in wastewater and using secondary treatment improves this to 90 percent.
- Environment Canada (2018) states that most garbage collected for disposal ends up in landfills and a small amount is incinerated. This can lead to air emissions, land disturbance or water pollution.
- Diverting waste by recycling and composting can help reduce the impact of solid waste on the environment (ECCC, 2018)
- Managing solid waste practices can significantly reduce the methane, nitrous oxide and carbon emissions from waste processes. Methane (CH4) is the second most common GHG in Canada, responsible for about 15% of Canadian total GHG emissions.
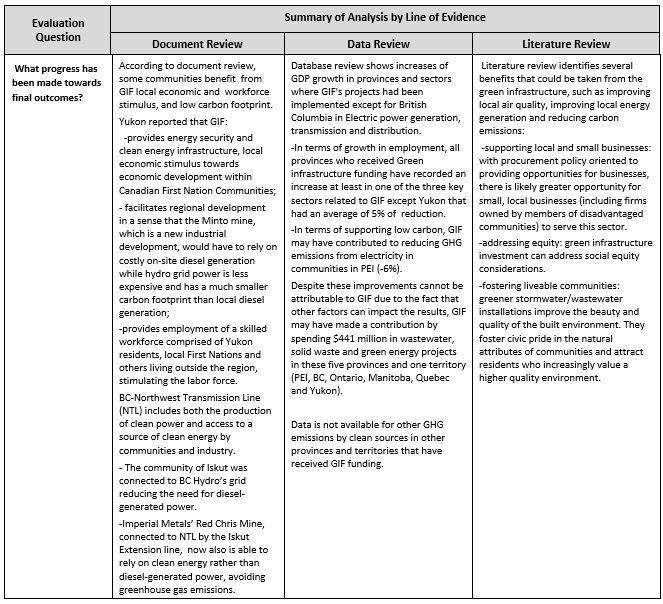
Description of figure 9: Evaluation Question - What progress has been made towards final outcomes? (Doc Review)
Summary of Analysis by Line of Evidence
Document Review
There is improvement in environment quality (air quality, water quality, land quality and reducing GHG emissions). However, the assessment of the progress towards land quality improvement is limited due to the fact that there is no information related to the volume of landfill gas emissions and landfills remediated to certificate of conformity requirements.
Communities (Halton, Timmins, Cornwall, Owen Sound, Yukon) have seen a decrease volume of pollutants and emissions in their wastewater effluents that meet the Minimum Federal Requirements, thus reducing the volume of air pollutants.
Communities (Halton, Timmins, Owen Sound, Cornwall) have increased their capacity to treat wastewater by improving at least one of the following project outcomes:
- level of treatment of the wastewater effluent.
- wastewater sludge treatment and management.
- reduction of volume of discharge of untreated wastewater effluent/increase the volume of discharge treated wastewater.
Communities of Rivière-du-Loup and Saint-Hyacinthe, Quebec have diverted respectively 115 kg/capita and 1 842kg/capita of solid waste from disposal via biomethanation process.
Yukon Energy's GHG emissions has been reduced from 22,050 tons to 7,700 tons, which represents a total reduction of 14,350 tons.
According to document review, some communities benefit from GIF local economic and workforce stimulus, and low carbon footprint.
Yukon reported that GIF:
- provides energy security and clean energy infrastructure, local economic stimulus towards economic development within Canadian First Nation Communities;
- facilitates regional development in a sense that the Minto mine, which is a new industrial development, would have to rely on costly on-site diesel generation while hydro grid power is less expensive and has a much smaller carbon footprint than local diesel generation;
- provides employment of a skilled workforce comprised of Yukon residents, local First Nations and others living outside the region, stimulating the labor force.
- BC-Northwest Transmission Line (NTL) includes both the production of clean power and access to a source of clean energy by communities and industry.
- The community of Iskut was connected to BC Hydro’s grid reducing the need for diesel-generated power.
- Imperial Metals’ Red Chris Mine, connected to NTL by the Iskut Extension line, now also is able to rely on clean energy rather than diesel-generated power, avoiding greenhouse gas emissions.
Data Review
Progress has been made in contributing to improve water quality by increasing capacity of communities to treat wastewater and allowing them having a higher quality of treated wastewater. The database review shows that GIF has partially contributed to reduce GHG emissions from hydroelectricity. However, the database review cannot establish whether or not GIF has contributed to helping communities with untreated wastewater connected to sanitary sewer systems, improving air and land quality.
- Among 8 municipalities having wastewater projects funded under GIF in Ontario, 5 went from primary to secondary treatment (4 of them are completed), 3 went from secondary to tertiary treatment (2 of them are completed)
- From 2013 to 2017, Prince Edward Island recorded GHG emissions decreases (-6%). INFC spent $65 million in two new 180MW power cables on the sea floor of the Northumberland Strait, as well as related transmission infrastructure in Prince Edward Island and New Brunswick that would incorporate the cable into each of the province’s transmission grids.
Database review shows increases of GDP growth in provinces and sectors where GIF's projects had been implemented except for British Columbia in Electric power generation, transmission and distribution.
- In terms of growth in employment, all provinces who received Green infrastructure funding have recorded an increase at least in one of the three key sectors related to GIF except Yukon that had an average of 5% of reduction.
- In terms of supporting low carbon, GIF may have contributed to reducing GHG emissions from electricity in communities in PEI (-6%).
Despite these improvements cannot be attributable to GIF due to the fact that other factors can impact the results, GIF may have made a contribution by spending $441 million in wastewater, solid waste and green energy projects in these five provinces and one territory (PEI, BC, Ontario, Manitoba, Quebec and Yukon).
Data is not available for other GHG emissions by clean sources in other provinces and territories that have received GIF funding.
Literature Review
According to literature review, it appears that GIF has contributed to its final outcomes of improving air quality and reduce GHG emissions. Literature review suggests a direct link between GIF component (wastewater management, solid waste management, green energy) and air quality, water quality, land quality and reduced GHG emissions.
The National Pollutant Release Inventory (NPRI-ECCC) stipulates that primary treatment removes 60 percent of the common pollutants in wastewater and using secondary treatment improves this to 90 percent.
Environment Canada (2018) states that most garbage collected for disposal ends up in landfills and a small amount is incinerated. This can lead to air emissions, land disturbance or water pollution.
Diverting waste by recycling and composting can help reduce the impact of solid waste on the environment (ECCC, 2018)
Managing solid waste practices can significantly reduce the methane, nitrous oxide and carbon emissions from waste processes. Methane (CH4) is the second most common GHG in Canada, responsible for about 15% of Canadian total GHG emissions.
Literature review identifies several benefits that could be taken from the green infrastructure, such as improving local air quality, improving local energy generation and reducing carbon emissions:
- supporting local and small businesses: with procurement policy oriented to providing opportunities for businesses, there is likely greater opportunity for small, local businesses (including firms owned by members of disadvantaged communities) to serve this sector.
- addressing equity: green infrastructure investment can address social equity considerations.
- fostering liveable communities: greener stormwater/wastewater installations improve the beauty and quality of the built environment. They foster civic pride in the natural attributes of communities and attract residents who increasingly value a higher quality environment.
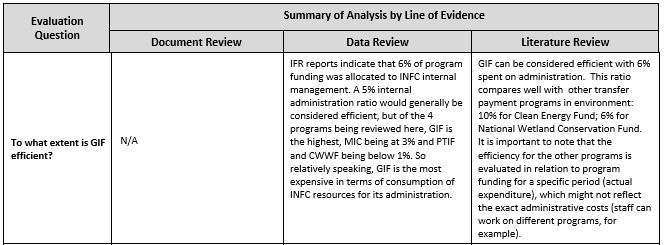
Description of figure 10: Evaluation Question - To what extent is GIF efficient?
Summary of Analysis by Line of Evidence
Document Review
N/A
Data Review
IFR reports indicate that 6% of program funding was allocated to INFC internal management. A 5% internal administration ratio would generally be considered efficient, but of the 4 programs being reviewed here, GIF is the highest, MIC being at 3% and PTIF and CWWF being below 1%. So relatively speaking, GIF is the most expensive in terms of consumption of INFC resources for its administration.
Literature Review
GIF can be considered efficient with 6% spent on administration. This ratio compares well with other transfer payment programs in environment: 10% for Clean Energy Fund; 6% for National Wetland Conservation Fund. It is important to note that the efficiency for the other programs is evaluated in relation to program funding for a specific period (actual expenditure), which might not reflect the exact administrative costs (staff can work on different programs, for example).
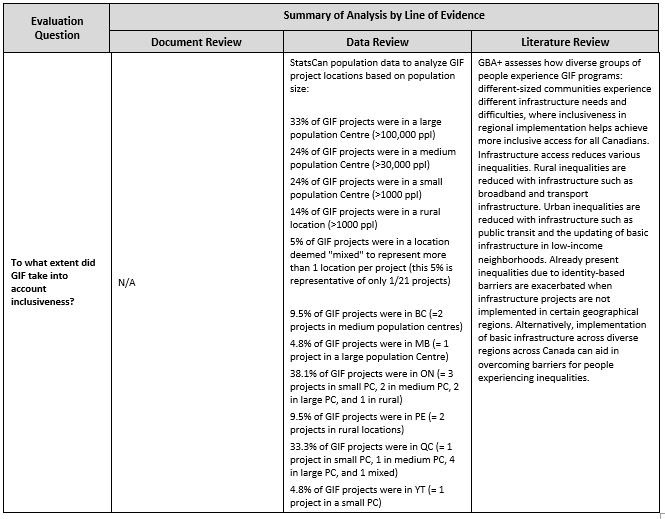
Description of figure 11: Evaluation Question - To what extent did GIF take into account inclusiveness?
Summary of Analysis by Line of Evidence
Document Review
N/A
Data Review
StatsCan population data to analyze GIF project locations based on population size:
- 33% of GIF projects were in a large population Centre (>100,000 ppl)
- 24% of GIF projects were in a medium population Centre (>30,000 ppl)
- 24% of GIF projects were in a small population Centre (>1000 ppl)
- 14% of GIF projects were in a rural location (>1000 ppl)
- 5% of GIF projects were in a location deemed "mixed" to represent more than 1 location per project (this 5% is representative of only 1/21 projects)
- 9.5% of GIF projects were in BC (=2 projects in medium population centres)
- 4.8% of GIF projects were in MB (= 1 project in a large population Centre)
- 38.1% of GIF projects were in ON (= 3 projects in small PC, 2 in medium PC, 2 in large PC, and 1 in rural)
- 9.5% of GIF projects were in PE (= 2 projects in rural locations)
- 33.3% of GIF projects were in QC (= 1 project in small PC, 1 in medium PC, 4 in large PC, and 1 mixed)
- 4.8% of GIF projects were in YT (= 1 project in a small PC)
Literature Review
GBA+ assesses how diverse groups of people experience GIF programs: different-sized communities experience different infrastructure needs and difficulties, where inclusiveness in regional implementation helps achieve more inclusive access for all Canadians. Infrastructure access reduces various inequalities. Rural inequalities are reduced with infrastructure such as broadband and transport infrastructure. Urban inequalities are reduced with infrastructure such as public transit and the updating of basic infrastructure in low-income neighborhoods. Already present inequalities due to identity-based barriers are exacerbated when infrastructure projects are not implemented in certain geographical regions. Alternatively, implementation of basic infrastructure across diverse regions across Canada can aid in overcoming barriers for people experiencing inequalities.
Report a problem on this page
- Date modified: