
Evaluation of the Green Infrastructure Fund
Evaluation of the Clean Water and Wastewater Fund — April 2021

Evaluation of the Clean Water and Wastewater
Fund — April 2021
(PDF Version)
Table of Contents
- List of Acronyms
- 1.0 Executive Summary
- 2.0 Program Overview
- 3.0 Evaluation Objectives, Scope and Questions
- 4.0 Methodology, Limitations and Mitigation Strategies
- 5.0 Findings
- 6.0 Conclusions
- Annex A: Mapping of CWWF outcomes, indicators and theme
- Annex B: Results Matrix
List of Acronyms
- CCPI
- Canada’s Core Public Infrastructure
- CWWF
- Clean Water and Wastewater Fund
- FAA
- Financial Administration Act
- GBA+
- Gender-based Analysis Plus
- INFC
- Infrastructure Canada
- IFR
- Infrastructure Financial Report
1.0 Executive Summary
Program Overview
The Clean Water and Wastewater Fund (CWWF) was a three year 2016-17 to 2018-19, $2 billion contribution program that provided funding to the provinces and territories to help accelerate short term municipal funding by supporting community water and wastewater infrastructure and to enable municipalities to meet the requirements of the federal Wastewater System Effluent Regulations.
Evaluation Objective and Scope
The objective of this evaluation was to meet the requirements of section 42.1 of the Financial Administration Act (FAA) to consider Gender-based Analysis Plus (GBA+) as expressed in the Treasury Board Directive on Results.
The evaluation looked at all approved and announced projects for CWWF from April 1, 2016 to March 31, 2019. Claims for CWWF projects continued to be paid and outcome reports received after this period, though these were outside of the scope of this evaluation.
Key Findings and Conclusions
Relevance
CWWF has overall addressed needs for drinking water, wastewater and storm water infrastructure.
Progress towards achievement of outcomes
Overall, CWWF funding resulted in progress towards its immediate and intermediate expected outcomes as outlined in its performance information profile:
- Communities’ benefit from incremental funding.
- CWWF made progress towards wastewater treatment infrastructure meeting federal regulatory requirements.
- CWWF made progress towards systemFootnote 1 optimization and improved asset management.
- CWWF made progress towards the rehabilitation of water, wastewater and storm water infrastructure.
Inclusivity
The 2016 Directive on Results requires evaluators to consider government-wide policy commitments, including GBA+. CWWF met the government’s Gender-based Analysis requirementsFootnote 2 in its development and implementation.
The evaluation went beyond assessing the extent to which CWWF met the requirements for GBA+ in program development and implementation, to examine program results and external data through an inclusiveness lens more broadly. The intention of this analysis was not to draw conclusions on the relevance or effectiveness of CWWF, but rather to use available data to identify potential areas to consider in the development of future infrastructure programming. The analysis was conducted in keeping with the spirit of GBA+ to “assess how diverse groups of people may experience government programs”, Footnote 3 and should be considered supplemental to the evaluation of CWWF itself.
This supplemental GBA+ analysis looked at drinking water infrastructure for Indigenous peoples in Canada living off-reserve and for areas with reported drinking water advisories, to examine the inclusivity of drinking water funding. When looking at drinking water advisories and Indigenous populations off-reserve, CWWF funding was not always distributed by provinces to locations with the highest reported rates of drinking water advisories.
Recommendations
The evaluation has no recommendations as issues identified with the program’s performance measurement are being addressed through the Investing in Canada Infrastructure Program’s performance measurement strategy.
2.0 Program Overview
CWWF was a three-year (2016-17 to 2018-19), $2-billion program. It provided funding to provinces and territories to help accelerate short-term municipal funding by supporting community water and wastewater infrastructure and to enable municipalities to meet the requirements of the federal Wastewater System Effluent Regulations. The eligible funding categories included drinking water, wastewater and storm water.
CWWF funding was cost shared between INFC and the provinces and territories, municipalities, or all three. The program was managed through contribution agreements between INFC and each province and territory. Provinces and territories were responsible for program administration and distributing the funds to eligible recipients, which included municipal or regional governments and organizations that provided drinking water, wastewater or storm, water services to communities. Table 1 illustrates the number of approved projects, under CWWF, and INFC’s contribution and claims paid as of March 31, 2019.
| Number of Approved Projects | Number of Completed Projects | Program Contribution | Claims Paid |
|---|---|---|---|
| 2,394 | 749 | $ 1,919,521,354 | $ 907,455,112 |
Source: INFC’s Funding Report, April 3, 2019.
3.0 Evaluation Objectives, Scope and Questions
The objective of this evaluation was to meet the requirements of section 42.1 of the Financial Administration Act (FAA) that requires, for programs with average spending greater than $5 million per year, an assessment every five years of relevance, and effectiveness as defined by the Treasury Board:
- Relevance: the extent to which a program, policy or other entity addresses and is responsive to a demonstrable need. Relevance may also consider if a program, policy or other entity is a government priority or a federal responsibility.
- Effectiveness: the impacts of a program, policy or other entity, or the extent to which it is achieving its expected outcomesFootnote 4.
This evaluation also addressed the government-wide commitment to include GBA+ in evaluations as outlined in the Directive on Results.
The evaluation looked at all approved and announced projects for CWWF from April 1, 2016 to March 31, 2019. Claims for CWWF projects continued to be paid and outcome reports received after this period, though these were outside of the scope of this evaluation.
Based on the evaluation objectives, the evaluation examined the following questions:
- Q1. Has the program addressed the infrastructure needs of Canadians?
- Q2. What progress has been made towards expected outcomes?
- Q3. To what extent is the program efficient?
- Q4. To what extent did the program take into account inclusiveness?
4.0 Methodology, Limitations and Mitigation Strategies
In view of the Department shifting its capacity to focus on responding to the COVID-19 pandemic, the project was scoped to make use of data the Evaluation Directorate already had access to, eliminating the need for additional data requests. Data collected as part of previous thematic evaluations, including the Combined Audit and Evaluation of the Impacts of INFC Programs in the Territories and the Evaluation of the Impact of INFC Programs in the Vancouver Area, was also leveraged as applicable. Due to the shift in priorities, it was decided to not conduct interviews as part of this evaluation.
The lines of evidence for this evaluation included the following:
4.1 Document Review
The document review was used to assess program relevance and effectiveness. Documents provided evidence on the need for the program, while progress towards program outcomes was assessed through provincial and territorial annual progress outcome reports. News releases and INFC social media posts related to CWWF were also reviewed, to provide information on communications made to the public.
A limitation of the document review was that annual progress outcome reports were not available for all provinces and territories for 2016-2018 inclusively.
In addition, in the annual progress outcome reports, provinces and territories reported on performance indicators that they selected as the most relevant to their projects limiting the information available for some indicators.
Moreover, data that was available from outcome progress reports was not consistent among provinces and territories, making it difficult to have a comparable picture between provinces and a national picture of progress towards outcomes.
4.2 Data Review
Program data available through the Infrastructure Financial Report (IFR) provided an overview of all funded projects (including data such as number of projects by funding category, status of projects, funds allocated, and claims paid) and was used to assess program relevance and effectiveness. As well, other data sources from Statistics Canada related to infrastructure including Canada’s Core Public Infrastructure (CCPI) survey was used to assess relevance.
4.3 Literature Review
The literature review examined academic and non-academic literature to identify infrastructure needs, and the impact of infrastructure funding on long-term growth, a clean environment and resilient communities. The main source for the literature review was EBSCO, an academic library that provides a research database of e-journals, magazines, and e-books. The literature review was included in the evaluation to supplement existing data in support of the evaluation question of relevance and mitigate existing limitations to the methodology.
5.0 Findings
5.1 Relevance
The evaluation looked at Canadians’ needs for drinking water, wastewater and storm water infrastructure and the extent to which CWWF has addressed them.
Finding 1: CWWF has addressed needs for drinking water, wastewater and storm water infrastructure.
A document, and literature review identified that the need for drinking water, wastewater and storm water infrastructure exists for Canadians and is becoming more important as challenges such as climate change bring additional requirements and risks.
As seen in Table 2, the funding category of drinking water accounted for most of the CWWF funding and had the largest number of approved projects, followed by wastewater and storm water. These funding categories align with the needs identified through the document and literature review.
| Priorities/Needs identified from lines of evidence | Allocated Dollars by Funding Category | Percent of Allocated Dollars by Funding Category | Number of Approved Projects by Funding Category | Percent of Approved Projects by Funding Category |
|---|---|---|---|---|
| Drinking water | $1,060,939,591 | 55% | 1,163 |
49% |
| Wastewater | $675,173,057 | 35% | 845 |
35% |
| Storm water | $183,408,706 | 10% | 386 |
16% |
| Total | $1,919,521,354 | 100% | 2,394 | 100% |
Source: INFC Financial Report, April 3, 2019.
The distribution of approved projects across provinces and territories showed Ontario had the most approved projects and Nunavut had the fewest, with 4 projects, as seen in Figure 1.
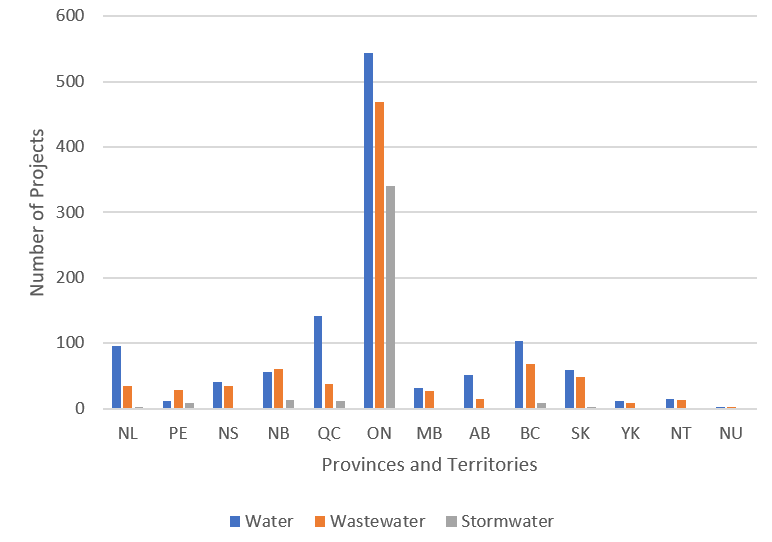
Description of the figure 1: Number of Approved Project by Category and by Province and Territory
This figure presents the number of approved projects by category and by province and territory. The distribution is as follows:
- Newfoundland 96 water, 34 wastewater, 2 stormwater
- Prince Edward Island 11water, 28 wastewater and 8 stormwater
- Nova Scotia-41 water,34 wastewater
- New Brunswick 56 water, 60 wastewater and 13 stormwater
- Quebec 141 water, 37 wastewater and 11 stormwater
- Ontario 544 water, 469 wastewater and 341 stormwater
- Manitoba 32 water,27 wastewater
- Alberta 51 water, 15 wastewater
- British Columbia 103 water, 68 wastewater and 9 stormwater
- Saskatchewan 59 water, 49 wastewater,
- Yukon 12 water, 8 wastewater
- Northwest Territories 2 water, 2 wastewater
- Nunavut 0 projects
Source: INFC Financial Report April 3, 2019.
Water infrastructure needs are defined in the literature and document review as improved condition of water, wastewater and storm water assets whether for replacement or rehabilitation, improved refunding rates for existing assets, funding into future demands and needs, including those due to climate change, and a need to support municipalities for drinking water, wastewater and storm water infrastructure expenditures.
As seen in Table 3, CWWF had 304 projects in the sub-category of new construction projects and 1,701 approved projects in the sub-category of capital projects for rehabilitation supporting the finding that CWWF has contributed to addressing those needs.
| Category (sub-category) |
Number of Approved Projects | Percent of Allocated Dollars by Funding Category and Sub-Category | Allocated Dollars per Funding Category and Sub-Category ($ million) | Percent of Allocated Dollars by Funding Category and Sub-Category |
|---|---|---|---|---|
| New construction projects | 304 | 13% | 537 |
28% |
| Storm water | 43 | 2% | 57 |
3% |
| Wastewater | 103 | 4% | 163 |
8% |
| Water | 158 | 7% | 317 |
17% |
| Capital projects for rehabilitation | 1,701 | 71% | 1,242 |
65% |
| Storm water | 250 | 10% | 90 |
5% |
| Wastewater | 578 | 24% | 435 |
23% |
| Water | 873 | 36% | 717 |
37% |
| Design and planning | 33 | 1% | 12 |
1% |
| Storm water | 2 | 0% | 0.23 |
0% |
| Wastewater | 24 | 1% | 9 |
0% |
| Water | 7 | 0% | 3 |
0% |
| Separation and sewer overflow control | 47 | 2% | 54 |
3% |
| Storm water | 11 | 0% | 9 |
0% |
| Wastewater | 36 | 2% | 45 |
2% |
| System optimization and improved asset management | 309 | 13% | 75 | 4% |
| Storm water | 80 | 3% | 27 |
1% |
| Wastewater | 104 | 4% | 23 | 1% |
|
Water |
125 |
5% |
24 |
1% |
| Grand Total (all categories) | 2,394 | 100% | 1,920 | 100% |
Source: INFC Financial Report, April 3, 2019.
5.2 Progress Towards Expected Outcomes
The evaluation looked at the extent to which CWWF-funded projects were contributing to progress towards the program’s expected results. The findings in this section are based on CWWF’s outcomes and indicators identified in its performance information profile (PIP). The assessment was conducted by looking at the indicators and the data sources identified in the PIP. The data sources are the IFR and provincial and territorial program outcome reports. A mapping of the findings related to progress towards outcomes and indicators as outlined in the PIP can be found in Annex A.
Finding 2: Communities benefitted from incremental funding
As a result of CWWF funding, Canadian communities benefitted from $1.9 billion in federal funding for drinking water, wastewater and storm water. The federal portion of CWWF funding represents more than 10% of the over $18 billion total invested in water and wastewater infrastructure from 2016 to 2018 in CanadaFootnote 5.
By March 31, 2019, 388 drinking water, 222 wastewater, and 139 storm water projects had been completed under CWWF.
Finding 3: CWWF has made progress towards wastewater treatment infrastructure meeting federal regulatory requirements.
As seen in Table 4, out of the 33 approved projects for upgrades to wastewater treatment infrastructure to meet federal regulatory requirements, six were completed as of March 31, 2019.
| Province/Territory | Number of Approved Projects | Number of Completed Projects |
|---|---|---|
| Newfoundland and Labrador | 1 | 0 |
| Prince Edward Island | 2 | 0 |
| New Brunswick | 3 | 1 |
| Quebec | 1 | 0 |
| Ontario | 13 | 0 |
| Manitoba | 2 | 1 |
| British Columbia | 6 | 3 |
| Northwest Territories | 5 | 1 |
| Total | 33 | 6 |
Source: INFC Financial Report, April 3, 2019.
As per outcome reports, six water treatment plans and studies as well as 15 wastewater treatment plans and studies were completed as of March 31, 2019 in four provinces and one territory. Five early works projects were reported in two provinces to lay the foundation for future wastewater and storm water system expansion, while 20 early works projects were reported, laying foundation for future drinking water system expansion, in two provinces and one territory.
Finding 4: CWWF made progress towards system optimization and improved asset management.
Of the 309 projects that supported system optimization and improved asset management (125 for drinking water, 104 for wastewater and 80 for storm water), 66 were completed by March 31, 2019.
These projects were intended to better optimize assets for improved quality and efficiency by increasing energy savings, decreasing unplanned service interruptions, water leakage and/or infiltration and laying the foundation for future drinking water, wastewater and storm water system expansion.
It is not possible to compare progress against national targets associated with indicators related to system optimization and improved asset management as there are none. As of March 31, 2019, however, provinces and territories reported on their achievements towards system optimization and improved asset management as followsFootnote 6:
- Total estimated kilowatt-hours saved as a result of funded projects (kWh per year used)
- Ontario: 60.6 million
- British Columbia: 0.2 million
- Average percentage in decrease unplanned service interruptions per month (not related to weather)
- Ontario: 97.3%
- Yukon: 7%
- Average decrease in volume of water leakage and/or infiltration attributable to funding
- British Columbia: 498 m3/day
- Laying the foundation for future drinking water system expansion (early works projects)
- Newfoundland and Labrador: 1
- British Columbia: 5
- Laying the foundation for future wastewater and storm water system expansion (early works projects)
- Manitoba: 1
- British Columbia: 4
Finding 5: CWWF made progress towards the rehabilitation of water, wastewater and storm water infrastructure.
As seen in Table 5, 1,701 CWWF funded projects led to the rehabilitation of water, wastewater and storm water infrastructure across the provinces and territories.
| Province/Territory | Number of Approved Projects | Number of Completed Projects | Percent of Completed Projects |
|---|---|---|---|
| Alberta | 50 | 0 | 0% |
| British Columbia | 116 | 33 | 28% |
| Manitoba | 28 | 19 | 68% |
| New Brunswick | 74 | 27 | 36% |
| Newfoundland and Labrador | 103 | 39 | 38% |
| Nova Scotia | 49 | 18 | 37% |
| Northwest Territories | 18 | 1 | 6% |
| Nunavut | 3 | 0 | 0% |
| Ontario | 994 | 312 | 31% |
| Prince Edward Island | 31 | 2 | 6% |
| Quebec | 151 | 92 | 61% |
| Saskatchewan | 64 | 29 | 45% |
| Yukon | 20 | 3 | 15% |
| Total | 1,701 | 575 | 34% |
Source: INFC Financial Report April 3, 2019.
Rehabilitation projects under CWWF aimed to increase assets’ physical condition rating, extend the average number of years of useful life remaining on assets, improve the quality of drinking water and wastewater treatment, meet or exceed applicable regulations, or eliminate boil water advisories for drinking water systems. Table 6 illustrates results from outcomes reports as of March 31,2019.
| Purpose | Results from outcome reports |
|---|---|
|
Asset physical condition rating |
Two provinces and one territory reported that the percentage of assets that have increased their physical condition rating because of funding was 26% at the lower end case and 100% in another. |
|
Extension of average number of years of useful life remaining on applicable water, wastewater, and storm water assets. |
Reports from eight provinces and territories showed a useful life extension of between 36 and 100 years for water treatment and distribution components, between 26.7 and 75 years for wastewater treatment and collection components and between 24 and 60 years for storm water components. |
|
Improving the quality of drinking water and wastewater treatment. |
71 water treatment systems reported having improved water quality as a result of funded projects in eight provinces and two territories. Four provinces reported improving 14 wastewater systems by level of treatment as followsFootnote 7:
|
|
Meeting or exceeding applicable regulations of water and wastewater treatment systems. |
83 water treatment systems have met or exceeded applicable guidelines because of funding in six provinces and two territories. 61 wastewater treatment systems have met or exceeded applicable regulations as a result of funding in 7 provinces. |
|
Eliminating boil water advisory for drinking water systems. |
Four provinces reported having eliminated existing boil water advisories linked to 11 drinking water systems through CWWF funding. |
Source: Outcome Reports as of March 31, 2019.
Finding 6: CWWF made progress towards sewer separation and sewer overflow control.
As seen in Figure 2, 47 projects were approved in the funding category of separation of existing combined sewers and/or combined sewer overflow control. Of these 47 projects, 36 were for wastewater and 11 for storm water. As of March 31, 2019, a total of 23 projects were completed: 19 wastewater and 4 storm water.
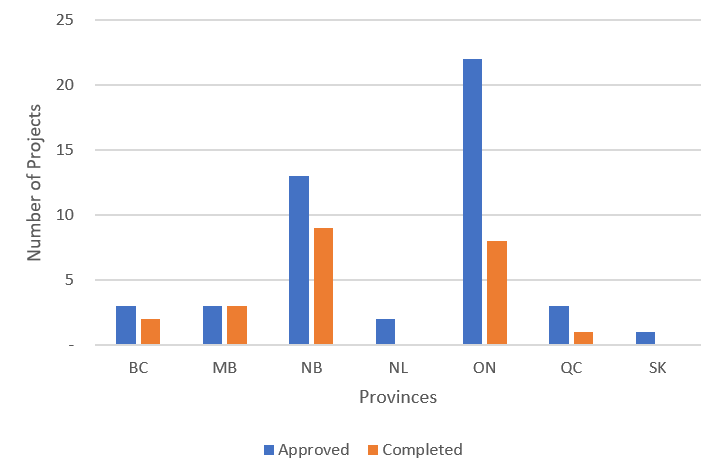
Description of Figure 2: Separation of Existing Combined Sewers and/or Combined Sewer Overflow Control by PT Reporting
This figure represents the number of approved and completed in the funding category of approved in the funding category of sewers and/or combined sewer overflow control. The distribution is as follows:
- British Columbia 3 approved 2 completed
- Manitoba 3 approved 3 completed
- New Brunswick 13 approved 9 completed
- Newfoundland 2 approved 0 completed
- Ontario 22 approved 8 completed
- Quebec 3 approved 1 completed
- Saskatchewan 1 approved 0 completed
Source: INFC Financial Report, April 3, 2019.
According to the literature review, during periods of heavy precipitation, overflows caused by overloading combined sewer collection systems may result in the direct discharge of raw sewage into surface watersFootnote 8. Separating previously combined sewers or combined sewer overflow controls also contributes to reducing or eliminating basement and street flooding, as well as sanitary discharges that cause pollutionFootnote 9.
Nine provinces and one territory reported a total of 74 systems that have improved the quality of wastewater effluent or storm water discharge as a result of funding; which represent 17.3% of 428 wastewater systems that needed to be upgraded in Canada, in 2016.Footnote 10
5.3 Inclusivity
The 2016 Directive on Results requires evaluators to consider government-wide policy commitments, including Gender-based Analysis Plus (GBA+)Footnote 11. CWWF met the government’s Gender-based Analysis requirements in its development and implementation.
The evaluation went beyond assessing the extent to which CWWF met the requirements for GBA+ in program development and implementation, to examine program results and external data through an inclusiveness lens more broadly. The intention of this analysis was not to draw conclusions on the relevance or effectiveness of CWWF, but rather to use available data to identify potential areas to consider in the development of future infrastructure programming. The analysis was conducted in keeping with the spirit of GBA+ to “assess how diverse groups of people may experience government programs”,Footnote 12 and should be considered supplemental to the evaluation of CWWF.
This supplementary analysis looked at whether there was greater need for drinking water infrastructure for Indigenous peoples in Canada living off-reserveFootnote 13 than the general population, and whether CWWF funding addressed areas in greatest need of drinking water infrastructure. Data from the 2016 CCPI survey on drinking water advisories and CWWF project location data was used. Of the 654 locations that received CWWF funding, 529 of them had available drinking water advisory data from CCPI and 163 of the project locations reported at least 1 drinking water advisory.
CWWF project locations were analyzed based on two factors: drinking water advisories and the proportion of the location’s population that identifies as Indigenous. A population was considered to have a high Indigenous population if more than 7.6% of the population self-identifies as Indigenous, a medium Indigenous population if this is between 2% and 7.6%, and a low Indigenous population if below 2%Footnote 14.
Finding 7: When looking at drinking water advisories and Indigenous populations off-reserve, the need for water infrastructure was not always targeted through provincial distribution of CWWF funding
As seen in Table 7, at the national level, there was no significant difference in the reporting of drinking water advisories based on the proportion of the population identifying as Indigenous when looking at all CWWF project locations.
| CWWF Project Data | High Indigenous Population | Medium Indigenous Population | Low Indigenous Population |
|---|---|---|---|
| CANADA | |||
| Percent of CWWF project locations with at least one drinking water advisory | 30.8% | 28.9% | 33.8% |
| Percent of CWWF project locations with drinking water advisory > 15 days | 3.9% | 3.4 % | 5.6% |
Source: INFC Financial Report April 3, 2019 and Canada’s Core Public Infrastructure Survey 2016.
In order to look at whether CWWF funding was distributed by provinces and territories to ultimate recipients in a way that would address drinking water needs in locations with a high Indigenous population off-reserve, an analysis by province was conducted.
The supplemental GBA+ analysis compared rates of drinking water advisories by location, with CWWF project location data. This comparison can identify whether areas that received CWWF funding had higher rates of drinking water advisories. When looking at drinking water advisories and Indigenous populations off-reserve by province, it was found that CWWF funding was not always distributed by provinces to locations with the highest reported rates of drinking water advisories.
While there were no requirements under CWWF to target these locations for drinking water funding, future programming terms and conditions could take into consideration the location of drinking water advisories and of Indigenous populations off-reserve in order to better align funding to need.
6.0 Conclusions
The evaluation found that overall CWWF met the needs of Canadians for drinking water, wastewater and storm water infrastructure.
CWWF has made progress towards its expected outcomes. The extent to which progress has been made is not possible to assess due to a lack of information from provincial and territorial progress outcome reports and an absence of targets related to the program indicators.
Based on the supplemental GBA+ analysis, future drinking water programming terms and conditions could take into consideration the location of drinking water advisories and of Indigenous populations off-reserve in order to better align funding to need.
The evaluation has no recommendations as issues identified with the program’s performance measurement are being addressed through the Investing in Canada Infrastructure Program’s performance measurement strategy.
Annex A: Mapping of CWWF outcomes, indicators and themeFootnote 15
| Outcome | Indicator | Themes |
|---|---|---|
|
To what extent has CWWF made progress towards its immediate outcome of cost-shared water and wastewater projects are completedFootnote * |
Cost-shared water and wastewater projects that are completed by sub-categoryFootnote * |
Finding 2: Communities benefit from incremental funding |
|
Communities’ benefit from incremental fundingFootnote * |
Increase in total actual spending relative to baseline of originally planned capital expenditures, as a result of federal fundingFootnote * |
|
|
Percent of attestations to incrementality received from recipientsFootnote * |
||
|
Cost-shared designs and plans for water and wastewater systems to meet or exceed applicable regulations and guidelines are completedFootnote * |
Cost-shared plans and designs that are completedFootnote * |
Finding 3: CWWF has made progress towards to wastewater treatment infrastructure being able to meet federal regulatory requirements |
|
Plans and designs for water and wastewater treatment facilities to meet or exceed applicable guidelines and regulations are advanced or being implementedFootnote ** |
Number of funded plans and studies that have resulted in identified capital projects that are either included in capital planning documents with associated funding or that are in the process of being implemented.Footnote ** |
|
|
Funding in water, wastewater, and storm water systems have improved the reliability of drinking water, wastewater effluent and storm water dischargeFootnote ** |
Average percentage decrease in unplanned service interruptions per month (not related to weather)Footnote ** |
Finding 4: CWWF made progress towards system optimization and improved asset management |
|
Average decrease in volume of water leakage and/or infiltration that can be attributed to funded fundingFootnote ** |
||
|
Funding in water, wastewater, and storm water systems have increased their efficiencyFootnote ** |
Average Life Cycle Cost of applicable water, wastewater and storm water systems after end of constructionFootnote ** |
|
|
Total estimated kilowatt-hours saved as a result of fundingFootnote ** |
||
|
To what extent has CWWF made progress towards its final outcome of funding in wastewater and storm water systems support a cleaner and healthier environment for communitiesFootnote *** |
Number of early works projects that lay the foundation for future wastewater and storm water system expansionFootnote *** |
|
|
Communities have access to safe waterFootnote *** |
||
|
To what extent has CWWF made progress towards its intermediate outcome of funding that has contributed to the rehabilitation of water, wastewater and storm water systemsFootnote ** |
Percentage of assets that have increased their physical condition rating (as per reporting guideline) as a result of fundingFootnote ** |
Finding 5: CWWF made progress towards the rehabilitation of water, wastewater and storm water infrastructure |
|
Average number of years of useful life remaining on applicable water, wastewater and storm water assets, extended as a result of fundingFootnote ** |
||
|
To what extent has CWWF made progress towards its final outcome of funding in wastewater and storm water systems to support a cleaner and healthier environment for communitiesFootnote *** |
Number of applicable wastewater systems by treatment level (no treatment, Primary. Secondary, Tertiary)Footnote *** |
|
|
Number of wastewater treatment systems that have met or exceeded applicable regulations as a result of fundingFootnote *** |
||
|
Communities have access to safe waterFootnote *** |
Number of drinking water systems that have eliminated a boil water advisory as a result of fundingFootnote *** |
|
|
Number of water treatment systems that have met or exceeded applicable guidelines as a result of fundingFootnote *** |
||
|
Number of water treatment systems that have improved water quality as a result of fundingFootnote *** |
||
|
To what extent has CWWF made progress towards its final outcome of funding in wastewater and storm water systems support a cleaner and healthier environment for communitiesFootnote *** |
Number of systems that have improved the quality of wastewater effluent or storm water discharge as a result of fundingFootnote *** |
Finding 6: CWWF made progress towards sewer separation and sewer overflow control |
Annex B: Results Matrix
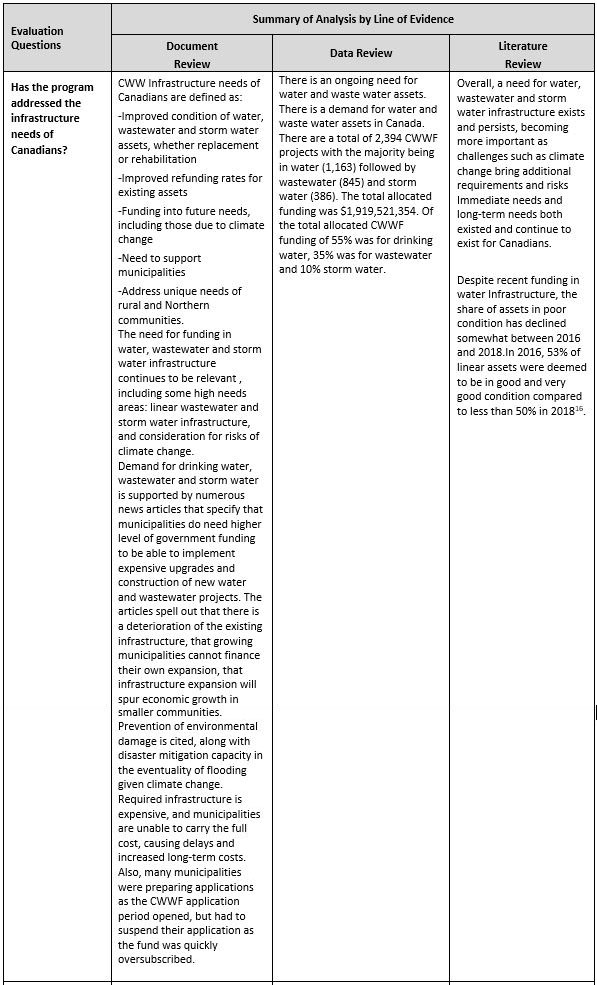
Description of figure 3: Evaluation Question - Has the program addressed the infrastructure needs of Canadians?
Summary of Analysis by Line of Evidence
Document Review
CWW Infrastructure needs of Canadians are defined as:
- Improved condition of water, wastewater and storm water assets, whether replacement or rehabilitation
- Improved refunding rates for existing assets
- Funding into future needs, including those due to climate change
- Need to support municipalities
- Address unique needs of rural and Northern communities.
The need for funding in water, wastewater and storm water infrastructure continues to be relevant , including some high needs areas: linear wastewater and storm water infrastructure, and consideration for risks of climate change.
Demand for drinking water, wastewater and storm water is supported by numerous news articles that specify that municipalities do need higher level of government funding to be able to implement expensive upgrades and construction of new water and wastewater projects. The articles spell out that there is a deterioration of the existing infrastructure, that growing municipalities cannot finance their own expansion, that infrastructure expansion will spur economic growth in smaller communities. Prevention of environmental damage is cited, along with disaster mitigation capacity in the eventuality of flooding given climate change. Required infrastructure is expensive, and municipalities are unable to carry the full cost, causing delays and increased long-term costs. Also, many municipalities were preparing applications as the CWWF application period opened, but had to suspend their application as the fund was quickly oversubscribed.
Data Review
There is an ongoing need for water and waste water assets. There is a demand for water and waste water assets in Canada. There are a total of 2,394 CWWF projects with the majority being in water (1,163) followed by wastewater (845) and storm water (386). The total allocated funding was $1,919,521,354. Of the total allocated CWWF funding of 55% was for drinking water, 35% was for wastewater and 10% storm water.
Literature Review
Overall, a need for water, wastewater and storm water infrastructure exists and persists, becoming more important as challenges such as climate change bring additional requirements and risks Immediate needs and long-term needs both existed and continue to exist for Canadians.
Despite recent funding in water Infrastructure, the share of assets in poor condition has declined somewhat between 2016 and 2018.In 2016, 53% of linear assets were deemed to be in good and very good condition compared to less than 50% in 2018Footnote 16.
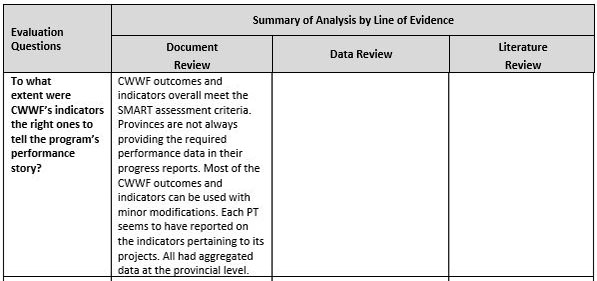
Description of figure 4: Evaluation Question - To what extent were CWWF’s indicators the right ones to tell the program’s performance story?
Summary of Analysis by Line of Evidence
Document Review
CWWF outcomes and indicators overall meet the SMART assessment criteria. Provinces are not always providing the required performance data in their progress reports. Most of the CWWF outcomes and indicators can be used with minor modifications. Each PT seems to have reported on the indicators pertaining to its projects. All had aggregated data at the provincial level.
Data Review
N/A
Literature Review
N/A
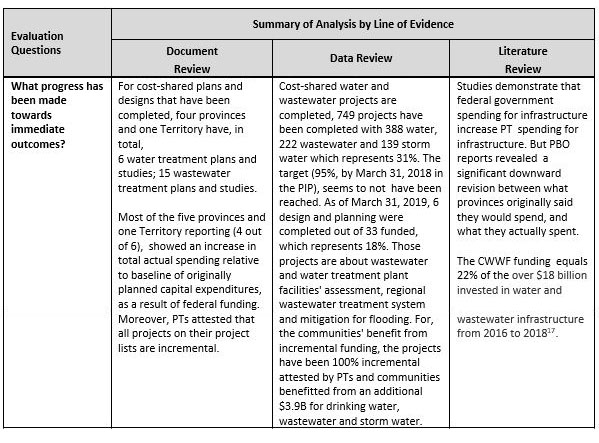
Description of figure 5: Evaluation Question - What progress has been made towards immediate outcomes?
Summary of Analysis by Line of Evidence
Document Review
For cost-shared plans and designs that have been completed, four provinces and one Territory have, in total, 6 water treatment plans and studies; 15 wastewater treatment plans and studies.
Most of the five provinces and one Territory reporting (4 out of 6), showed an increase in total actual spending relative to baseline of originally planned capital expenditures, as a result of federal funding. Moreover, PTs attested that all projects on their project lists are incremental.
Data Review
Cost-shared water and wastewater projects are completed, 749 projects have been completed with 388 water, 222 wastewater and 139 storm water which represents 31%. The target (95%, by March 31, 2018 in the PIP), seems to not have been reached. As of March 31, 2019, 6 design and planning were completed out of 33 funded, which represents 18%. Those projects are about wastewater and water treatment plant facilities' assessment, regional wastewater treatment system and mitigation for flooding. For, the communities' benefit from incremental funding, the projects have been 100% incremental attested by PTs and communities benefitted from an additional $3.9B for drinking water, wastewater and storm water.
Literature Review
Studies demonstrate that federal government spending for infrastructure increase PT spending for infrastructure. But PBO reports revealed a significant downward revision between what provinces originally said they would spend, and what they actually spent.
The CWWF funding equals 22% of the over $18 billion invested in water and wastewater infrastructure from 2016 to 2018Footnote 17.
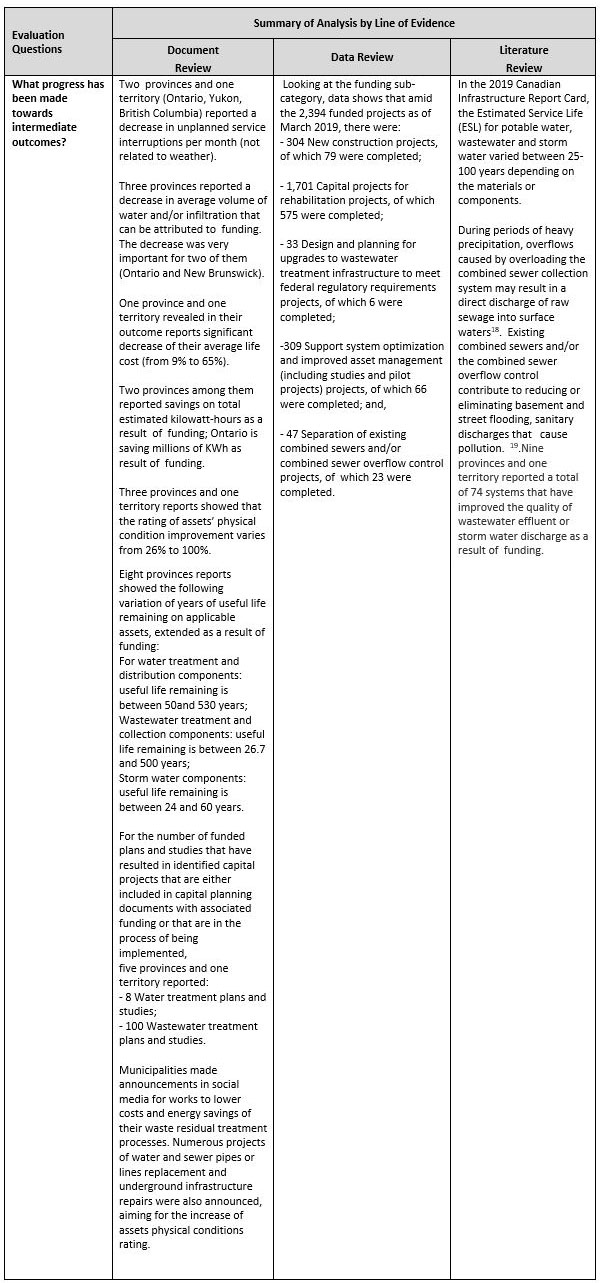
Description of figure 6: Evaluation Question - What progress has been made towards intermediate outcomes?
Summary of Analysis by Line of Evidence
Document Review
Two provinces and one territory (Ontario, Yukon, British Columbia) reported a decrease in unplanned service interruptions per month (not related to weather).
Three provinces reported a decrease in average volume of water and/or infiltration that can be attributed to funding. The decrease was very important for two of them (Ontario and New Brunswick).
One province and one territory revealed in their outcome reports significant decrease of their average life cost (from 9% to 65%).
Two provinces among them reported savings on total estimated kilowatt-hours as a result of funding; Ontario is saving millions of KWh as result of funding.
Three provinces and one territory reports showed that the rating of assets’ physical condition improvement varies from 26% to 100%.
Eight provinces reports showed the following variation of years of useful life remaining on applicable assets, extended as a result of funding:
- For water treatment and distribution components: useful life remaining is between 50 and 530 years;
- Wastewater treatment and collection components: useful life remaining is between 26.7 and 500 years;
- Storm water components: useful life remaining is between 24 and 60 years.
For the number of funded plans and studies that have resulted in identified capital projects that are either included in capital planning documents with associated funding or that are in the process of being implemented, five provinces and one territory reported:
- 8 Water treatment plans and studies;
- 100 Wastewater treatment plans and studies.
Municipalities made announcements in social media for works to lower costs and energy savings of their waste residual treatment processes. Numerous projects of water and sewer pipes or lines replacement and underground infrastructure repairs were also announced, aiming for the increase of assets physical conditions rating.
Data Review
Looking at the funding sub-category, data shows that amid the 2,394 funded projects as of March 2019, there were:
- 304 New construction projects, of which 79 were completed;
- 1,701 Capital projects for rehabilitation projects, of which 575 were completed;
- 33 Design and planning for upgrades to wastewater treatment infrastructure to meet federal regulatory requirements projects, of which 6 were completed;
- 309 Support system optimization and improved asset management (including studies and pilot projects) projects, ofwhich 66 were completed; and,
- 47 Separation of existing combined sewers and/or combined sewer overflow control projects, of which 23 were completed.
Literature Review
In the 2019 Canadian Infrastructure Report Card, the Estimated Service Life (ESL) for potable water, wastewater and storm water varied between 25-100 years depending on the materials or components.
During periods of heavy precipitation, overflows caused by overloading the combined sewer collection system may result in a direct discharge of raw sewage into surface watersFootnote 18. Existing combined sewers and/or the combined sewer overflow control contribute to reducing or eliminating basement and street flooding, sanitary discharges that cause pollution. Footnote 19.Nine provinces and one territory reported a total of 74 systems that have improved the quality of wastewater effluent or storm water discharge as a result of funding.
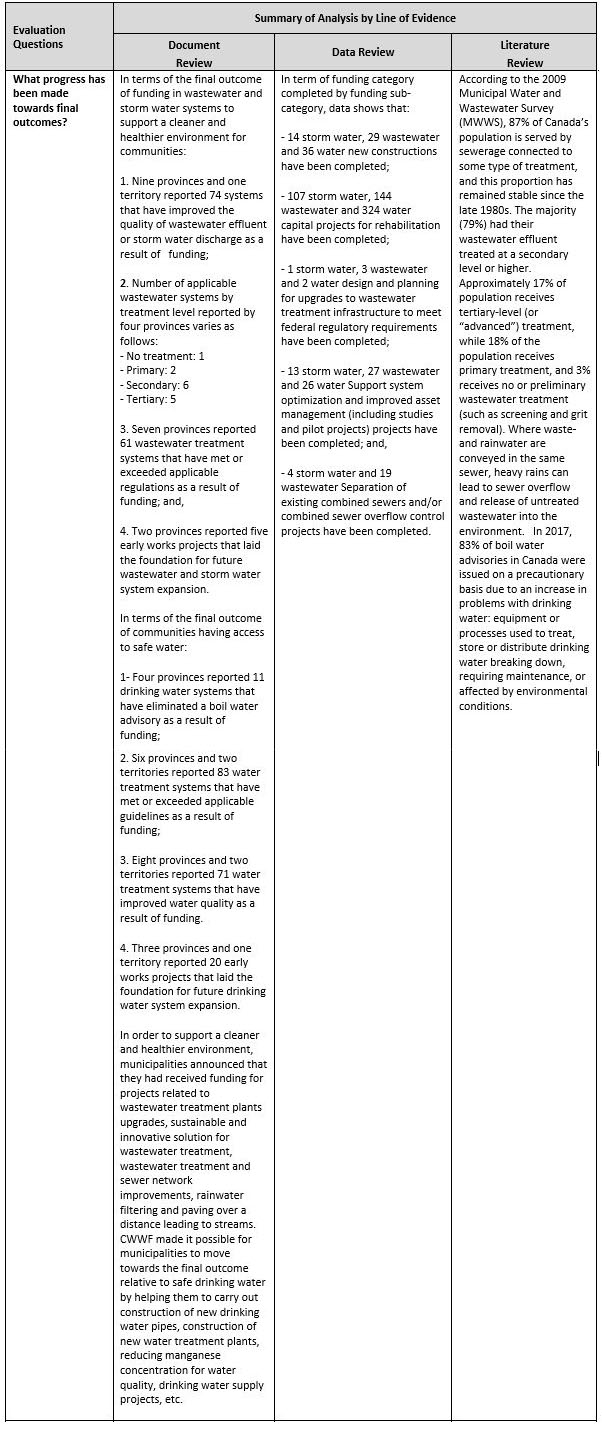
Description of figure 7: Evaluation Question - What progress has been made towards final outcomes?
Summary of Analysis by Line of Evidence
Document Review
In terms of the final outcome of funding in wastewater and storm water systems to support a cleaner and healthier environment for communities:
1. Nine provinces and one territory reported 74 systems that have improved the quality of wastewater effluent or storm water discharge as a result of funding;
Number of applicable wastewater systems by treatment level reported by four provinces varies as follows:
- No treatment: 1
- Primary: 2
- Secondary: 6
- Tertiary: 5
3. Seven provinces reported 61 wastewater treatment systems that have met or exceeded applicable regulations as a result of funding; and,
4. Two provinces reported five early works projects that laid the foundation for future wastewater and storm water system expansion.
In terms of the final outcome of communities having access to safe water:
- Four provinces reported 11 drinking water systems that have eliminated a boil water advisory as a result of funding;
- Six provinces and two territories reported 83 water treatment systems that have met or exceeded applicable guidelines as a result of funding;
- Eight provinces and two territories reported 71 water treatment systems that have improved water quality as a result of funding.
- Three provinces and one territory reported 20 early works projects that laid the foundation for future drinking water system expansion.
In order to support a cleaner and healthier environment, municipalities announced that they had received funding for projects related to wastewater treatment plants upgrades, sustainable and innovative solution for wastewater treatment, wastewater treatment and sewer network improvements, rainwater filtering and paving over a distance leading to streams. CWWF made it possible for municipalities to move towards the final outcome relative to safe drinking water by helping them to carry out construction of new drinking water pipes, construction of new water treatment plants, reducing manganese concentration for water quality, drinking water supply projects, etc.
Data Review
In term of funding category completed by funding sub-category, data shows that:
- 14 storm water, 29 wastewater and 36 water new constructions have been completed;
- 107 storm water, 144 wastewater and 324 water capital projects for rehabilitation have been completed;
- 1 storm water, 3 wastewater and 2 water design and planning for upgrades to wastewater treatment infrastructure to meet federal regulatory requirements have been completed;
- 13 storm water, 27 wastewater and 26 water Support system optimization and improved asset management (including studies and pilot projects) projects have been completed; and,
- 4 storm water and 19 wastewater Separation of existing combined sewers and/or combined sewer overflow control projects have been completed.
Literature Review
According to the 2009 Municipal Water and Wastewater Survey (MWWS), 87% of Canada’s population is served by sewerage connected to some type of treatment, and this proportion has remained stable since the late 1980s. The majority (79%) had their wastewater effluent treated at a secondary level or higher. Approximately 17% of population receives tertiary-level (or “advanced”) treatment, while 18% of the population receives primary treatment, and 3% receives no or preliminary wastewater treatment (such as screening and grit removal). Where waste- and rainwater are conveyed in the same sewer, heavy rains can lead to sewer overflow and release of untreated wastewater into the environment. In 2017, 83% of boil water advisories in Canada were issued on a precautionary basis due to an increase in problems with drinking water: equipment or processes used to treat, store or distribute drinking water breaking down, requiring maintenance, or affected by environmental conditions.
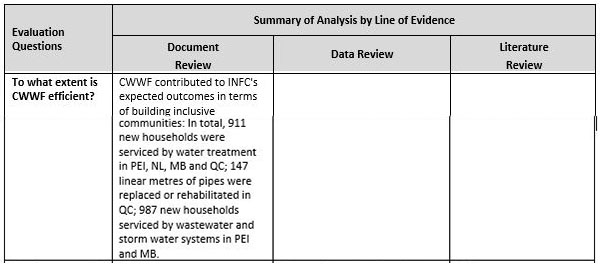
Description of figure 8: Evaluation Question - To what extent is CWWF efficient?
Summary of Analysis by Line of Evidence
Document Review
CWWF contributed to INFC's expected outcomes in terms of building inclusive communities: In total, 911 new households were serviced by water treatment in PEI, NL, MB and QC; 147 linear metres of pipes were replaced or rehabilitated in QC; 987 new households serviced by wastewater and storm water systems in PEI and MB.
Data Review
N/A
Literature Review
N/A
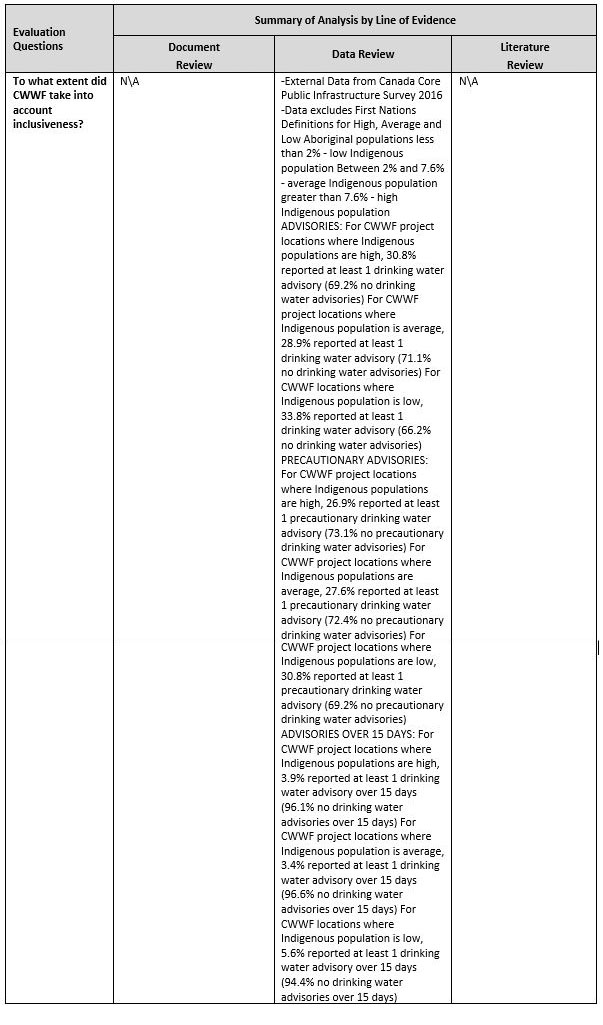
Description of figure 9: Evaluation Question - To what extent did CWWF take into account inclusiveness?
Summary of Analysis by Line of Evidence
Document Review
N\A
Data Review
- External Data from Canada Core Public Infrastructure Survey 2016
- Data excludes First Nations Definitions for High, Average and Low Aboriginal populations less than 2% - low Indigenous population Between 2% and 7.6% average Indigenous population greater than 7.6% - high Indigenous population
ADVISORIES:
For CWWF project locations where Indigenous populations are high, 30.8% reported at least 1 drinking water advisory (69.2% no drinking water advisories)
For CWWF project locations where Indigenous population is average, 28.9% reported at least 1 drinking water advisory (71.1% no drinking water advisories)
For CWWF locations where Indigenous population is low, 33.8% reported at least 1 drinking water advisory (66.2% no drinking water advisories)
PRECAUTIONARY ADVISORIES:
For CWWF project locations where Indigenous populations are high, 26.9% reported at least 1 precautionary drinking water advisory (73.1% no precautionary drinking water advisories)
For CWWF project locations where Indigenous populations are average, 27.6% reported at least 1 precautionary drinking water advisory (72.4% no precautionary drinking water advisories)
For CWWF project locations where Indigenous populations are low, 30.8% reported at least 1 precautionary drinking water advisory (69.2% no precautionary drinking water advisories)
ADVISORIES OVER 15 DAYS:
For CWWF project locations where Indigenous populations are high, 3.9% reported at least 1 drinking water advisory over 15 days (96.1% no drinking water advisories over 15 days)
For CWWF project locations where Indigenous population is average, 3.4% reported at least 1 drinking water advisory over 15 days (96.6% no drinking water advisories over 15 days)
For CWWF locations where Indigenous population is low, 5.6% reported at least 1 drinking water advisory over 15 days (94.4% no drinking water advisories over 15 days)
Literature Review
N\A
Report a problem on this page
- Date modified: