
The National Shelter Study - Emergency shelter use in Canada 2005 to 2016
The National Shelter Study - Emergency shelter use in Canada 2005 to 2016
On this page
- List of abbreviations
- List of tables
- List of figures
- List of equations
- Acknowledgements
- Author and principal investigators
- Abstract
- Executive summary
- Introduction
- Methods
- Analysis
- Summary and conclusion
- References
- Glossary
- Annexe A: The Homeless Individuals and Families Information System (HIFIS)
Alternate formats

The National Shelter Study - Emergency shelter use in Canada 2005 to 2016 [PDF - 2.27 MB]
Request other formats online or call 1 800 O-Canada (1-800-622-6232). If you use a teletypewriter (TTY), call 1-800-926-9105. Large print, braille, audio cassette, audio CD, e-text diskette, e-text CD and DAISY are available on demand.
List of abbreviations
- ESDC
- Employment and Social Development Canada
- fpc
- Finite population correction factor
- HIFIS
- Homeless Individuals and Families Information System
- PiT count
- Point-in-Time Count
- PPS
- Probability proportional to size
List of tables
- Table 1: Number of shelters and observations for each year of the study
- Table 2: List of sample strata (2016)
- Table 3: Estimated annual number of unique individuals using emergency shelters and prevalence of emergency shelter use per 10,000
- Table 4: Average age by gender (excluding children, 2016)
- Table 5: Percentage of stays by youth at different shelter types by gender (2016)
- Table 6: Estimated number of Indigenous shelter users (2014 to 2016)
- Table 7: Estimated number of shelter users by citizenship status (2016)
List of figures
- Figure 1: National shelter occupancy rate (2005 to 2016)
- Figure 2: Bednights used and estimated unique shelter users by year (2005 to 2016)
- Figure 3: Typical number of days in shelter over a one-year period (2010 to 2016)
- Figure 4: Percentage of short, medium and long stays by year (2005 to 2016)
- Figure 5: Gender distribution of shelter users (2016)
- Figure 6: Shelter use by gender and by age group (2016)
- Figure 7: Distribution of shelter users by age group (2016)
- Figure 8: Estimated number of annual shelter users by age group (2005 to 2016)
- Figure 9: Rate of shelter use by age (2005, 2010, 2016)
- Figure 10: Number of adults (25 to 49) using emergency shelters annually (and percentage of total shelter users) (2005 to 2016)
- Figure 11: Number of youth using emergency shelters annually (an percentage of total shelter users) (2005 to 2016)
- Figure 12: Changes in the age distribution of youth (2005 to 2016)
- Figure 13: Number of older adults (50 to 64) using shelters annually (and percentage of total shelter users) (2005 to 2016)
- Figure 14: Number of seniors (65+) using shelters annually (and percentage of total shelter users) (2005 to 2016)
- Figure 15: Annual number of children using emergency shelters (and percentage of total shelter users) (2005 to 2016)
- Figure 16: Annual number of children using emergency shelters (and number of family beds) (2005 to 2016)
- Figure 17: Average occupancy rate at family shelters (2005 to 2016)
- Figure 18: Stay length at family shelters (2006 to 2016)
- Figure 19: Average occupancy rate at youth shelters (2005 to 2016)
- Figure 20: Stay Length at youth shelters (2005 to 2016)
- Figure 21: Average occupancy rate at general shelters (2005 to 2016)
- Figure 22: Stay length at general shelters (2005 to 2016)
- Figure 23: Gender distribution of shelter users by Indigenous identity (2016)
- Figure 24: Proportion of shelters users by Indigenous identity and age (2016)
- Figure 25: Rate of shelter use for Indigenous compared to non-Indigenous people (2016)
- Figure 26: Percentage of Indigenous shelter users vs percentage of Indigenous population, by region (2016)
- Figure 27 A: Age distribution for males and females, by military service status (2016)
- Figure 27 B: Age distribution for female, by military service status (2016)
List of equations
- Equation 1: Calculation of probability proportional to size
- Equation 2: Calculation of client weight
- Equation 3: Calculation of shelter-level weight for sampled shelters
- Equation 4: Calculation of stratum-level duplication factor
- Equation 5: Calculation of shelter-level duplication factor
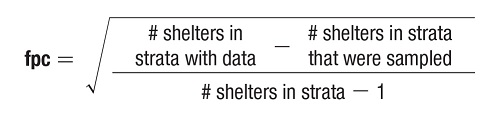
- Equation 6: Calculation of the finite population correction factor
Acknowledgements
This study has been compiled by the Homelessness Policy Directorate, Income Security and Social Development Branch, Employment and Social Development Canada.
We would like to acknowledge the collaboration and efforts of the Province of Alberta, BC Housing, the City of Toronto, the region of Peel and each of the service providers that contributed data used in this report. Through this collaborative effort, we are able to advance our collective understanding of homelessness in Canada and support decision making, and the development of policies and programs to prevent and reduce homelessness.
We also would like to thank shelter staff for collecting the data, as well as shelter users for agreeing to share their information.
Author and principal investigators
Annie Duchesne, Analyst
Dr. Ian Cooper, Manager
Nancy Baker, Director
Abstract
The National Shelter Study is an ongoing analysis of emergency shelter trends in Canada. It is the most comprehensive national-level study of homelessness in Canada and is important for understanding changing trends over time. There are over 15,400 emergency shelter beds distributed in more than 400 emergency shelters across Canada. This study is based on data collected from over 200 shelters across Canada, most of which use the Homeless Individuals and Families Information System (HIFIS). It updates the National Shelter Study 2005 to 2014 with new data from 2015 and 2016. While the study shows an ongoing decrease in the number of individuals and families using shelters per year, the national occupancy rate remains above 90% as a result of longer shelter stays. The findings also show an ongoing over-representation in shelters of people who identify as Indigenous.
Executive summary
The National Shelter Study is an ongoing analysis of emergency shelter trends in Canada. This report is the third analysis of national emergency shelter data. The first study was published in 2013 and covered the period from 2005 to 2009. This was updated in 2016 and extended the timeframe of the analysis from 2005 to 2014. The current report updates and extends findings to include data from 2015 and 2016.
The National Shelter Study is the most comprehensive national-level study of homelessness in Canada and is important for understanding changing trends over time. Emergency shelter use is a strong indicator for homelessness. However, it is important to note that emergency shelter use is an indicator of homelessness, and not a complete portrait.
Employment and Social Development Canada (ESDC) maintains a database of administrative shelter data obtained from emergency shelters using the Homeless Individuals and Families Information System (HIFIS). Similar data is obtained through data sharing agreements with the City of Toronto, Peel Region, Province of Alberta and BC Housing. This report is based on data from about 2.5 million shelter stays that occurred at over 200 of the approximately 400 emergency shelters across Canada between 2005 and 2016.
The National Shelter Study is conducted as part of Reaching Home: Canada's Homelessness Strategy, a community-based program aimed at preventing and reducing homelessness by providing direct support and funding to Designated Communities (urban centers), Indigenous communities, territorial communities and rural and remote communities across Canada.
Find more information about Reaching Home
For questions related to the information in this report, contact: HPD.RHInfo-infoVCS.DPMI@infc.gc.ca
Canada’s emergency shelter system is operating at over 90% capacity
In 2016 there were over 15,400 emergency shelter beds at about 400 emergency shelters across Canada (Employment and Social Development Canada, 2016). The number of shelters and beds remained relatively stable between 2005 and 2016, but demand for shelter beds increased. The average occupancy rate at Canada’s emergency shelters in 2016 was 91.0%, an increase of almost 10 percentage points since 2005. On an average night in 2016, just over 14,000 Canadians stayed in an emergency shelter.
- Average occupancy rate at emergency shelters in 2016: 91.0%
- Approximate number of Canadians who slept in an emergency shelter on an average night in 2016: 14,000
Fewer people are using shelters each year, but they are staying longer
The number of people using emergency shelters in Canada is declining. However, demand remains high as a result of longer stay lengths. There were an estimated 129,000 unique emergency shelter users in 2016. Although the annual number of shelter users has fallen from about 156,000 in 2005, emergency shelters served an average of nearly 1,000 more people per night in 2016 compared to 2005. Bednights measure the number of times a shelter bed is used in a year. In 2016 approximately 5.1 million bednights were used at emergency shelters in Canada, an increase of over 360,000 since 2005. Although fewer people were using shelters in 2016 than in 2005, they were using shelters for a longer period.
- Estimated number of Canadians who used an emergency shelter in 2016: 129,000
Stay lengths increased for all types of shelter users since 2005. Demand for shelter beds increased due to longer stays, especially by families and individuals aged 50 and over. In 2016, a typical shelter stay by a family was about 25 days, almost twice as long as stays by individuals. People over 50 years of age typically spent more total days in shelters than people under 50.
Family shelters continue to operate at high capacity
The average occupancy rate at family shelters was 85.7% in 2016, compared to 67.3% in 2005 —an increase of 18.4 percentage points. The high occupancy rate at family shelters in 2016 was driven by longer shelter stays by families. A typical stay at a family shelter increased from 8.3 days in 2005 to 24.9 days in 2016. Approximately 8,000 children accompanied by adults stayed in emergency shelters in 2016.
- Increase in occupancy rate at family shelters, 2005 to 2016: 18.4 percentage points
- Approximate number of children using emergency shelters annually: 8,000
The number of shelter users under the age of 50 is down, and the number of shelter users over the age of 50 is up
The age composition of the shelter-using population is changing. The number of youth and adults aged 25 to 49 using shelters is decreasing, while the number of adults aged 50 and over is increasing. While adults aged 25 to 49 make up the largest group of shelter users, there has been a 30.3% drop in shelter users in this age group between 2005 and 2016. This has contributed to the overall decrease in the number of annual shelter users. The number of unaccompanied youth aged 13 to 24 using shelters also decreased by 24.3%. In contrast, the number of shelter users aged 50 and over increased by 29.1%. Increase in shelter use was especially prominent for shelter users aged 65 and over (49.3% increase).
- Decrease in the number of emergency shelter users aged 25 to 49 from 2005 to 2016: -30.3%
- Increase in the number of emergency shelter users aged 50 and over from 2005 to 2016: +29.1%
Indigenous people remain over-represented in Canada’s emergency shelters
Indigenous people remain over-represented in Canada’s emergency shelters. While Indigenous people represented 4.9% of the Canadian population in 2016Footnote 1 (Statistics Canada, 2017a), as not everyone who experiences users that reported Indigenous identity was 30.7%. This varies widely by region, from less than 5% reporting Indigenous identity in some suburban communities to over 90% in many northern communities, which have larger Indigenous populations. In each of the communities where data are available, Indigenous people are over-represented in emergency shelters compared to the overall population.
- Percentage of emergency shelter users in 2016 who identified as Indigenous: 30.7%
- Percentage of Canadians in 2016 who identified as Indigenous: 4.9%
In 2016, over 2,300 shelter users reported having served in the military
In 2016, 1.8% of shelter users, an estimated 2,300 people, reported having served in the military. Emergency shelter users reporting military service were more likely to be male and tended to be older than other shelter users.
- Approximate number of shelter users reporting military service: 2,300 (1.8%)
In 2016, over 7,600 shelter users were non-citizens
An estimated 7,600 shelter users reported that they were not Canadian citizens, including approximately 5,000 permanent residents or immigrants, 2,000 refugees and 550 temporary residents (student, work or visitor visa). Non-citizens were under-represented in emergency shelters (5.9% of shelter users) compared to the overall population, where non-citizens made up 7.0% of the population in 2016 (Statistics Canada, 2017b).
- Estimated number of shelter users reporting that they were non-citizens: 7,600 (5.9%)
Introduction
The National Shelter Study is conducted by Employment and Social Development Canada as part of the Reaching Home program, a community-based program aimed at preventing and reducing homelessness by providing direct support and funding to Designated Communities (urban centers), Indigenous communities, territorial communities and rural and remote communities across Canada.
The National Shelter Study is an ongoing analysis of emergency shelter trends in Canada. This report is the third analysis of national emergency shelter data collected over time. The first study was published in 2013 and covered the period from 2005 to 2009. This information was updated in 2016 and extended the timeframe of the analysis from 2005 to 2014. The current report updates and extends findings to include data from 2015 and 2016.
The National Shelter Study is the most comprehensive national-level study of homelessness in Canada and is vital for understanding changing trends over time. It provides a descriptive account of the demographic characteristics of shelter users in Canada, the number of people using shelters, trends in the average shelter occupancy rate, bed use and the length of stay in shelter. While the study does not include those who experience homelessness outside of the emergency shelter system, it provides a baseline count and description of the homeless population in Canada against which future progress in preventing and reducing homelessness can be measured.
This report is based on data collected through the Homeless Individuals and Families Information System (HIFIS) and data sharing agreements with communities and service providers (see Annexe A). It includes anonymous information from approximately 2.5 million shelter stays that occurred at over 200 of the approximately 400 emergency shelters across Canada between 2005 and 2016.
Emergency shelter use as an indicator of homelessness trends
Homelessness is generally considered as the living situation of an individual or family who does not have stable, permanent, appropriate housing, or the immediate prospect, means and ability of acquiring it. It is often the result of what are known as systemic or societal barriers, including a lack of affordable and appropriate housing, the individual/household’s financial, mental, cognitive, behavioural or physical challenges, and/or racism and discrimination.
Homelessness takes many forms, from sleeping rough on the streets, in parks or abandoned buildings to couch surfing at the homes of friends and family, to sleeping in emergency shelters, or transitional housing. It can also encompass situations where people are housed but subject to inadequate, unstable or dangerous living arrangements. Some people experience homelessness for only a brief time in their lives, while others struggle with homelessness for many years. In the face of so many different experiences of homelessness, measurement presents many challenges.
A key challenge with measuring homelessness is defining the scope. In other words, who should be counted as homeless? Another major challenge results from the homeless population being diverse, mobile, and difficult to reach. Without a stable address or reliable means of contact, it is nearly impossible to use conventional sampling methodologies. Even if people experiencing homelessness were easy to reach, they make up such a small proportion of the population that a very large sample would be required to obtain enough cases for reliable analysis. There is also an additional temporal challenge. While some people are continuously homeless for long periods of time and others move in and out of homelessness, the majority experience homelessness only briefly and possibly only once in their lives, which makes it difficult to capture this group when the study has a short observation window.
The National Shelter Study examines emergency shelter use. To address the challenge of defining the scope of homelessness, emergency shelter use is assumed to be an indicator of absolute homelessnessFootnote 2. As for gaining access to the difficult-to-reach homeless population, emergency shelters serve as a well-defined and accessible point of contact, distributed widely across the country. To address temporal challenges, emergency shelter data can be collected over a long period to capture a wide range of homelessness experiences.
It is important to note that emergency shelter use is an indicator of homelessness, and not a complete portrait. Estimating the number of people using emergency shelters provides a “minimum number” of people who have experienced absolute homelessness over a specified period of time. In addition to providing a minimum count of homelessness, the National Shelter Study helps to understand demographic trends of the homeless population and identify groups that may be disproportionately affected by homelessness.
One limitation of the National Shelter Study is that it does not capture homelessness experienced outside of shelters, as not everyone witation of the National Shelter Study is that it does not capture homelessness experienced outside of shelters, as not everyone who experiences homelessness uses a shelter. Point in Time (PiT) Counts led by Employment and Social Development CanadaFootnote 3 provide a one-day snapshot of homelessness in a community, including people experiencing homelessness in shelters, unsheltered locations, and transitional housing. PiT counts also allow for an in-depth survey that can provide more detail about individual experiences of homelessness. However, this approach is based on a “snapshot” of homelessness at a given time and tends to over-represent the chronically homeless, who are more likely to be homeless on the night of the count. Results from various communities show that shelter counts conducted over a one-year period enumerate between 3 and 10 times as many people as PiT counts, suggesting the shelter counts include more people who are episodically or transitionally homeless.
Emergency shelters in Canada serve a wide range of demographic groups. Some shelters serve specific groups such as youth, women or families. The sampling method used in the National Shelter Study takes demographics into consideration to ensure that estimates are representative of the spectrum of people using different types of shelters. However, Violence Against Women (VAW) shelters are not included in the National Shelter Study, which means that many of the women and children are not counted in this study. The Survey of Residential Facilities for Victims of Abuse published by Statistics Canada contains information about the use of residential facilities, including VAW shelters, providing services to abused women and their children (Moreau, 2019). In addition, the 2016 Census provides a snapshot of those who spent the night between May 9th and 10th 2016 in shelters and similar facilities, including shelters for abused women and their children (McDermott, et. al. 2019).
Methods
The study uses a stratified cluster sample of emergency shelters to ensure accurate estimates of the number, gender and age characteristics of shelter users. The sample is based on emergency homeless shelters and does not include Violence Against Women (VAW) shelters, transitional housing, temporary shelters including hot and cold weather shelters, addictions services or immigrant and refugee shelters. For the 2016 study, the sample includes most of the largest shelters in Canada, covering 70% of the approximately 15,400 emergency shelter beds in the country. The methodology also takes into account people who use more than one shelter. Key details of the methodology are outlined below. The methodology for the current study is based on The National Shelter Study 2005 to 2009: Emergency Shelter Use in Canada (Segaert, 2013).
Types of shelters
This study focuses specifically on emergency homeless shelters. Shelters are considered to be emergency shelters if they have all of the following characteristics:
- most stays are less than 3 months in duration
- high annual turnover rate (for example, many clients use each bed over the course of a year)
- provide crisis-based service for those experiencing homelessness, with few barriers to entry (for example, no cost to client, no referral or entry application necessary)
Emergency shelters can be divided into several types based on the clients they serve: youth shelters, shelters for families, shelters for women and women with children, and general shelters. Patterns of shelter use at various types of shelters are similar from city to city and province to province. There are no consistent differences in average length of stay, turnover rate, number of stays, average client age, or occupancy rate for shelters in different cities or provinces (Segaert, 2010).
General shelters are the most common type of emergency shelter, serving a broad clientele of unaccompanied adults and youth. About 75% of the permanent shelter beds in Canada are at general shelters. Youth shelters have age-based entry requirements, with an upper age limit ranging between 18 and 25. Youth shelters tend to be smaller than general shelters, with an average of 15 beds compared to an average of 47 beds at general shelters. Family shelters are shelters for men or women with dependent children. They do not accept single individuals without children.
In the National Shelter Study, women’s shelters able to serve children have been given their own category (women/women with children). These shelters are similar to general shelters for women, but are able to accommodate children as well. They are different from family shelters because the majority of clients tend to be single women without children. If these were included in the family shelter category, the relatively few children using women/women with children shelters would underestimate the number of children using family shelters overall. Conversely, although they are very similar to general shelters for women, including these shelters in the analysis of general women’s shelters would lead to Data and sourcesoverestimating the number of children using shelters because general shelters for women do not serve any children.
Violence Against Women (VAW) shelters exhibit similar empirical characteristics to women/women with children shelters, with the exception that clients are less likely to have repeated stays. The major difference between women/women with children shelters and VAW shelters is their mandate. Although VAW shelters were established for women and their children fleeing domestic abuse, many VAW shelters accommodate women who are homeless for reasons other than domestic abuse (Burczycka and Cotter, 2011).
Several other shelter types are not included in this study: shelters for immigrants and refugees, temporary shelters for extreme weather conditions (such as “out of the cold” shelters), transitional housing programs, and halfway houses.
Data and sources
Employment and Social Development Canada maintains a database of administrative shelter data obtained from emergency shelters using the Homeless Individuals and Families Information System (HIFIS). Similar data is obtained through data sharing agreements with the City of Toronto, Peel Region, Province of Alberta and BC Housing.
The study period covers the years 2005 to 2016. Shelters with incomplete annual data are not included in the study. For each year of the study, there is complete annual data ranging from 96 shelters in 2005 to 216 shelters in 2016. The number of annual shelter stays ranges from 124,206 to 309,641 (see Table 1).
| Year | Shelters | Observations (shelter stays) |
|---|---|---|
| 2005 | 96 | 124,206 |
| 2006 | 102 | 130,013 |
| 2007 | 110 | 135,238 |
| 2008 | 120 | 135,301 |
| 2009 | 123 | 130,470 |
| 2010 | 172 | 217,318 |
| 2011 | 187 | 242,871 |
| 2012 | 193 | 263,880 |
| 2013 | 201 | 281,818 |
| 2014 | 209 | 309,641 |
| 2015 | 215 | 287,510 |
| 2016 | 216 | 254,913 |
The database contains information about observed shelter stays. Each shelter stay is associated with a unique client identifier that allows the identification of multiple stays at multiple shelters by the same individual, without divulging the person’s identity. It also includes information about age, gender, shelter name, and the beginning and end of each shelter stay. Starting in 2014, information was also collected for Indigenous identity, citizenship status and military service.
Sample design
The National Shelter Study uses a stratified cluster sample design to produce national estimates. Eight strata, based on the target clientele and gender served at shelters, were used in the sample design (see Table 2). These strata were chosen to ensure that the results account for differences among shelter types and that the estimates reflect age and gender proportions in the shelter-using population.
| Strata | Target clientele | Gender(s) served | Number of shelters in Canada 2016 | Number of permanent beds in Canada 2016 |
|---|---|---|---|---|
| 1 | Youth | Male | 12 | 208 |
| 2 | Youth | Female | 7 | 87 |
| 3 | Youth | Co-ed | 74 | 1,065 |
| 4 | General | Male | 72 | 4,235 |
| 5 | General | Female | 39 | 1,194 |
| 6 | General | Co-ed | 131 | 6,071 |
| 7 | Women/Children | n/a | 32 | 820 |
| 8 | Family | n/a | 32 | 1,733 |
The primary sampling units (clusters), are emergency shelters that were selected with probability proportional to size within each stratum (see Equation 1). The measure of size is the number of beds in the shelter (shelter capacity).
Equation 1: Calculation of probability proportional to size
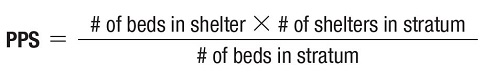
Equation 1: Text description
Probability proportional to size is equal to the number of beds in the shelter multiplied by the number of shelters in the stratum and divided by the total number of beds in the stratum.
After sorting by probability proportional to size, 1 out of every 4 shelters was selected for inclusion in the sample. The remaining un-sampled shelters that had complete data were included in the study as self-representing units, meaning they were not weighted to represent other shelters in the national estimates. Including these remaining shelters more than doubled the number of shelters in the analysis, which helped reduce the margin of error. Sample shelters without complete data were treated as nonresponse units (missing data). The 2010 to 2016 portion of the sample contains shelters from all thirteen provinces and territories. The sampling frame covers all known emergency shelters in Canada, including those that do not have a data provision agreement with Employment and Social Development Canada.
To obtain the final analysis weights for calculating totals or proportions, the data was adjusted by a “duplication factor” to account for clients who use more than one shelter (Segaert, 2013). There are several steps to calculate the duplication factor. The unique client identifiers were used to identify clients who used more than one shelter. The client weight is equal to the inverse of the number of shelters used (see Equation 2), therefore a client that accessed a single shelter was assigned a weight of 1.
Equation 2: Calculation of client weight

Equation 2: Text description
Client weight is equal to 1 over the number of shelters used by the client.
Equation 3: Calculation of shelter-level weight for sampled shelters
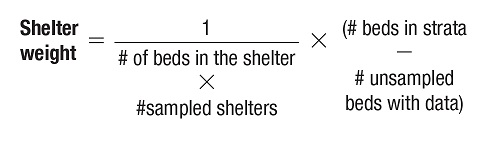
Equation 3: Text description
Shelter weight is equal to 1 over the number of beds in the shelter multiplied by the total number of sampled shelters. This is then multiplied by the total number of beds in the strata minus the number of beds with data that were not sampled.
Equation 4: Calculation of stratum-level duplication factor
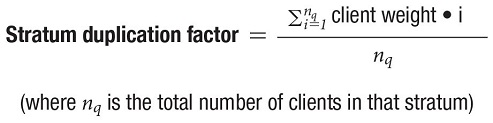
Equation 4: Text description
The stratum duplication factor is equal to the sum of all client weights in the stratum over the total number of clients in the stratum.
Equation 5: Calculation of shelter-level duplication factor
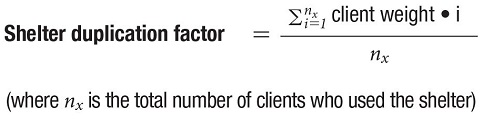
Equation 5: Text description
The shelter duplication factor is equal to the sum of client weights for clients who used the shelter divided by the total number of clients who used the shelter.
Final analysis weights were obtained by multiplying the shelter weight for sampled shelters (see Equation 3) by the mean duplication factor for their respective strata (see Equation 4). Self-representing shelters had a shelter weight equal to 1 and this was multiplied by the shelter duplication factor (see Equation 5) rather than the strata duplication factor to obtain the final analysis weight. The duplication factor reflects the use of multiple shelters. It does not indicate multiple uses of the same shelter. It should, therefore not be considered an indicator of the number of shelter visits or homeless episodes. Duplication factors with a value close to 1 have little effect on the base weights and indicate low rates of client duplication. Duplication factors with lower values indicate high rates of duplication and consequently reduce the final analysis weights for shelters in strata with high rates of client duplication.
Finally, because the sampling is done without replacement, a finite population correction factor was used (see Equation 6).
Equation 6: Calculation of the finite population correction factor
Equation 6: Text description
The finite population correction factor is equal to the square root of the number of shelters in the strata with data minus the number of shelters in the strata that were sampled divided by the total number of shelters in the strata minus 1.
Analysis
Canada’s emergency shelter system
Canada’s emergency shelter system is operating at over 90% capacity
In 2016 there were over 15,400 emergency shelter beds at 401 emergency shelters across Canada (Employment and Social Development Canada, 2016). Figure 1 shows the national shelter occupancy rates between 2005 and 2016. While the number of shelters and beds remained relatively stable between 2005 and 2016, demand for shelter beds increased during this period. On an average night in 2016, an estimated 14,032 Canadians slept in an emergency shelter, using 91.0% of available shelter beds. By comparison, in 2005, average nightly shelter use utilized 82.7% of capacity.
Figure 1: National shelter occupancy rate (2005 to 2016)
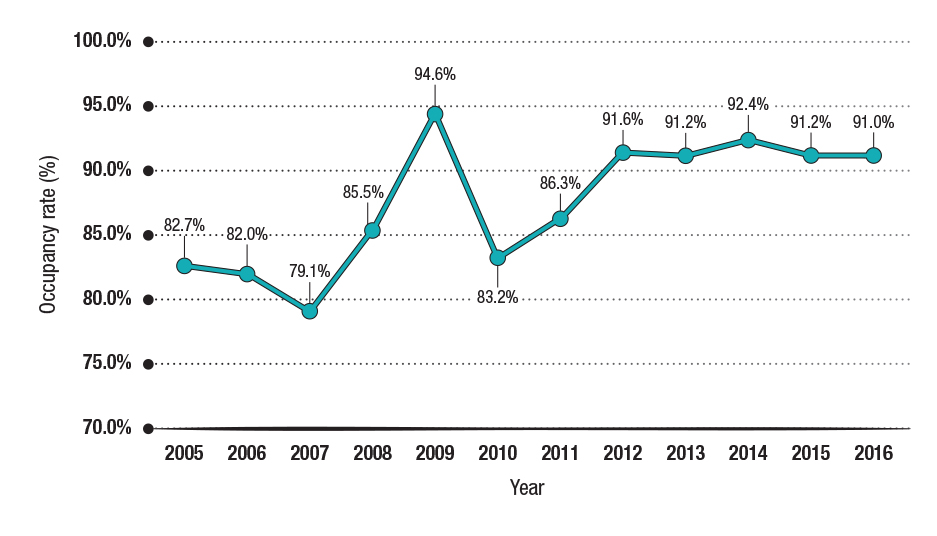
Figure 1: Text description
| Bednights used and national shelter occupancy rate | 2005 | 2006 | 2007 | 2008 | 2009 | 2010 | 2011 | 2012 | 2013 | 2014 | 2015 | 2016 |
|---|---|---|---|---|---|---|---|---|---|---|---|---|
| Occupancy rate | 82.7% | 82.0% | 79.1% | 85.5% | 94.6% | 83.2% | 86.3% | 91.6% | 91.2% | 92.4% | 91.2% | 91.0% |
Source: Data collected through HIFIS and data sharing agreements
Since 2012, national shelter occupancy rates have been over 90%, which suggests that the current supply of beds may not be adequately meeting demand at many shelters. This is the average occupancy rate for the shelter system as a whole and some operate over capacity on any given night. The National Shelter Study does not account for people turned away from shelters, which becomes increasingly likely as occupancy rates approach 100%.
Fewer people are using emergency shelters
In 2016 an estimated 129,127 people used an emergency shelter in Canada. This is almost 27,000 fewer than in 2005. The prevalence of emergency shelter use per 10,000 Canadians dropped from 48.4 in 2005 to 35.7 in 2016 (see Table 3).
| Year | Estimated unique shelter users | 95% confidence interval (lower bound) | 95% confidence interval (upper bound) | Total number of people in CanadaFootnote 4 | Prevalence of emergency shelter use (per 10,000) | Change in prevalence (annual)Footnote 5 |
|---|---|---|---|---|---|---|
| 2005 | 156,030 | 142,975 | 169,086 | 32,243,753 | 48.4 | n/a |
| 2006 | 150,663 | 138,167 | 163,159 | 32,571,174 | 46.2 | -2.1 |
| 2007 | 146,884 | 134,317 | 159,451 | 32,889,025 | 44.7 | -1.6 |
| 2008 | 151,621 | 137,408 | 165,834 | 33,247,118 | 45.6 | 0.9 |
| 2009 | 146,726 | 134,345 | 159,108 | 33,628,895 | 43.6 | -2.0 |
| 2010 | 141,854 | 131,489 | 152,219 | 34,004,889 | 41.7 | -1.9 |
| 2011 | 137,415 | 127,197 | 147,632 | 34,339,328 | 40.0 | -1.7 |
| 2012 | 141,405 | 130,347 | 152,463 | 34,714,222 | 40.7 | 0.7 |
| 2013 | 134,262 | 124,246 | 144,279 | 35,082,954 | 38.3 | -2.5 |
| 2014 | 136,866 | 126,890 | 146,841 | 35,437,435 | 38.6 | 0.3 |
| 2015 | 132,511 | 119,824 | 145,199 | 35,702,908 | 37.1 | -1.5 |
| 2016 | 129,127 | 116,848 | 141,411 | 36,109,487 | 35.7 | -1.3 |
While Table 3 suggests an overall reduction in the number of people using emergency shelters, the margin of error is large, and additional tests are needed to determine the statistical significance of the decrease.
The mean prevalence of shelter use over the 12-year period was 41.7 shelter users per 10,000 people in Canada and the mean annual number of shelter users was 142,114. A two-sample test of proportions found that the prevalence of shelter use in 2016 was significantly lower than the 12-year mean prevalence (diff= -0.0006 (-0.0011, -0.0001)) and the prevalence of shelter use in 2016 was significantly lower than the prevalence for each year between 2005 and 2010 (p<0.05), which suggests that there has been an overall decrease in emergency shelter use over the study period even though the total capacity of the shelter system has remained relatively consistent.
This is consistent with substantial reductions in the number of shelter users that have been observed over the study period in many communities, particularly in some large cities such as Toronto, Ottawa and Calgary. In 2005, 1 out of every 207 people in Canada used an emergency homeless shelter compared to 1 in 280 in 2016. Taking this into consideration, there is strong evidence to suggest that the number of unique shelter users per year has decreased over the study period.
More bednights are being used by fewer people
Despite fewer individuals using shelters, emergency shelters on average served nearly 1,000 more people per night in 2016 compared to 2005. The term “bednights” refers to the number of times a shelter bed is used in a year. In 2016 approximately 5.1 million bednights were used at emergency shelters in Canada, an increase of over 360,000 since 2005 (see Figure 2). This suggests that although there are fewer people using shelters, those that use shelters are using them more.
Figure 2: Bednights used and estimated unique shelter users by year (2005 to 2016)
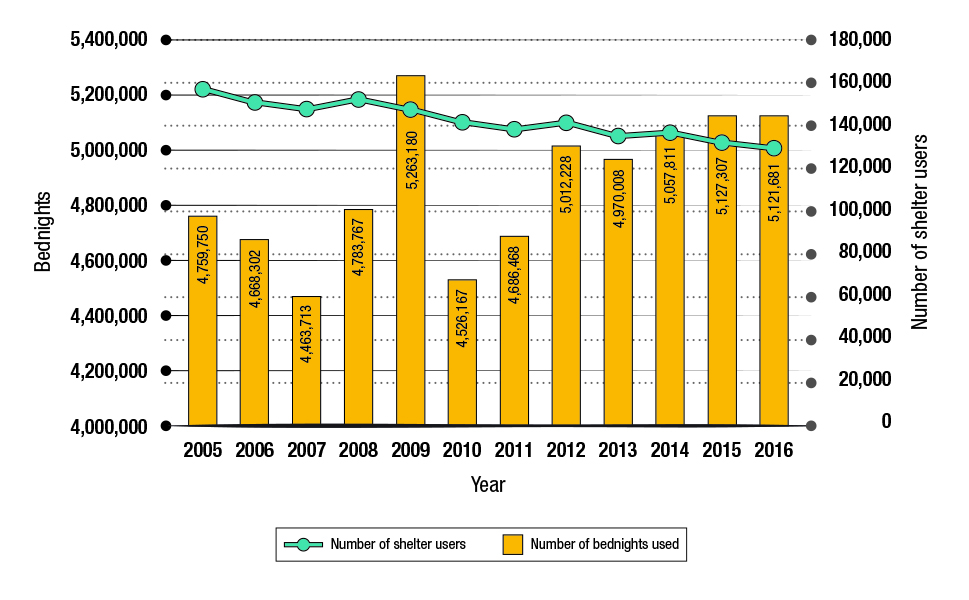
Figure 2: Text description
| Bednights used and shelter users | 2005 | 2006 | 2007 | 2008 | 2009 | 2010 | 2011 | 2012 | 2013 | 2014 | 2015 | 2016 |
|---|---|---|---|---|---|---|---|---|---|---|---|---|
| Bednights used | 4,759,750 | 4,668,302 | 4,463,713 | 4,783,767 | 5,263,180 | 4,526,167 | 4,686,468 | 5,012,228 | 4,970,008 | 5,057,811 | 5,127,307 | 5,121,681 |
| Shelter users | 156,030 | 150,663 | 146,884 | 151,621 | 146,726 | 141,854 | 137,415 | 141,405 | 134,262 | 136,866 | 132,511 | 129,127 |
Source: Data collected through HIFIS and data sharing agreements
Duration of shelter stays has increased, especially among families, older adults and seniors
The increase in the number of bednights is likely explained by trends in the length of time individuals and families are spending in shelters. Demand for shelter beds has increased due to longer stays, especially by families and people aged 50 and over.
Figure 3 shows the estimated time in shelter during a one-year period for various groups. Stay lengths have increased for all types of shelter users since 2010, especially families, older adults, and seniors. A typical shelter stay by a family was 25 days in 2016, nearly twice as long as a stay by individuals. People over 50 typically spend significantly more time in shelter than people under 50.
Figure 3: Typical number of days in shelter over a one-year period (2010 to 2016)Footnote 6
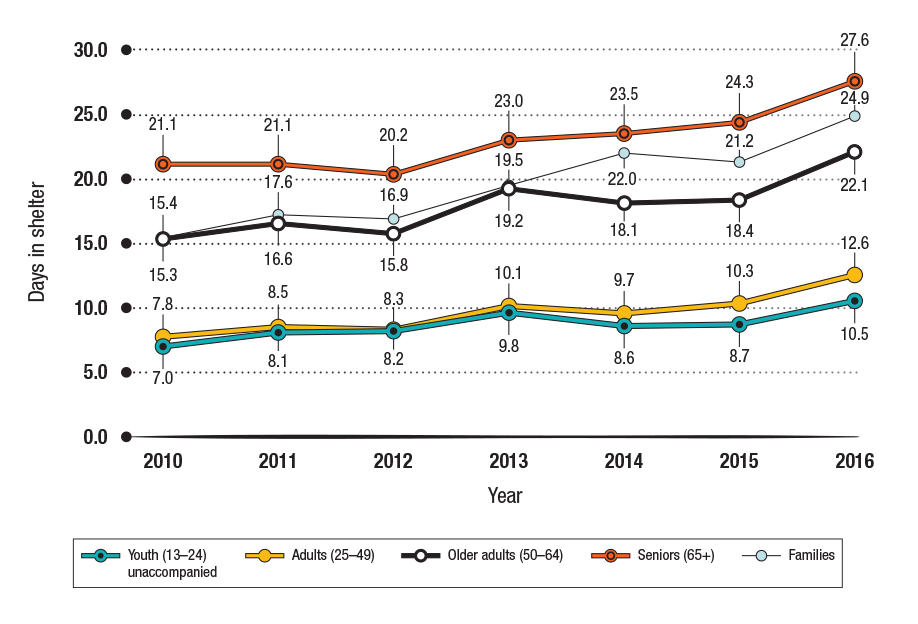
Figure 3: Text description
| Age group | 2010 | 2011 | 2012 | 2013 | 2014 | 2015 | 2016 |
|---|---|---|---|---|---|---|---|
| Youth (13 to 24) unaccompanied | 7.0 | 8.1 | 8.2 | 9.8 | 8.6 | 8.7 | 10.5 |
| Adults (25 to 49) | 7.8 | 8.5 | 8.3 | 10.1 | 9.7 | 10.3 | 12.6 |
| Older adults (50 to 64) | 15.3 | 16.6 | 15.8 | 19.2 | 18.1 | 18.4 | 22.1 |
| Seniors (65+) | 21.1 | 21.1 | 20.2 | 23.0 | 23.5 | 24.3 | 27.6 |
| Families | 15.4 | 17.6 | 16.9 | 19.5 | 22.0 | 21.2 | 24.9 |
Source: Data collected through HIFIS and data sharing agreements
Methodological note about stay length
It is important to note that, during the study period, the length of stay at emergency shelters did not follow a normal distribution. Each year, up to one-third of shelter stays lasted only one night and there was a strong positive skew, with a small number of stays lasting months or even years. Because of this, the average length of stay is misleading. Another challenge with length of stay is that it can be affected by many factors. As such, this study uses a zero-truncated negative binomial regression model, which is able to simultaneously take many factors into consideration and estimate a typical length of stay.
Figure 4: Percentage of short, medium and long stays by year (2005 to 2016)
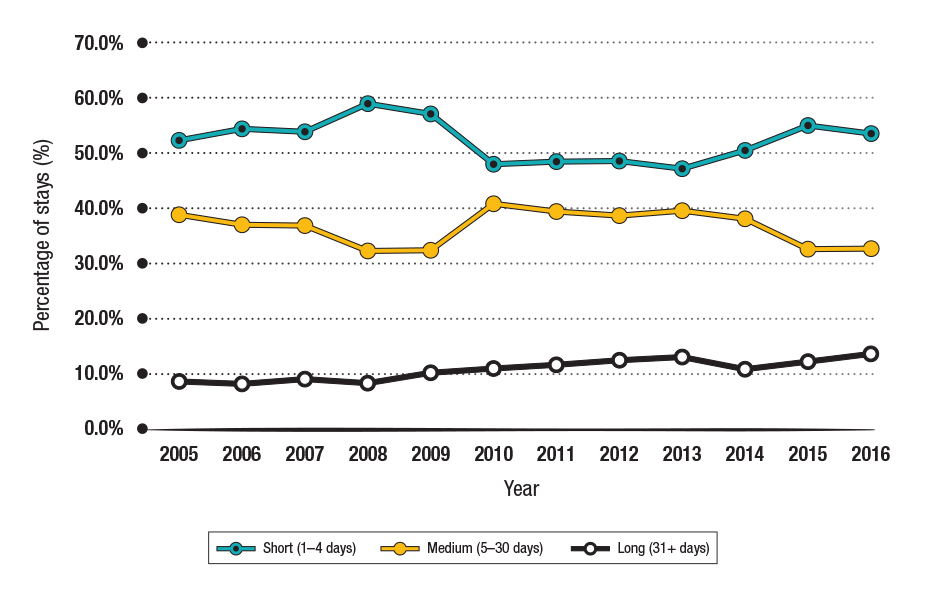
Figure 4: Text description
| Length of stay | 2005 | 2006 | 2007 | 2008 | 2009 | 2010 | 2011 | 2012 | 2013 | 2014 | 2015 | 2016 |
|---|---|---|---|---|---|---|---|---|---|---|---|---|
| short (1 to 4 days) | 52.4% | 54.6% | 54.0% | 59.2% | 57.2% | 48.1% | 48.6% | 48.7% | 47.2% | 50.6% | 55.0% | 53.6% |
| med (5 to 30 days) | 38.9% | 37.1% | 36.9% | 32.4% | 32.5% | 40.8% | 39.5% | 38.7% | 39.6% | 38.1% | 32.7% | 32.7% |
| long (31+ days) | 8.7% | 8.3% | 9.2% | 8.4% | 10.3% | 11.0% | 11.9% | 12.6% | 13.2% | 11.3% | 12.3% | 13.7% |
Source: Data collected through HIFIS and data sharing agreements
Shelter stays can also be categorized into short (1 to 4 days), medium (5 to 30 days) and long (more than 30 days). Figure 4 shows the percentage of short, medium and long stays for each year of the study. About half of all shelter stays are less than 5 days. In most years, fewer than 40% of stays lasted 5 to 30 days. The percentage of short and medium stays remained fairly consistent between 2010 and 2014. In 2015 and 2016, the percentage of medium stays dropped to pre-2010 levels and the number of short stays increased. While the data suggests an inverse relationship between short and medium stays, the percentage of long stays gradually increased over the study period, from 8.7% in 2005 to a high of 13.7% in 2016. Although long stays make up a relatively small number of overall stays, they have a disproportionate impact on the number of bednights used across the country.
Demographic characteristics of shelter users
The gender distribution of shelter users has not changed
There has been no significant change in the proportion of males and females using shelters between 2005 and 2016. In 2016, 69.5% of shelter users were male and 29.7% were female (see Figure 5). However, Violence Against Women shelters are not included in this study, which may underestimate female shelter use. About 0.8% of shelter users were gender diverse, however this is likely under-reported, as other evidence suggests that individuals who are gender diverse are over-represented in the homeless population, particularly among youth (Gaetz et al., 2016).
Figure 5: Gender distribution of shelter users (2016)
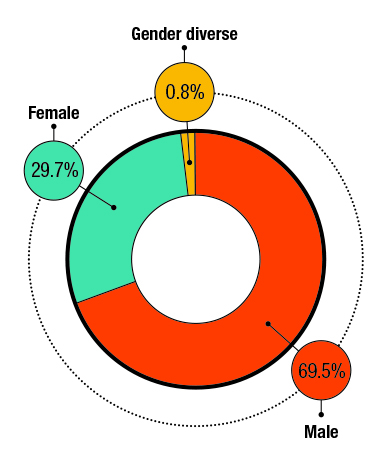
Figure 5: Text description
| Gender | Percentage of shelter users |
|---|---|
| Male | 69.5% |
| Female | 29.7% |
| Gender diverse | 0.8% |
Source: Data collected through HIFIS and data sharing agreements
Female shelter users are, on average, younger than male shelter users. The average age for males is 40, compared to 37 for females. Gender diverse individuals had an average age of 33, lower than the average age for the sample as a whole (see Table 4).
| Category | Average age (excluding children) |
|---|---|
| All adults | 39 years |
| Male adults | 40 years |
| Female adults | 37 years |
| Gender diverse adults | 33 years |
Consistent with previous releases of the National Shelter Study, the proportion of female shelter users decreased as age group increased. While childrenFootnote 7 were equally distributed between male and female, just over one in 5 (21.9%) seniors using shelters were female compared to nearly 4 of 5 (77.9%) seniors who were male (see Figure 6).
Figure 6: Shelter use by gender and by age group (2016)Footnote 8
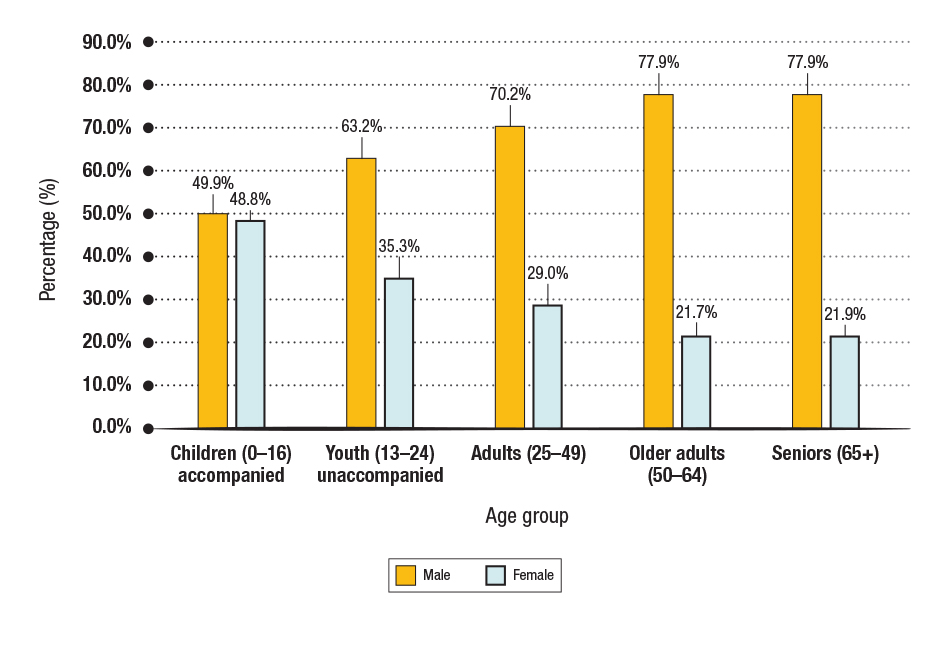
Figure 6: Text description
| Age group | Children (0 to 16) accompanied | Youth (13 to 24) unaccompanied | Adults (25 to 49) | Older Adults (50 to 64) | Seniors (65+) |
|---|---|---|---|---|---|
| Male | 49.9% | 63.2% | 70.2% | 77.9% | 77.9% |
| Female | 48.8% | 35.3% | 29.0% | 21.7% | 21.9% |
Source: Data collected through HIFIS and data sharing agreements
The proportion of shelter users over the age of 50 is up
In 2016, just over half of shelter users were between 25 and 49 years of age. Children and seniors made up only a small percentage of shelter users (4.2% and 3.2% respectively), while unaccompanied youth (aged 13 to 24) and older adults (aged 50 to 64) each comprised around one-fifth of the shelter population (see Figure 7).
Figure 7: Distribution of shelter users by age group (2016)

Figure 7: Text description
| Age group | Children (0 to 16) accompanied | Youth (13 to 24) unaccompanied | Adults (25 to 49) | Older adults (50 to 64) | Seniors (65+) |
|---|---|---|---|---|---|
| 2016 | 6.3% | 17.3% | 52.5% | 20.8% | 3.1% |
Source: Data collected through HIFIS and data sharing agreements
The age composition of the shelter population changed considerably between 2005 and 2016 (see Figure 8). Compared to 2005, the number of shelter users 50 and over has increased and the number of shelter users under 50 has decreased.
Figure 8: Estimated number of annual shelter users by age group (2005 to 2016)

Figure 8: Text description
| Age group | 2005 | 2006 | 2007 | 2008 | 2009 | 2010 | 2011 | 2012 | 2013 | 2014 | 2015 | 2016 |
|---|---|---|---|---|---|---|---|---|---|---|---|---|
| Children (0 to 16) accompanied | 5,339 | 5,764 | 6,422 | 6,327 | 8,167 | 6,007 | 5,446 | 6,277 | 6,425 | 5,780 | 8,124 | 6,147 |
| Youth (13 to 24) unaccompanied | 32,757 | 31,270 | 31,250 | 30,313 | 31,256 | 27,225 | 26,256 | 25,362 | 23,653 | 25,501 | 22,398 | 18,737 |
| Adults (25 to 49) | 95,820 | 90,931 | 86,824 | 89,304 | 81,463 | 77,836 | 75,245 | 76,449 | 71,113 | 71,824 | 67,764 | 69,121 |
| Older adults (50 to 64) | 18,856 | 19,779 | 19,442 | 22,214 | 22,071 | 25,049 | 25,953 | 28,640 | 28,088 | 28,951 | 26,839 | 27,146 |
| Seniors (65+) | 2,244 | 2,214 | 2,338 | 2,466 | 2,566 | 3,505 | 3,721 | 4,028 | 4,454 | 4,332 | 4,003 | 5,256 |
Source: Data collected through HIFIS and data sharing agreements
Rates of homelessness in Canada 2005, 2010 and 2016
Another way to look at shelter use trends is to look at the rates of homelessness for various age categories compared to the Canadian population. Looking at the rate of shelter use by age controls for changes in the age composition of the Canadian population over time. Figure 9 shows how shelter use trends by age have changed over time, especially among people aged between 15 and 49, older adults (aged 50 to 64), and older youth (aged 20 to 24) and accompanied children (aged 0 to 14).
The rate of shelter use for all age groups between 15 and 49 dropped between 2005 and 2016, which reflects the overall drop in the number of individuals accessing emergency shelters in Canada.
Despite this decrease, it is notable that in each of the 3 years examined, the rate of homelessness spikes for older youth (aged 20 to 24). In 2016, this group experienced the highest rate of homelessness compared to all other age groups.
In 2016, the rate of shelter use among those aged between 50 and 64 was higher compared to 2005. This suggests that while the population is ageing, it does not fully explain the increase in older individuals experiencing homelessness.
In 2016, the rate of shelter use among children aged 0 to 14 was higher compared to 2005. This is possibly the result of an increased number of family shelters over this time period.
Figure 9: Rate of shelter use by age (2005, 2010, 2016)
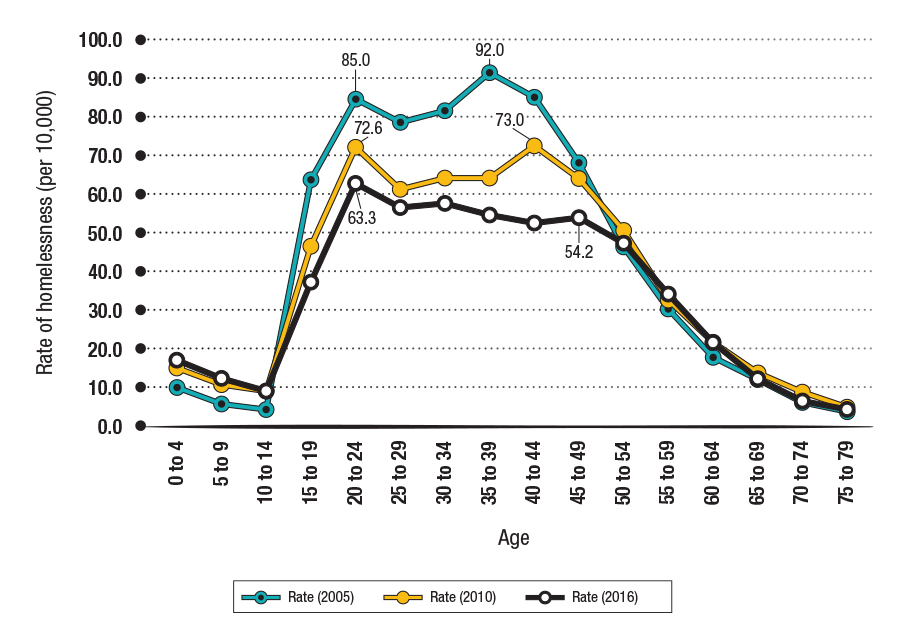
Figure 9: Text description
| Age group | Rate of shelter use per 10,000 2005 |
Rate of shelter use per 10,000 2010 |
Rate of shelter use per 10,000 2016 |
|---|---|---|---|
| 0 to 4 | 9.8 | 14.8 | 16.9 |
| 5 to 9 | 5.4 | 10.3 | 12.3 |
| 10 to 14 | 4.1 | 8.2 | 8.8 |
| 15 to 19 | 64.2 | 46.6 | 37.5 |
| 20 to 24 | 85.0 | 72.6 | 63.3 |
| 25 to 29 | 78.9 | 61.6 | 56.7 |
| 30 to 34 | 82.1 | 64.6 | 57.9 |
| 35 to 39 | 92.0 | 64.3 | 54.9 |
| 40 to 44 | 85.5 | 73.0 | 52.6 |
| 45 to 49 | 68.1 | 64.1 | 54.2 |
| 50 to 54 | 45.9 | 50.4 | 47.3 |
| 55 to 59 | 29.7 | 32.1 | 33.8 |
| 60 to 64 | 17.3 | 21.2 | 21.4 |
| 65 to 69 | 11.4 | 13.1 | 12.1 |
| 70 to 74 | 5.4 | 8.1 | 6.3 |
| 75 to 79 | 3.2 | 4.3 | 4.0 |
Sources:
- Data collected through HIFIS and data sharing agreements
- Statistics Canada. n.d. Table 17 to 10 to 0005 to 01 Population estimates on July 1st, by age and sex. Statistics Canada. Ottawa.
Adults (aged 25 to 49)
The number of shelter users aged 25 to 49 dropped considerably between 2005 and 2016, and accounts for much of the overall decrease in shelter users over the study period. Despite this decline, individuals aged 25 to 49 continue to make up the largest group of shelter users. Just over half (52.5%) of shelter users fell into this age group in 2016, down from 62.3% in 2005. Compared to the general Canadian population, adults aged 25 to 49 are over-represented in emergency shelters for all years of the study (see Figure 10). Between 2005 and 2016, the proportion of adults in the general population ranges from 34% to 37% (Statistics Canada. n.d) compared to 52% to 62% in the shelter population.
Figure 10: Number of adults (25 to 49) using emergency shelters annually (and percentage of total shelter users) (2005 to 2016)
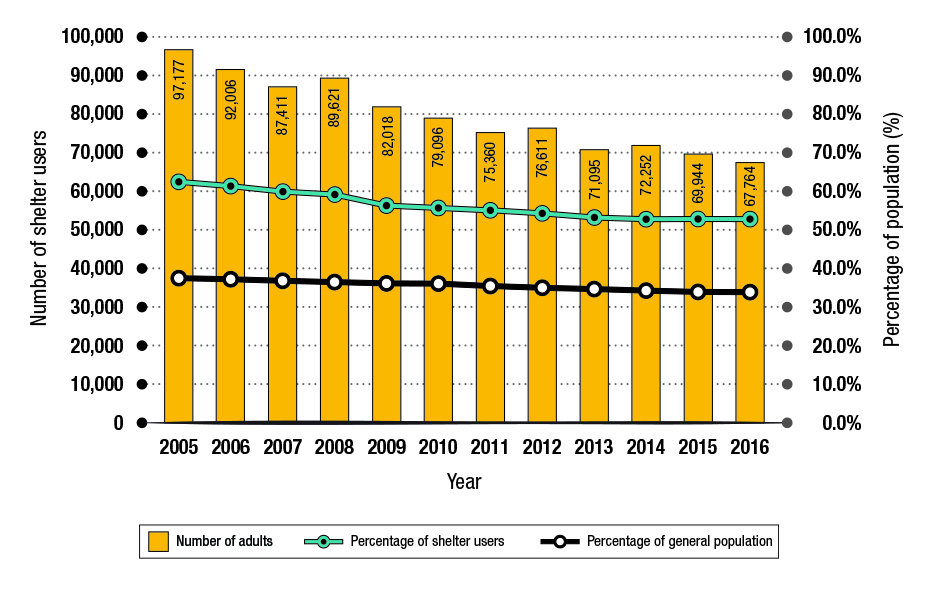
Figure 10: Text description
| Year | Number of shelter users | percentage of shelter users | percentage of general population |
|---|---|---|---|
| 2005 | 97,177 | 62.3% | 37.4% |
| 2006 | 92,006 | 61.1% | 37.0% |
| 2007 | 87,411 | 59.5% | 36.7% |
| 2008 | 89,621 | 59.1% | 36.4% |
| 2009 | 82,018 | 55.9% | 36.1% |
| 2010 | 79,096 | 55.8% | 35.8% |
| 2011 | 75,360 | 54.8% | 35.2% |
| 2012 | 76,611 | 54.2% | 34.8% |
| 2013 | 71,095 | 53.0% | 34.4% |
| 2014 | 72,252 | 52.8% | 34.1% |
| 2015 | 69,944 | 52.8% | 33.8% |
| 2016 | 67,764 | 52.5% | 33.6% |
Sources:
- Data collected through HIFIS and data sharing agreements
- Statistics Canada. n.d. Table 17 to 10 to 0005 to 01 Population estimates on July 1st, by age and sex. Statistics Canada. Ottawa.
Youth (unaccompanied, aged 13 to 24)
Unaccompanied youth aged 13 to 24 make up a highly visible segment of the homeless population, accounting for 17.3% of shelter users in Canada. As shown in Figure 11, the number of youth using emergency shelters decreased from almost 30,000 in 2005 to just over 22,000 in 2016, a 24.3% decline in use by this group. However, unaccompanied youth aged 13 to 24 remain slightly over-represented in shelters (17% to 19%) compared to the proportion of all youth in the general populationFootnote 9 (12% to 14%) over the period of study (Statistics Canada, n.d.). Furthermore, looking more closely within this group of shelter users, older youth between 20 and 24 years of age had a higher rate of shelter use in 2016 than any other age group, at 63.3 per 10,000 (see Figure 9). About 1 out of every 158 people of this age group used a shelter in 2016.
Figure 11: Number of youth using emergency shelters annually (and percentage of total shelter users) (2005 to 2016)
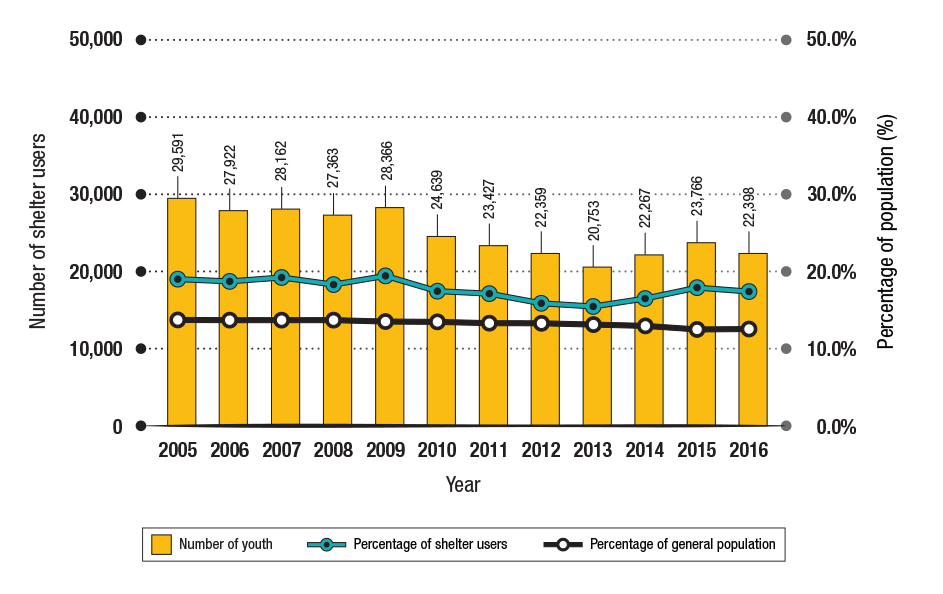
Figure 11: Text description
| Year | Number of shelter users | percentage of shelter users | percentage of general population |
|---|---|---|---|
| 2005 | 29,591 | 19.0% | 13.7% |
| 2006 | 27,922 | 18.5% | 13.7% |
| 2007 | 28,162 | 19.2% | 13.7% |
| 2008 | 27,363 | 18.0% | 13.6% |
| 2009 | 28,366 | 19.3% | 13.6% |
| 2010 | 24,639 | 17.4% | 13.5% |
| 2011 | 23,427 | 17.0% | 13.4% |
| 2012 | 22,359 | 15.8% | 13.2% |
| 2013 | 20,753 | 15.5% | 13.0% |
| 2014 | 22,267 | 16.3% | 12.8% |
| 2015 | 23,766 | 17.9% | 12.6% |
| 2016 | 22,398 | 17.3% | 12.4% |
Sources:
- Data collected through HIFIS and data sharing agreements
- Statistics Canada. n.d. Table 17 to 10 to 0005 to 01 Population estimates on July 1st, by age and sex. Statistics Canada. Ottawa.
Figure 12 splits youth into 3 age groups, 13 to 16, 17 to 20 and 21 to 24. Over the study period, there was a decrease in the proportion of youth under the age of 21, and a steady increase in the number of youth between 21 and 24. Nearly 60% of unaccompanied youth using shelters were over 21 in 2016.
Figure 12: Changes in the age distribution of youth (2005 to 2016)
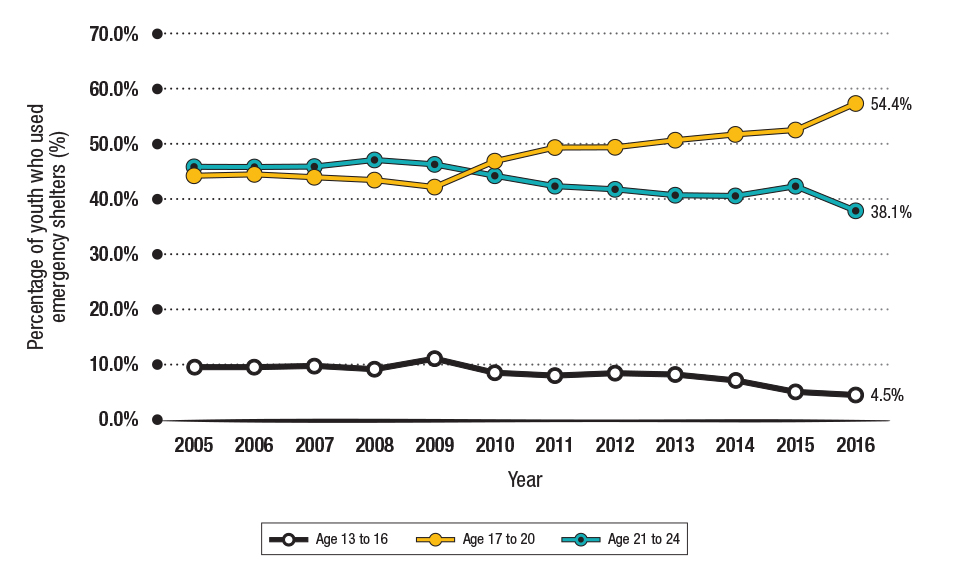
Figure 12: Text description
| Year | Percent of youth aged 13 to 16 | Percent of youth aged 17 to 20 | Percent of youth aged 21 to 24 |
|---|---|---|---|
| 2005 | 9.7% | 45.8% | 44.5% |
| 2006 | 9.5% | 46.0% | 44.5% |
| 2007 | 10.0% | 46.1% | 44.0% |
| 2008 | 9.2% | 47.3% | 43.5% |
| 2009 | 11.4% | 46.5% | 42.2% |
| 2010 | 8.7% | 44.4% | 47.0% |
| 2011 | 8.0% | 42.5% | 49.5% |
| 2012 | 8.6% | 42.0% | 49.5% |
| 2013 | 8.3% | 41.0% | 50.7% |
| 2014 | 7.4% | 40.7% | 51.9% |
| 2015 | 5.2% | 42.4% | 52.5% |
| 2016 | 4.5% | 38.1% | 57.4% |
Source: Data collected through HIFIS and data sharing agreements
Although there are nearly 100 emergency shelters in Canada that specifically serve youth, more than half of shelter stays by youth during the study period were at other types of shelters (see Table 5). Male youth were more likely to use general shelters than youth shelters. A significant minority (16.0%) of stays by female youth occurred at family shelters and shelters for women/women with children.
| Shelter type | Males | Females |
|---|---|---|
| Youth | 36.8% | 38.0% |
| General | 61.6% | 46.0% |
| Women/Women with children | 0.1% | 10.4% |
| Family | 1.4% | 5.6% |
| Total | 100.0% | 100.0% |
Older adults (aged 50 to 64) and seniors (aged 65 and over)
Between 2005 and 2016 there was an increase in the proportion of older adults and seniors using emergency shelters. The proportion of people over the age of 50 has increased from 15.3% in 2005 to 25.6% in 2016. The increase in shelter users over the age of 50 can be partly explained by the aging of the Canadian population, but this phenomenon does not explain the entire increase.
The percentage of all shelters users who were older adults aged 50 to 64 increased from 13.6% 2005 to 20.8% in 2016 (see Figure 13).
As of 2010, more 50 to 64 year-olds were using shelters than youth. Older adults stayed in shelter much longer than adults under 50 (22.1 days vs 12.6 days) and youth (22.1 days vs 10.5 days). The proportion of older adults in shelter relative to the general population has fluctuated over time. However, since 2010, the proportion of older adults in shelter has closely followed the proportion found in the general population.
Figure 13: Number of older adults (50 to 64) using shelters annually and percentage of total shelter users (2005 to 2016)
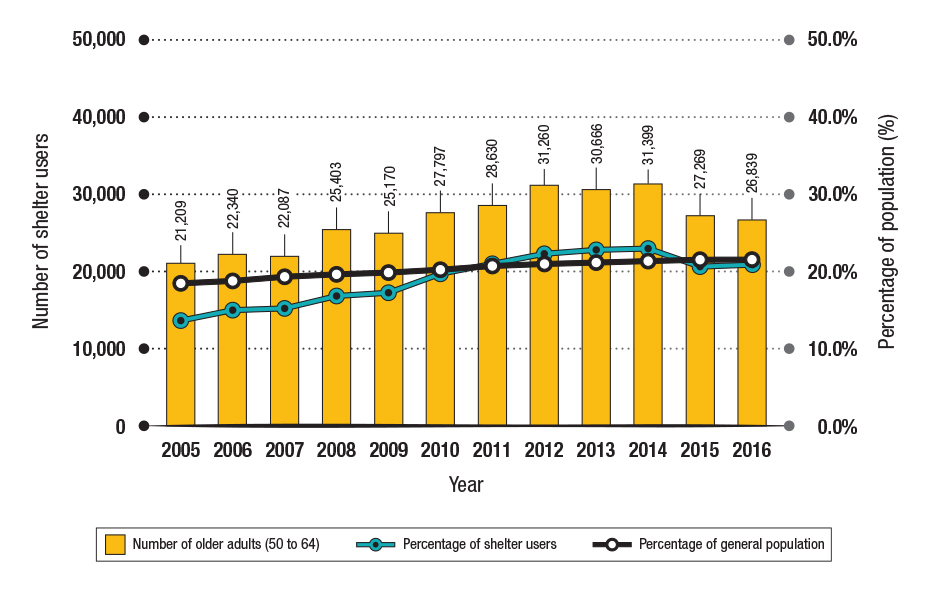
Figure 13: Text description
| Year | Number of shelter users | Percentage of shelter users | Percentage of general population |
|---|---|---|---|
| 2005 | 21,209 | 13.6% | 18.2% |
| 2006 | 22,340 | 14.8% | 18.6% |
| 2007 | 22,087 | 15.0% | 19.1% |
| 2008 | 25,403 | 16.8% | 19.5% |
| 2009 | 25,170 | 17.2% | 19.8% |
| 2010 | 27,797 | 19.6% | 20.1% |
| 2011 | 28,630 | 20.8% | 20.7% |
| 2012 | 31,260 | 22.1% | 20.8% |
| 2013 | 30,666 | 22.8% | 21.0% |
| 2014 | 31,399 | 22.9% | 21.2% |
| 2015 | 27,269 | 20.6% | 21.4% |
| 2016 | 26,839 | 20.8% | 21.4% |
Sources:
- Data collected through HIFIS and data sharing agreements
- Statistics Canada. n.d. Table 17 to 10 to 0005 to 01 Population estimates on July 1st, by age and sex. Statistics Canada. Ottawa.
There are relatively few seniors aged 65 and over in the shelter system. However, the number of seniors using shelters increased by nearly 50% from 2,680 in 2005 to 4,003 in 2016 (see Figure 14). As a percentage of the total shelter population, seniors increased from 1.7% in 2005 to 3.1% in 2016. Regardless of the year of observation, seniors are under-represented in shelters compared to the general Canadian population.
Figure 14: Number of seniors (65 years and over) using shelters annually and percentage of total shelter users (2005 to 2016)

Figure 14: Text description
| Year | Number of shelter users | Percentage of shelter users | Percentage of general population |
|---|---|---|---|
| 2005 | 2,680 | 1.7% | 13.1% |
| 2006 | 2,604 | 1.7% | 13.3% |
| 2007 | 2,774 | 1.9% | 13.5% |
| 2008 | 2,866 | 1.9% | 13.7% |
| 2009 | 2,938 | 2.0% | 13.9% |
| 2010 | 4,220 | 3.0% | 14.1% |
| 2011 | 4,519 | 3.3% | 14.4% |
| 2012 | 4,868 | 3.4% | 14.8% |
| 2013 | 5,298 | 3.9% | 15.3% |
| 2014 | 5,147 | 3.8% | 15.6% |
| 2015 | 4,013 | 3.0% | 16.0% |
| 2016 | 4,003 | 3.1% | 16.4% |
Sources:
- Data collected through HIFIS and data sharing agreements
- Statistics Canada. n.d. Table 17 to 10 to 0005 to 01 Population estimates on July 1st, by age and sex. Statistics Canada. Ottawa
Children (under 16, accompanied by an adult)
Children accounted for 6.3 % of all shelter users in 2016, compared to 3.84% in 2005. Aside from 2009, the number of children using shelters remained relatively stable between 2005 and 2014 at about 6,000 per year (see Figure 15), before increasing in 2015 and 2016. This is likely due in part to an increase in the number of available family shelter beds in 2015 and 2016 (see Figure 16), although other larger socioeconomic factors may also have influenced this result. Children are under-represented in shelters compared to the general population. Note that many children stay at Violence Against Women shelters, which are not included in this study.
Figure 15: Annual number of children using emergency shelters and percentage of total shelter users (2005 to 2016)
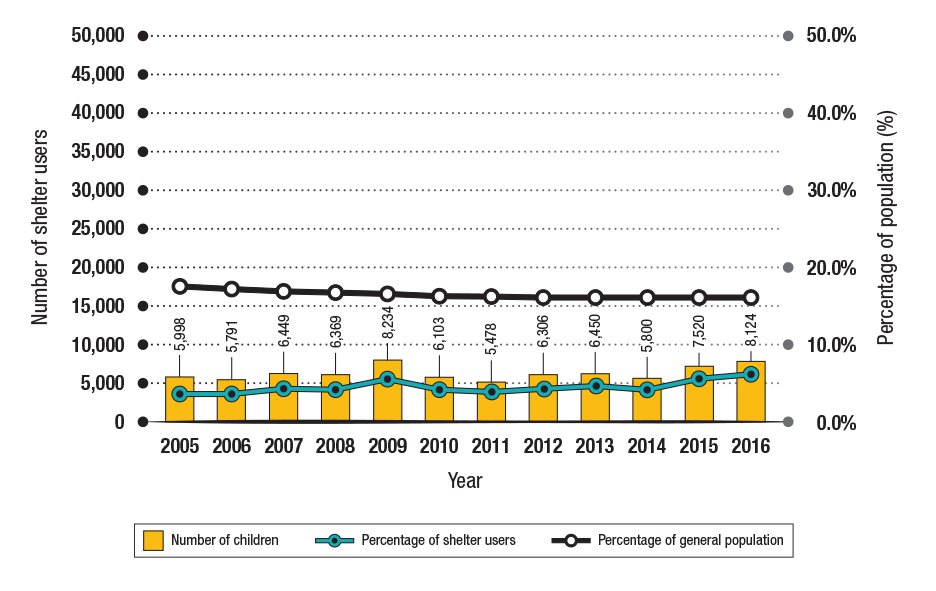
Figure 15: Text description
| Year | Number of shelter users | percentage of shelter users | percentage of general population |
|---|---|---|---|
| 2005 | 5,998 | 3.8% | 17.7% |
| 2006 | 5,791 | 3.8% | 17.3% |
| 2007 | 6,449 | 4.4% | 17.1% |
| 2008 | 6,369 | 4.2% | 16.8% |
| 2009 | 8,234 | 5.6% | 16.6% |
| 2010 | 6,103 | 4.3% | 16.5% |
| 2011 | 5,478 | 4.0% | 16.4% |
| 2012 | 6,306 | 4.5% | 16.3% |
| 2013 | 6,450 | 4.8% | 16.3% |
| 2014 | 5,800 | 4.2% | 16.2% |
| 2015 | 7,520 | 5.7% | 16.2% |
| 2016 | 8,124 | 6.3% | 16.2% |
Sources:
- Data collected through HIFIS and data sharing agreements
- Statistics Canada. n.d. Table 17 to 10 to 0005 to 01 population estimates on July 1st, by age and sex. Statistics Canada. Ottawa
Figure 16: Annual number of children using emergency shelters and number of family beds (2005 to 2016)
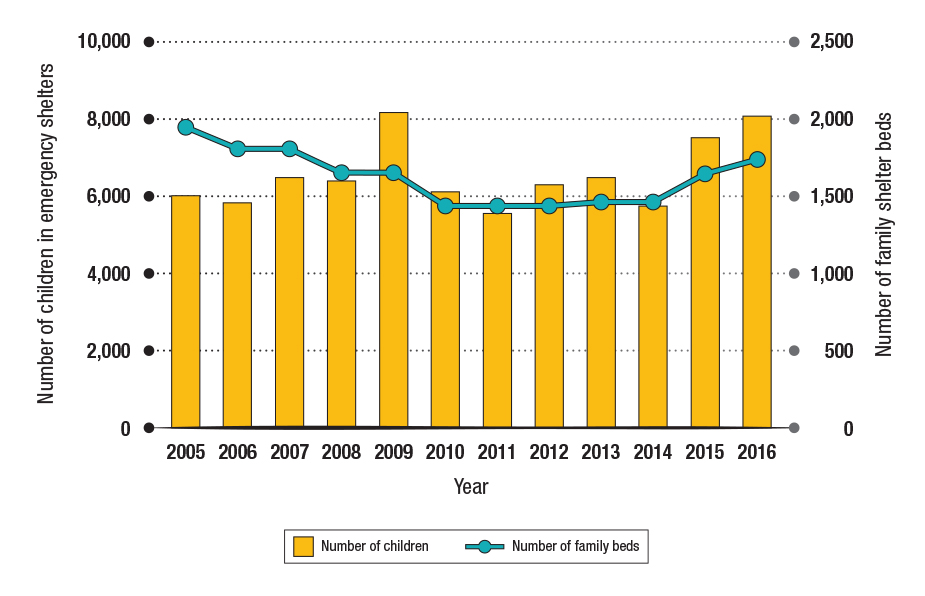
Figure 16: Text description
| Year | Number of children | Number of emergency family beds |
|---|---|---|
| 2005 | 5997.73 | 1949 |
| 2006 | 5791.43 | 1804 |
| 2007 | 6449.05 | 1804 |
| 2008 | 6369.05 | 1646 |
| 2009 | 8234.3 | 1649 |
| 2010 | 6102.94 | 1434 |
| 2011 | 5477.69 | 1434 |
| 2012 | 6305.81 | 1434 |
| 2013 | 6450.49 | 1454 |
| 2014 | 5800.12 | 1454 |
| 2015 | 7520.12 | 1633 |
| 2016 | 8124.27 | 1733 |
Sources:
- Data collected through HIFIS and data sharing agreements
Family shelters continue to operate at high capacity
In 2016 across Canada, there were 30 family shelters with a capacity of 1,720 beds. Corresponding with the spike in the number of children using shelters in 2009, the first National Shelter Study covering 2005 to 2009 reported an increase in the use of family shelters, with the average occupancy rate at family shelters exceeding 100% in 2009. This peak use did not continue after 2009 (see Figure 17). However, the average occupancy rate at family shelters was 84.6% in 2016, almost 20 percentage points higher than the 67.3% occupancy rate reported in 2005.
Figure 17: Average occupancy rate at family shelters (2005 to 2016)
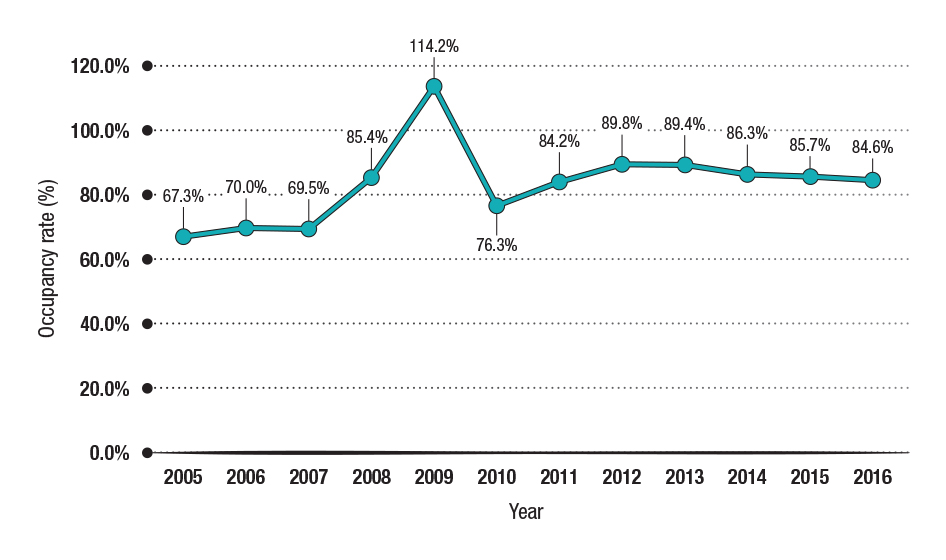
Figure 17: Text description
| Year | Occupancy rate at family shelters |
|---|---|
| 2005 | 67.3% |
| 2006 | 70.0% |
| 2007 | 69.5% |
| 2008 | 85.4% |
| 2009 | 114.2% |
| 2010 | 76.3% |
| 2011 | 84.2% |
| 2012 | 89.8% |
| 2013 | 89.4% |
| 2014 | 86.3% |
| 2015 | 85.7% |
| 2016 | 84.6% |
Source: Data collected through HIFIS and data sharing agreements
The high occupancy rate at family shelters is most likely driven by increases in the length of shelter stays by families. A typical stay at a family shelter increased from 8.3 days in 2005 to 24.9 days in 2016.
Figure 18 shows the percentage of short, medium and long stays at family shelters. Short stays (less than 5 days) and long stays (31 days and more) seem to have an inverse relationship. From 2008 to 2014, the majority of stays by families were medium or long in duration. In 2015, there was a cross over of long and short stays that cannot easily be explained using the available data.
Figure 18: Stay length at family shelters (2006 to 2016)
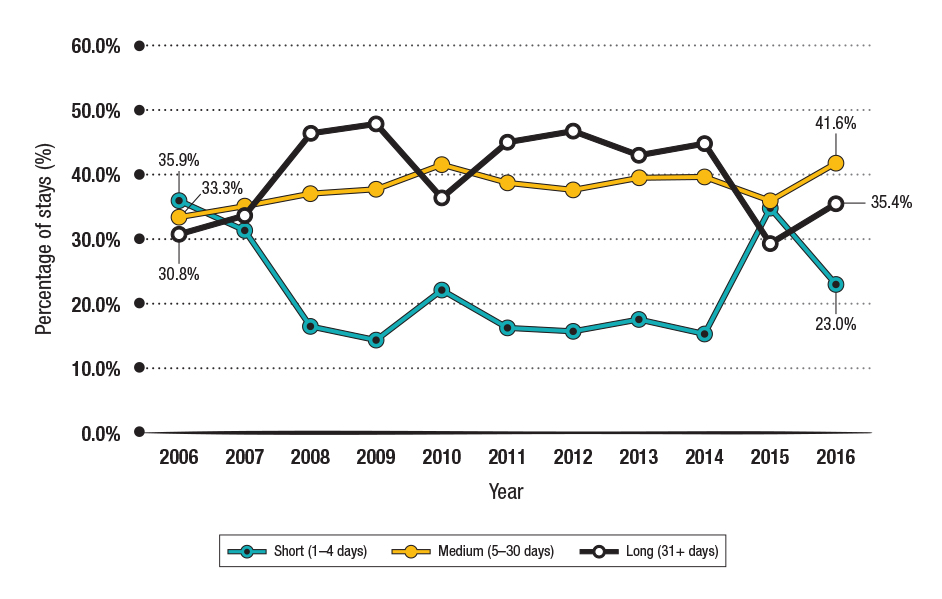
Figure 18: Text description
| Year | Percentage short stays (1 to 4 days) | Percentage medium stays (5 to 30 days) | Percentage long stays (31+ days) |
|---|---|---|---|
| 2005 | 32.0% | 37.6% | 30.3% |
| 2006 | 35.9% | 33.3% | 30.8% |
| 2007 | 31.2% | 35.1% | 33.7% |
| 2008 | 16.4% | 37.0% | 46.5% |
| 2009 | 14.2% | 37.8% | 48.0% |
| 2010 | 22.2% | 41.6% | 36.3% |
| 2011 | 16.2% | 38.7% | 45.1% |
| 2012 | 15.6% | 37.6% | 46.8% |
| 2013 | 17.5% | 39.5% | 43.0% |
| 2014 | 15.4% | 39.6% | 45.0% |
| 2015 | 35.0% | 35.8% | 29.3% |
| 2016 | 23.0% | 41.6% | 35.4% |
Source: Data collected through HIFIS and data sharing agreements
Youth shelters continue to operate at high capacity
Youth shelters generally serve individuals between the ages of 16 and 24. Across Canada in 2016, there were 97 youth shelters with a capacity of 1,483 beds. Figure 19 demonstrates that the occupancy rate at youth shelters has remained relatively stable between 2011 and 2016, hovering between 81.0% and 87.8%. The peak occupancy in 2009 (97.2%) was likely due to the financial recession. Compared to family and general shelters, youth shelters have the most consistent occupancy rate between 2005 and 2016.
Figure 19: Average occupancy rate at youth shelters (2005 to 2016)
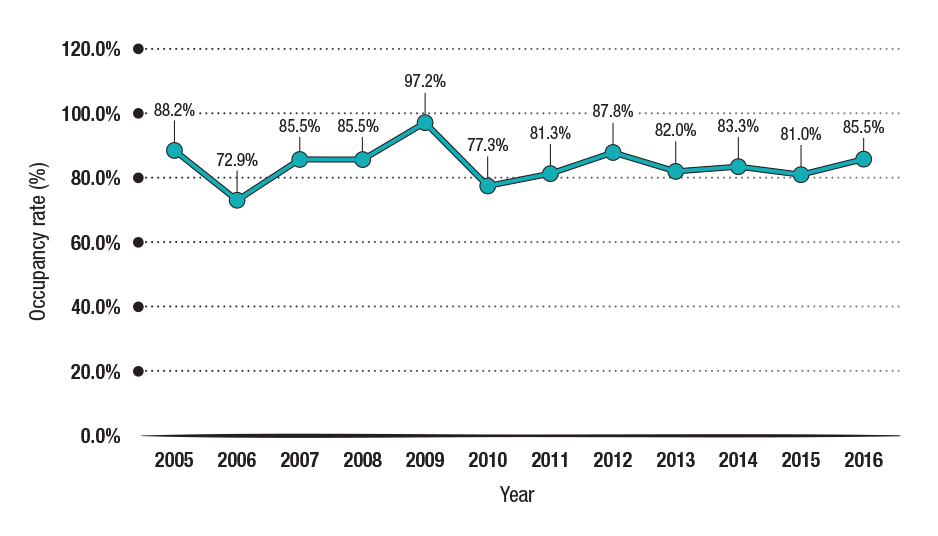
Figure 19: Text description
| Year | Occupancy rate at youth shelters |
|---|---|
| 2005 | 88.2% |
| 2006 | 72.9% |
| 2007 | 85.5% |
| 2008 | 85.5% |
| 2009 | 97.2% |
| 2010 | 77.3% |
| 2011 | 81.3% |
| 2012 | 87.8% |
| 2013 | 82.0% |
| 2014 | 83.3% |
| 2015 | 81.0% |
| 2016 | 85.5% |
Source: Data collected through HIFIS and data sharing agreements
Figure 20 shows the percentage of short, medium and long stays at youth shelters. Short stays (less than 5 days) and medium stays (5 to 30 days) seem to have an inverse relationship and fluctuate over the study period. Longer stays increased slightly over the course of the study period from 14.2% in 2005 to 15.0% in 2016. Shelter stays by youth had a similar duration to those for adults, typically around 10 days in 2016 (see Figure 3).
Figure 20: Stay Length at youth shelters (2005 to 2016)
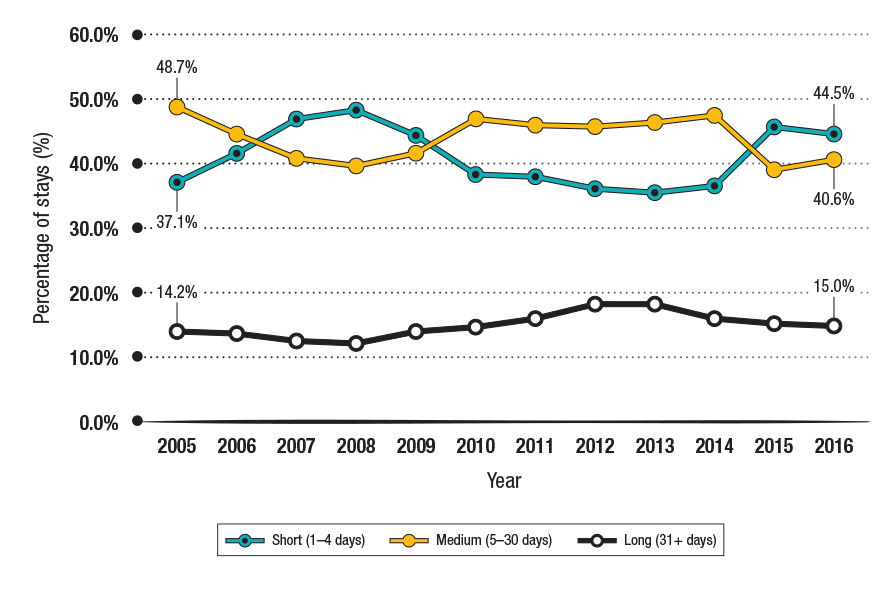
Figure 20: Text description
| Year | Percentage short stays (1 to 4 days) | Percentage medium stays (5 to 30 days) | Percentage long stays (31+ days) |
|---|---|---|---|
| 2005 | 37.1% | 48.7% | 14.2% |
| 2006 | 41.5% | 44.6% | 13.9% |
| 2007 | 46.8% | 40.7% | 12.5% |
| 2008 | 48.3% | 39.6% | 12.1% |
| 2009 | 44.4% | 41.5% | 14.1% |
| 2010 | 38.3% | 47.0% | 14.8% |
| 2011 | 38.0% | 45.9% | 16.1% |
| 2012 | 36.1% | 45.7% | 18.2% |
| 2013 | 35.4% | 46.3% | 18.3% |
| 2014 | 36.4% | 47.4% | 16.2% |
| 2015 | 45.7% | 39.0% | 15.3% |
| 2016 | 44.5% | 40.6% | 15.0% |
Source: Data collected through HIFIS and data sharing agreements
General shelters continue to operate at high capacity
General shelters serve only single adults. Across Canada in 2016, there were 274 general shelters with a capacity of 12,247 beds. Between 2010 and 2014, the occupancy rate at general shelters increased by nearly 10 percentage points (85.4% to 94.9%), surpassing even the spike in occupancy in 2009 (90.7%) that followed the financial recession (see Figure 21). Since 2012, general shelters have consistently operated at over 90% occupancy. In 2016, the average occupancy rate for general shelters was 92.9%.
Figure 21: Average occupancy rate at general shelters (2005 to 2016)
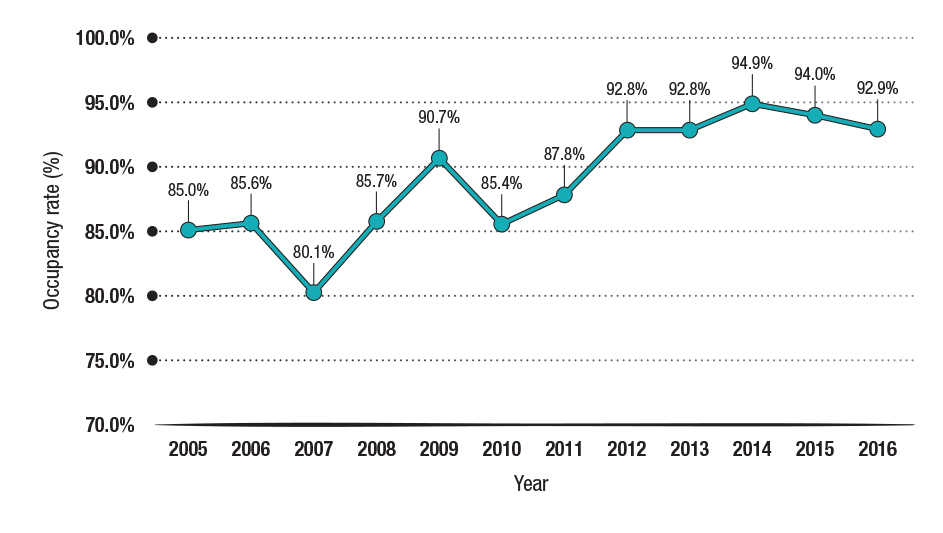
Figure 21: Text description
| Year | occupancy rate at general shelters |
|---|---|
| 2005 | 85.0% |
| 2006 | 85.6% |
| 2007 | 80.1% |
| 2008 | 85.7% |
| 2009 | 90.7% |
| 2010 | 85.4% |
| 2011 | 87.8% |
| 2012 | 92.8% |
| 2013 | 92.8% |
| 2014 | 94.9% |
| 2015 | 94.0% |
| 2016 | 92.9% |
Source: Data collected through HIFIS and data sharing agreements
Figure 22 shows the percentage of short, medium and long stays at general shelters.
Figure 22: Stay length at general shelters (2005 to 2016)

Figure 22: Text description
| Year | Percentage short stays (1 to 4 days) | Percentage medium stays (5 to 30 days) | Percentage long stays (31+ days) |
|---|---|---|---|
| 2005 | 54.8% | 38.1% | 7.2% |
| 2006 | 56.6% | 36.6% | 6.9% |
| 2007 | 55.9% | 36.5% | 7.6% |
| 2008 | 62.0% | 31.4% | 6.5% |
| 2009 | 61.0% | 31.0% | 8.0% |
| 2010 | 50.8% | 39.9% | 9.3% |
| 2011 | 51.3% | 38.8% | 9.9% |
| 2012 | 51.7% | 38.0% | 10.3% |
| 2013 | 49.9% | 38.9% | 11.1% |
| 2014 | 53.6% | 36.9% | 9.5% |
| 2015 | 57.6% | 31.8% | 10.6% |
| 2016 | 56.9% | 31.3% | 11.8% |
Source: Data collected through HIFIS and data sharing agreements
Indigenous people are over-represented in shelters
In 2016 approximately 40,000 shelter users were identified as Indigenous. The number of Indigenous shelter users has not changed significantly since data on Indigenous identity were first collected in 2014 (see Table 6).
| Year | Estimated unique annual shelter users who identify as Indigenous | 95% confidence interval (lower bound) | 95% confidence interval (upper bound) |
|---|---|---|---|
| 2014 | 40,519 | 36,869 | 44,362 |
| 2015 | 41,292 | 35,876 | 47,127 |
| 2016 | 39,694 | 34,463 | 45,340 |
In 2016, there was a higher proportion of shelter use among Indigenous females (37.5%) compared to non-Indigenous females (24.9%). In contrast, 62.2% of Indigenous shelter users were male compared to 73.9% of non-Indigenous shelter users (see Figure 23).
Figure 23: Gender distribution of shelter users by Indigenous identity (2016)
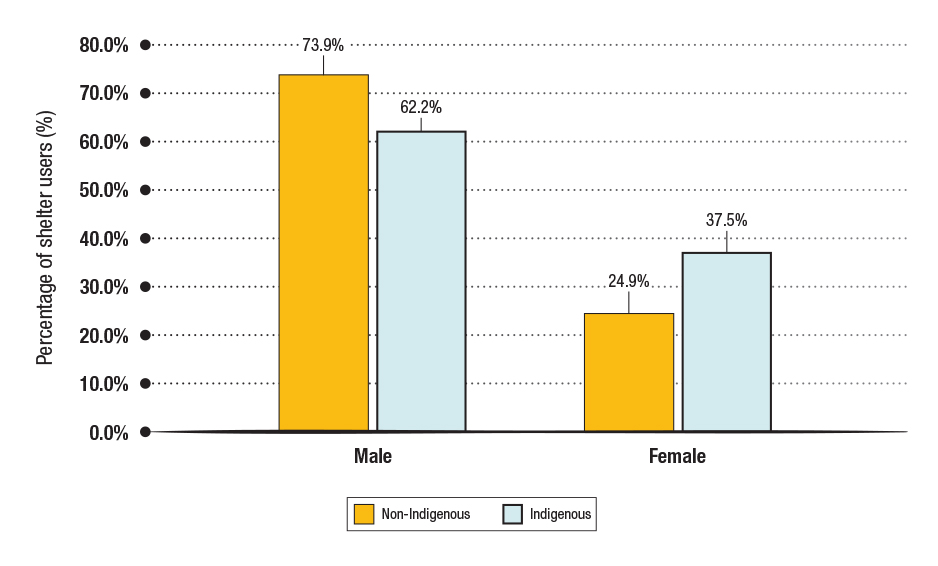
Figure 23: Text description
| Indigenous Identity | Male | Female |
|---|---|---|
| Non-Indigenous | 73.9% | 24.9% |
| Indigenous | 62.2% | 37.5% |
Source: Data collected through HIFIS and data sharing agreements
There are differences in the age distribution of Indigenous shelter users compared to non-Indigenous shelters users (see Figure 24). A higher proportion of Indigenous shelter users were in the 25 to 49 age group (59.3%) compared to non-Indigenous shelter users (52.3%). There was a lower proportion of Indigenous shelter users compared to non-Indigenous users in the following age groups: unaccompanied youth (13 to 24), older adults (50 to 64) and seniors (65+). There was no statistically significant difference between the proportion of accompanied children (0-16) among Indigenous and non-Indigenous shelter users.
Figure 24: Proportion of shelters users by Indigenous identity and age (2016)

Figure 24: Text description
| Age category | Percentage non to Indigenous | Percentage Indigenous |
|---|---|---|
| Children (aged 0 to 16 accompanied by an adult) | 4.2% | 6.0% |
| Youth (aged 13 to 24 and unaccompanied) | 16.8% | 14.4% |
| Adults (aged 25 to 49) | 52.3% | 59.3% |
| Older Adults (aged 50 to 64) | 23.0% | 18.1% |
| Seniors (aged 65 and over) | 3.6% | 2.1% |
Source: Data collected through HIFIS and data sharing agreements
Indigenous people remain over-represented in the shelter population. While Indigenous people represented 4.9% of the Canadian population in 2016 (Statistics Canada, 2017a), 30.7% of all shelter users were identified as Indigenous. In 2016, the rate of shelter use for Indigenous peoples was 8.7 times greater than that of non-Indigenous shelter usersFootnote 10. Indigenous peoples have a higher rate of shelter use in all age groups compared to non-Indigenous shelter users (see Figure 25), with adults (aged 25 to 64) and seniors (aged 65 and over) experiencing particularly high rates. These rates of shelter use differ from those reported in the National Shelter Study 2005 to 2014, but the current results are considered to be more accurate. The 2016 rates are based on more up-to-date data from the 2016 census, while the 2014 ratesFootnote 11were based on census population information from the last full census in 2006.
Figure 25: Rate of shelter use for Indigenous compared to non-Indigenous people (2016)
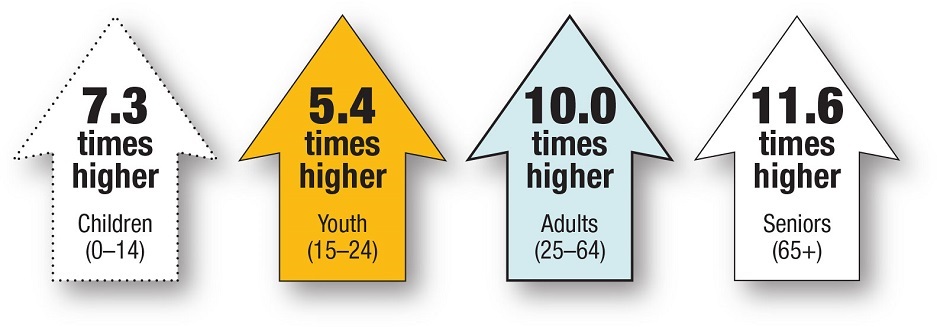
Figure 25: Text description
| Age category | Rate of shelter user for Indigenous people compared to non to Indigenous people |
|---|---|
| Children (aged 0 to 14) | 7.3 |
| Youth (aged 15 to 24) | 5.4 |
| Adults (aged 25 to 64) | 10.0 |
| Seniors (aged 65 and over) | 11.6 |
Sources:
- Data collected through HIFIS and data sharing agreements
- Statistics Canada. 2017a. Aboriginal Peoples Highlight Tables, 2016 Census. Statistics Canada Catalogue no. 98 to 402 to X2016009. Ottawa.
The percentage of shelter users who reported Indigenous identity varied widely by community, from less than 5% in some suburban communities to over 90% in many northern communities. In each of the communities included in this study, Indigenous people were over-represented in homeless shelters compared to their proportion in the general population of the community. The distribution of Indigenous people varies across the country, with higher concentrations in the Prairies and the North (Statistics Canada, 2017a). Regardless, Indigenous people were over-represented in the shelter population in all regions, with the highest over-representation in the Prairies, where 68.0% of shelter users are Indigenous compared to 10.4% of the total population (see Figure 26).
Figure 26: Percentage of Indigenous shelter users vs percentage of Indigenous population, by region (2016)
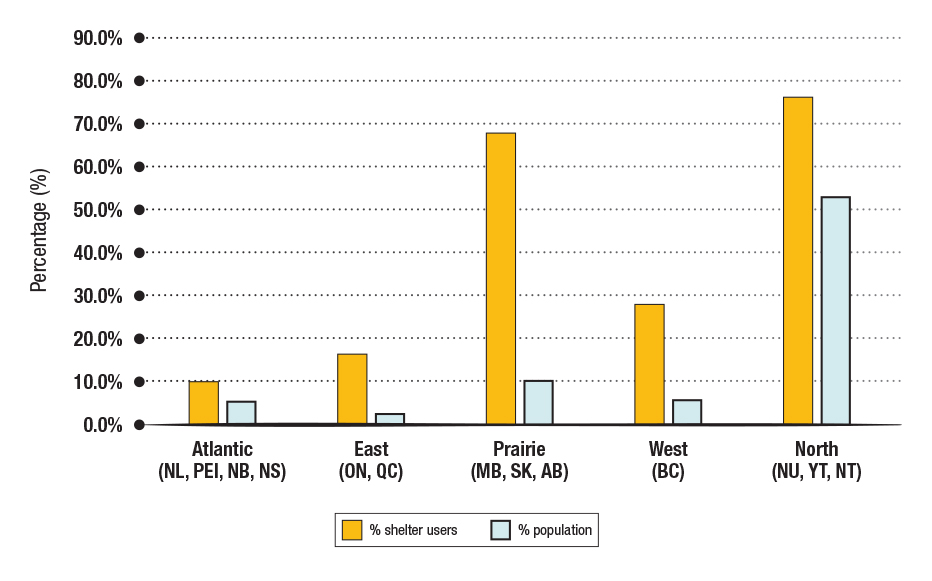
Figure 26: Text description
| Region | Percentage of shelter users who identify as Indigenous | Percentage of Indigenous people in the regional population |
|---|---|---|
| Atlantic (NL, PEI, NB, NS) | 10.3% | 5.6% |
| East (ON, QC) | 16.5% | 2.6% |
| Prairie (MB, SK, AB) | 68.0% | 10.4% |
| West (BC) | 28.3% | 5.9% |
| North (NU, YT, NT) | 76.6% | 53.3% |
Sources:
- Data collected through HIFIS and data sharing agreements
- Statistics Canada. 2017a. Aboriginal Peoples Highlight Tables, 2016 Census. Statistics Canada Catalogue no. 98 to 402 to X2016009. Ottawa.
Over 2,300 shelter users reported having served in the military
In 2016, 1.8% of shelter users (an estimated 2,340 peopleFootnote 12) reported having served in the military. This is down from nearly 3,000 (2.2%) in 2014, the first year this information was collected.
Similar to findings from 2014, shelter users reporting military service were more likely to be male (84.4%) compared to female (15.5%). Males reporting military service tended to be older on average than other shelter users. Conversely, over half of females reporting military service were under the age of 40 (see Figure 27). There was no significant difference in the length of stay between shelter users with and without military service.
Figure 27 A: Age distribution for males, by military service status (2016)
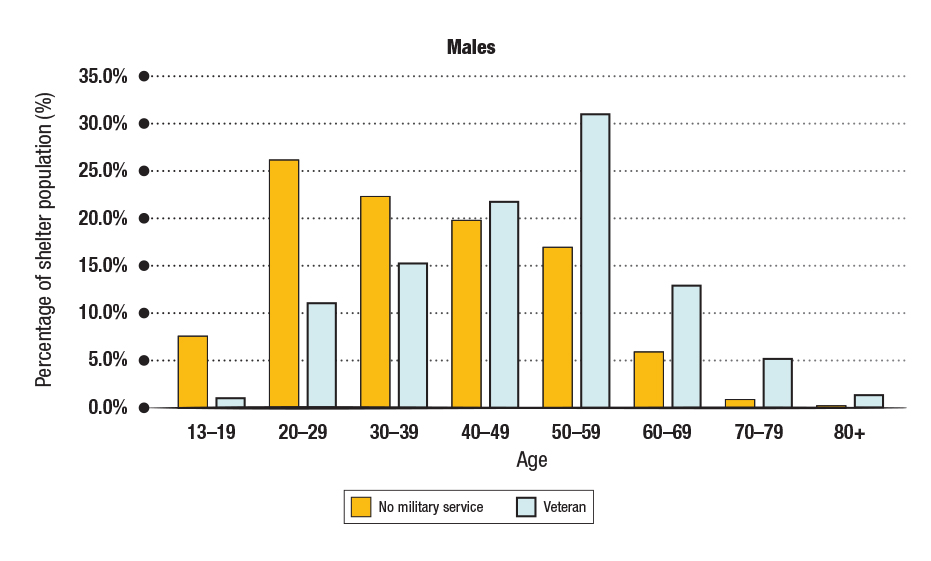
Figure 27 A: Text description
| Age group | Male, no military service (%) |
Male, veteran (%) |
|---|---|---|
| 13 to 19 | 7.5% | 1.0% |
| 20 to 29 | 26.2% | 11.1% |
| 30 to 39 | 22.5% | 15.4% |
| 40 to 49 | 19.9% | 21.9% |
| 50 to 59 | 17.0% | 31.1% |
| 60 to 69 | 5.9% | 13.0% |
| 70 to 79 | 0.9% | 5.3% |
| 80+ | 0.1% | 1.3% |
Sources: Data collected through HIFIS and data sharing agreements
Figure 27 B: Age distribution for females, by military service status (2016)

Figure 27 B: Text description
| Age group | Female, No Military Service (%) |
Female, Veteran (%) |
|---|---|---|
| 13 to 19 | 16.2% | 6.0% |
| 20 to 29 | 28.8% | 35.0% |
| 30 to 39 | 21.8% | 13.1% |
| 40 to 49 | 16.8% | 14.9% |
| 50 to 59 | 12.0% | 17.7% |
| 60 to 69 | 3.4% | 9.5% |
| 70 to 79 | 0.9% | 3.6% |
| 80+ | 0% | 0% |
Sources: Data collected through HIFIS and data sharing agreements
Over 7,600 non-citizens used a shelter in 2016
In 2016 5.9% of shelter users reported that they were not a Canadian citizen (up from 4.9% in 2014). This includes 5,067 permanent residents or immigrants, 1,991 refugees and 558 temporary residents (student, work or visitor visa) (see Table 7). While refugee shelters were not included in this analysis, there was an increase in the number of refugees and refugee claimants in 2016 compared to 2014. Canadian citizens and non-citizens did not have significantly different lengths of shelter staysFootnote 13. Regardless, non-Canadians are slightly under-represented in the shelter system (5.9%) compared to the general population (7.0%) (Statistics Canada, 2017b).
| Citizenship status | Estimated number and proportion of shelter users (2014) | Estimated number and proportion of shelter users (2016) |
|---|---|---|
| Permanent Resident/Immigrant | 5,036 (3.7%) | 5,067 (3.9%) |
| Refugee | 412 (0.3%) | 744 (0.6%) |
| Refugee Claimant | 683 (0.5%) | 1,247 (1%) |
| Student Visa | 150 (0.1%) | 190 (0.1%) |
| Visitor Visa | 229 (0.2%) | 252 (0.2%) |
| Work Visa | 183 (0.1%) | 116 (0.1%) |
| Unknown/undeclared status | 7,210 (5.3%) | 5,095 (4.0%) |
Summary and conclusion
In 2016 the estimated number of shelter users was at its lowest in the past 12 years. The annual number of individuals using shelters has fallen from approximately 156,000 in 2005 to 129,000 in 2016.
Despite a decrease in shelter users, occupancy rates have increased since 2005 and have consistently remained above 90% since 2012. There are still more than 14,000 Canadians using an emergency shelter on an average night.
Stay lengths have increased for all shelter users, regardless of age category, especially for those over 50 years old.
In 2016, 69.5% of shelter users were male and 29.7% were female. The gender distribution among shelter users has not changed significantly between 2005 and 2016.
The average age of emergency shelter users was 39.5 years in 2016. Females tended to be younger (37.0 years) compared to male shelter users (40.5 years).
Shelter use by families has remained relatively consistent since 2011 with occupancy rates hovering between about 84% and 90%. However, there has been a marked increase in stay lengths for families, which continued in 2016. Families typically stay in a shelter almost twice as long as individuals.
Indigenous peoples remain over-represented among shelter users, with approximately 30% of shelter users identifying as Indigenous.
References
Burczycka, Marta and Adam Cotter. 2011. Shelters for Abused Women in Canada, 2010. Statistics Canada.
Employment and Social Development Canada. 2014. Homelessness Partnering Strategy Directives 2014-2019. Retrieved from https://www.canada.ca/en/employment-social-development/services/funding/homeless/homeless-directives.html.
Employment and Social Development Canada. 2016. Shelter Capacity Report 2016. Retrieved from https://www.canada.ca/en/employment-social-development/programs/homelessness/publications-bulletins/shelter-capacity-2016.html
Gaetz, Stephen, Bill O’Grady, Sean Kidd and Kaitlin Schwan. 2016. Without a Home: The National Youth Homelessness Survey. Toronto: Canadian Observatory on Homelessness Press.
Hwang, S.W., R. Wilkins, M. Tjepkema, P.J. O'Campo and J.R. Dunn. 2009. Mortality among residents of shelters, rooming houses, and hotels in Canada: 11 year follow-up study. BMJ 339:b4036.
McDermott, S., Harding, A., Randle, J. (2019). The characteristics of shelter residents. Statistics Canada Catalogue no. 75F0002M. Ottawa.
Retrieved from https://www150.statcan.gc.ca/n1/pub/75f0002m/75f0002m2019004-eng.htm. (accessed September 22, 2019)
Moreau, Greg. (2019). Canadian residential facilities for victims of abuse, 2017/2018. Statistics Canada Catalogue no. 85-002-X. Ottawa.
Retrieved from https://www150.statcan.gc.ca/n1/pub/85-002-x/2019001/article/00007-eng.htm. (accessed September 22 2019).
Segaert, Aaron. 2010. Usage Patterns at Emergency, Transitional, Violence Against Women, and Family Shelters. Presentation at National Housing Research Committee, Fall 2010.
Segaert, Aaron. 2013. The National Shelter Study: Emergency shelter Use in Canada 2005-2009. Ottawa: Homelessness Partnering Secretariat, Human Resources and Skills Development Canada.
Segaert, Aaron and Alana Bauer. 2016. The Extent and Nature of Veteran Homelessness in Canada. Ottawa: Employment and Social Development Canada.
Statistics Canada. 2017a. Aboriginal Peoples Highlight Tables, 2016 Census. Statistics Canada Catalogue no. 98-402-X2016009. Ottawa.
Retrieved from https://www12.statcan.gc.ca/census-recensement/2016/dp-pd/hlt-fst/abo-aut/Table.cfm?Lang=Eng&S=99&O=A&RPP=25. (accessed September 22, 2019)
Statistics Canada. 2017b. Citizenship (9), Immigrant Status and Period of Immigration (11A), Age (12) and Sex (3) for the Population in Private Households of Canada, Provinces and Territories, 2016 Census - 25% Sample Data. Statistics Canada Catalogue no. 98-400-X2016186. Ottawa.
Retrieved from https://www12.statcan.gc.ca/census-recensement/2016/dp-pd/dt-td/Rp-eng.cfm?TABID=2&LANG=E&A=R&APATH=3&DETAIL=0&DIM=0&FL=A&FREE=0&GC=01&GL=-1&GID=1334853&GK=1&GRP=1&O=D&PID=110527&PRID=10&PTYPE=109445&S=0&SHOWALL=0&SUB=0&Temporal=2017&THEME=120&VID=0&VNAMEE=&VNAMEF=&D1=0&D2=0&D3=0&D4=0&D5=0&D6=0. (accessed September 22, 2019)
Statistics Canada. n.d. Table 17-10-0005-01 Population estimates on July 1st, by age and sex. Statistics Canada. Ottawa.
Retrieved from https://www150.statcan.gc.ca/t1/tbl1/en/cv.action?pid=1710000501#timeframe. (accessed September 22 2019)
Glossary
- Adult
- Person between the ages of 25 and 49.
- Bednights
- The number of times a shelter bed is used in a year.
- Child
- Any person under the age of 13 or a person between the ages of 13 and 16 that is accompanied by a parent or guardian during their episode of homelessness.
- Emergency shelter
- Facility that provides temporary, short-term accommodation for homeless individuals and families. This may or may not include other services such as food, clothing or counselling.
- Homelessness
- The living situation of an individual or family who does not have stable, permanent, appropriate housing, or the immediate prospect, means and ability of acquiring a home.
- Family
- People who report being in the company of one or more family members during their episode of homelessness.
- Family shelter
- Facility that provides temporary, short-term accommodation specifically for families.
- Immigrant
- A landed immigrant/permanent resident is a person who has been granted the right to live in Canada permanently by immigration authorities. This is self-reported at time of shelter-entry.
- Homeless Individuals and Families Information System (HIFIS)
- Developed by ESDC in collaboration with communities, the Homeless Individuals and Families Information System (HIFIS) is a comprehensive data collection, reporting and case management system that supports the day-to-day operations of housing and homelessness response service providers.
- Homelessness Management Information System (HMIS)
- An information technology system used to collect client-level data and data on the provision of housing and services to homeless individuals and families and persons at risk of homelessness.
- Indigenous people
- People who self-report as being a First Nations, Métis, Inuit, status or non-status person, regardless of residency or membership status.
- Indigenous homelessness
- Refers to Indigenous Peoples who are in the state of having no home due to colonization, trauma and/or whose social, cultural, economic, and political conditions place them in poverty. Having no home includes those who alternate between shelter and unsheltered, living on the street, couch surfing, using emergency shelters, living in unaffordable, inadequate, substandard and unsafe accommodations or living without the security of tenure; anyone regardless of age, released from facilities (such as hospitals, mental health and addiction treatment centers, prisons, transition houses), fleeing unsafe homes as a result of abuse in all its definitions, and any youth transitioning from all forms of care.
- Individual
- Person who is not part of a family with children during an episode of homelessness. Individuals may be homeless as single adults, unaccompanied youth, or in multiple-adult or multiple-child households.
- Point in Time (PiT) Counts
- PiT counts provide a one-day snapshot of homelessness in a community, including people experiencing homelessness in shelters, unsheltered locations and transitional housing.
- Older adult
- Person between the ages of 50 and 64.
- Seasonal/Temporary/Emergency weather response shelters
- Facilities that open temporarily to provide additional seasonal, emergency shelter spaces during period of extreme weather (winter, storm, heat, etc.).
- Senior
- People aged 65 and older.
- Service provider
- An organization that provides services to homeless individuals and families and persons at risk of homelessness.
- Shelter users
- Individuals and families who use the emergency shelter system in Canada.
- Transitional housing
- Facilities that provide temporary shelter, but can be differentiated from emergency shelters by the longer length of stay and greater intensity of support services offered to clients. Transitional housing is an intermediate step between emergency shelter and permanent housing. Stays are typically between 3 months and 3 years.
- Youth
- Person between the ages of 13 and 16 who is unaccompanied by a parent or guardian during their episode of homelessness. People between the ages of 17 and 24 are considered to be youth regardless of accompaniment status.
- Veteran
- A former member of the Canadian Armed Forces. This is self-reported at time of shelter-entry.
- Canadian citizen
- Person who was born in Canada or became a citizen through Canada’s naturalization process. This is self-reported at time of shelter-entry.
- Refugee
- Person who has been offered refugee protection in Canada who fear persecution and who are unwilling or unable to return to their home country. This is self-reported at time of shelter-entry.
- Refugee claimant
- A person who has claimed refugee protection in Canada. This is self-reported at time of shelter-entry.
- Refugee shelter
- Facility that provides temporary accommodations specifically to refugees, refugee claimants or immigrants.
- Permanent resident
- Person who has been given permanent resident status by immigrating to Canada, but is not a Canadian citizen. This is self-reported at time of shelter-entry.
- Visa holder
- Person who has been granted admission to Canada as a temporary resident (a visitor, student or worker).
- Violence against women shelter
- Facility that provides temporary shelter to single women or women with children fleeing domestic abuse. They may function in either a crisis capacity or as transitional or second-stage housing.
Annexe A: The Homeless Individuals and Families Information System (HIFIS)
Developed by ESDC in collaboration with communities, the Homeless Individuals and Families Information System (HIFIS) is a comprehensive data collection, reporting and case management system that supports the day-to-day operations of housing and homelessness response service providers. HIFIS is designed to support coordinated access by allowing multiple service providers from the same community to access real-time homelessness data through a community-wide system available via web-enabled devices, such as laptops, smartphones and tablets. HIFIS also allows communities to document the number, characteristics and needs of homeless individuals and families, as well as the number of people receiving services.
HIFIS is a leading tool for building homelessness sector intelligence. By adopting HIFIS, communities acquire the capacity to collect and analyze homelessness sector information that can be used to monitor existing trends, identify arising ones and, more generally, support decision-making. ESDC receives non-identifiable data through a Data Provision Agreement with shelters and communities that use HIFIS. By providing their data to ESDC, HIFIS users also contribute to building knowledge and advancing the understanding of homelessness in Canada
The HIFIS fields
- Service provider name
- Service provider type
- Community
- Number of beds
- Bed type
- Book-in date
- Book-out date
- Reason for service
- Reason for discharge
- Unique client identifier
- Gender
- Date of Birth
- Citizenship*
- Aboriginal status*
- Country of origin*
- Veteran status*
- Family role
- Health factors*
- Contributing factors*
- Employment*
- Education*
- Income*
- Housing history*
- Turnaway info
* Collected since 2014
Report a problem on this page
- Date modified: