
Shelter Capacity Report 2021
Shelter Capacity Report 2021
On this page
- List of figures
- List of tables
- Acknowledgements
- Introduction
- Scope of the data
- Types of shelters
- Clientele served
- National Summary: Emergency shelter capacity, 2019-2021
- Number of emergency shelters and permanent beds by province and territory, 2021
- Impact of the COVID-19 pandemic on emergency shelter capacity
- Distribution of emergency shelters and beds by community size, 2021
- Emergency shelter capacity to population ratio - Number of emergency shelter beds per 10,000 population
- Emergency shelters capacity by clientele served, per province and territory, 2021
- National summary: Change in emergency shelter beds by clientele served, 2019-2021
- Appendix A: Transitional housing capacity, by province and territory, 2019-2021
- Appendix B: Transitional housing capacity by clientele served, per province and territory, 2021
- Appendix C: Domestic violence shelter capacity, by province and territory, 2019-2021
- Appendix D: Domestic violence shelter capacity by clientele served, per province and territory, 2021
- Appendix E: Glossary
- Related data
- References
List of figures
- Figure 1: Number of emergency shelters and permanent beds in Canada, 2019-2021
- Figure 2: Number of emergency shelter beds by province and territory, 2021
- Figure 3: Impact of COVID-19 - Number of emergency beds by province and territory, 2019-2021
- Figure 4: Distribution of emergency shelters and permanent beds by community size (population of more, or less than 100,000), Canada, 2021
- Figure 5: Number of emergency shelter beds per 10,000 population, 2019-2021
- Figure 6: Number of emergency shelter beds per 10,000 population, 2021
- Figure 7: Number of emergency shelter beds by clientele served, Canada, 2019-2021
List of tables
- Table 1: Number of emergency shelters and beds by province and territory, 2019-2021
- Table 2: Number of emergency shelters and permanent beds by clientele served, per province and territory, 2021
- Table 3: Number of transitional housing facilities and permanent beds, by province and territory, 2019-2021
- Table 4: Number of transitional housing facilities and permanent beds, by clientele served, per province and territory, 2021
- Table 5: Number of domestic violence shelters and permanent beds, by province and territory, 2019-2021
- Table 6: Number of domestic violence shelters and permanent beds by clientele served, per province and territory, 2021
Acknowledgements
We would like to thank service providers and communities across Canada for their collaboration in the development of the National Service Provider List. This support is key to advancing the understanding of homelessness in Canada.
Introduction
The Shelter Capacity Report is an annual descriptive account of capacity statistics for emergency homeless shelters in Canada. The report provides information on the number of emergency shelter facilities and permanent beds by province and territory, incorporating census population data and classifying services by clientele served. It also includes an overview of statistics on transitional housing facilities and domestic violence shelters. The statistics are obtained from The National Service Provider List, which includes information on shelter and other homelessness services from across Canada, and is maintained by the Homelessness Policy Directorate of Infrastructure Canada.
Scope of the data
The 2021 shelter capacity data reflects the capacity as of December 31, 2021. This report only includes emergency shelters, transitional housing facilities and domestic violence shelters facilities. Shelters must also meet the following criteria:
- Operational year-round with free emergency permanent beds
- Open as of year end (December 31, 2021)
Some shelter services are not included in the analysis, including:
- Temporary emergency shelters, including COVID-19 response shelters
- Supportive housing facilities
- Immigrant and refugee shelters
- Correctional services
Shelters providing services under the same umbrella organization but to different target populations and/or genders, even if located at the same address, are listed as separate shelters.
Shelters that provide services of different types at the same location, such as offering both emergency services and transitional beds, are listed as separate services in the National Service Provider List due to the nature of the service.
The report also presents statistics from 2019 and 2020 to examine trends in the shelter system. The 2020 statistics represent capacity data as of February 2020 (prior to the COVID-19 pandemic) instead of December 2020. The 2019 results follow the same shelter criteria as the 2021 statistics (open as of year end).
Types of shelters
Emergency shelters
A permanent facility that provides temporary, short-term accommodation (typically less than 3 months in duration) for homeless individuals and families. There is no cost to service users and no referral or entry application is necessary to access the service. Counselling, treatment and other support services including food and clothing may be available to the people who access the service, but participation is not mandatory. Often, only a place to sleep is provided.
Transitional housing
Facilities that provide temporary, longer-term accommodation for individuals and/or families experiencing homelessness or at risk of homelessness. Transitional housing is typically an intermediate step between emergency shelter and permanent housing. They differ from emergency shelters by allowing a longer length of stay and greater intensity of support services. Stays typically last between 3 months and 3 years.
Domestic violence shelters
Facilities that provide temporary accommodation (emergency beds) to individuals and/or families fleeing domestic abuse or the threat of violence that functions either as a crisis capacity or as transitional/second stage housing (i.e. units designed to provide transitional accommodation when a client does not return to their previous residence).
Clientele served
General shelters
Provide services to adults of all genders. Some also accept youth of all genders.
Men's shelters
Provide services to adults identifying as men. Some also accept boys.
Women's shelters
Provide services to adults identifying as women. Some also accept girls.
Youth shelters
Provide services to youth. Some serve all genders, others only serve girls/women or boys/men. Shelters have varying definitions of youth, often ranging from 12 to 29 years of age.
Family shelters
Provide services to families and adults with dependents. Some also accept single adult women without dependents.
National Summary: Emergency shelter capacity, 2019-2021
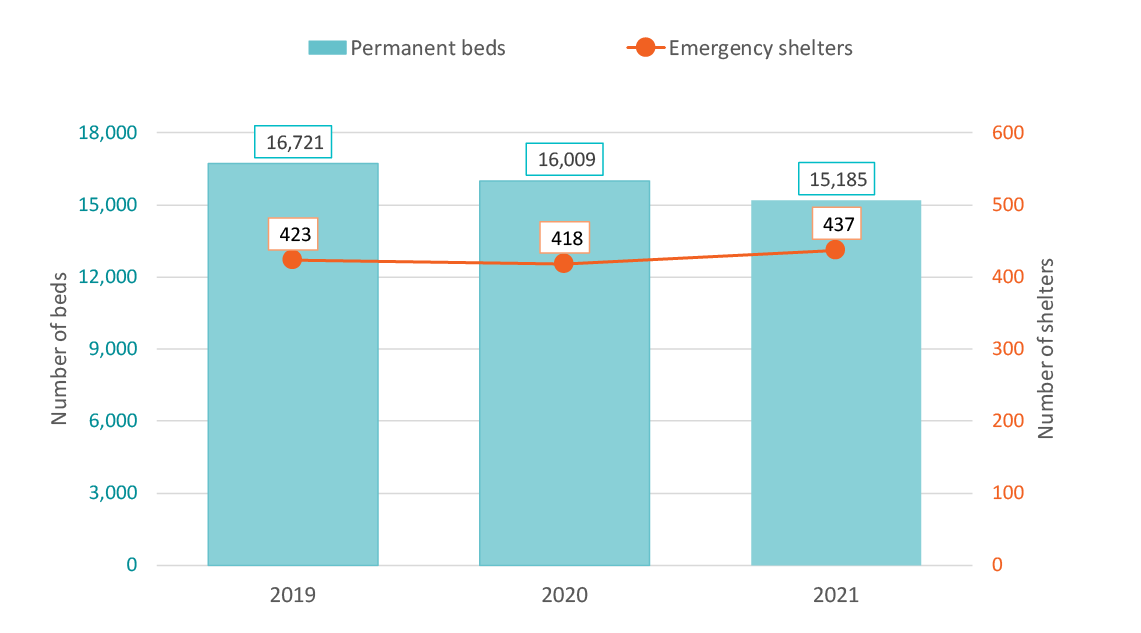
There was a national reduction of 824 permanent emergency beds from 2020 to 2021 (a 5.1% decrease). This corresponds to bed capacity changes between February 2020 and December 2021.
Changes in number of shelters and beds are the results of a variety of changes in the system within a year period (and almost two years between the 2020 and 2021 data collected) including: opening and closure of shelters, changes or updates in the shelter type of a service, and the separation or collapsing of services' capacity information based on the level of detail that service provider are able to provide.
Figure 1: Number of emergency shelters and permanent beds in Canada, 2019-2021
-
Figure 1 - Text version
Year Number of permanent beds Number of emergency shelters 2019 16,721 423 2020 16,009 418 2021 15,185 437
Number of emergency shelters and permanent beds by province and territory, 2021
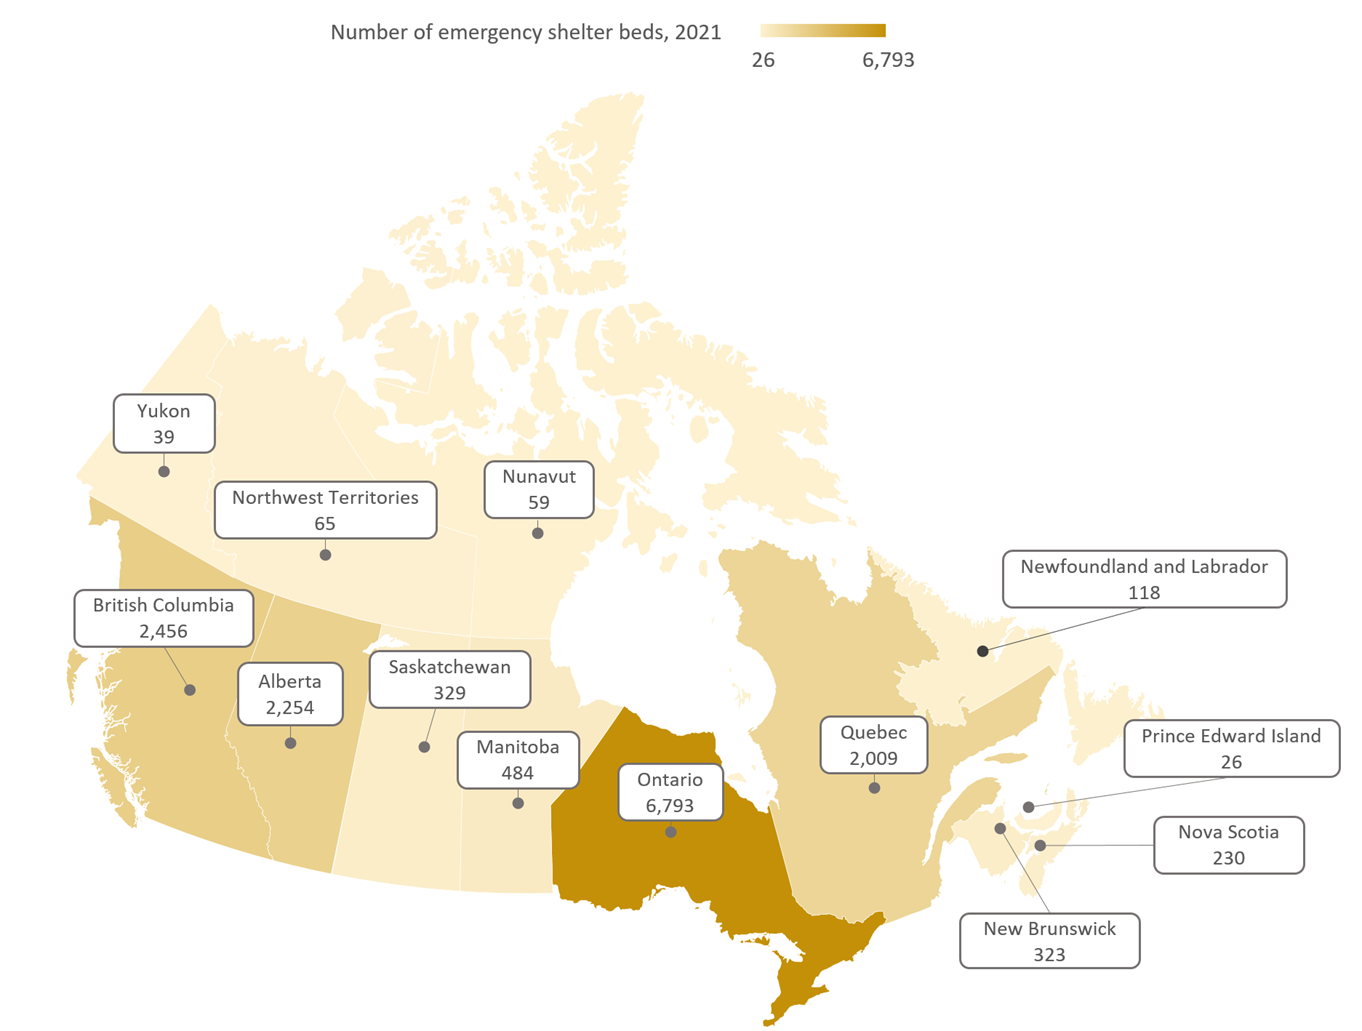
The majority of shelter beds (89%) are in the provinces of Ontario (45%), British Columbia (16%), Alberta (15%), and Quebec (13%). These provinces account for 86% of the Canadian population in 2021 (Census, 2021).
- Almost half of all emergency shelter beds (45%) are located in Ontario, where 38% of the population is found.
- While Quebec has 23% of the population, 13% of shelter beds are found in the province.
Figure 2: Number of emergency shelter beds by province and territory, 2021
-
Figure 2 - Text version
Province and territory Number of emergency shelter beds, 2021 Newfoundland and Labrador 118 Prince Edward Island 26 Nova Scotia 230 New Brunswick 323 Quebec 2,009 Ontario 6,793 Manitoba 484 Saskatchewan 329 Alberta 2,254 British Columbia 2,456 Yukon 39 Northwest Territories 65 Nunavut 59 Canada 15,185
| Province and territory | Shelters | Beds | ||||
|---|---|---|---|---|---|---|
| 2019 | 2020 | 2021 | 2019 | 2020 | 2021 | |
| Newfoundland and Labrador | 14 | 14 | 14 | 146 | 125 | 118 |
| Prince Edward Island | 1 | 2 | 3 | 7 | 18 | 26 |
| Nova Scotia | 11 | 11 | 11 | 225 | 243 | 230 |
| New Brunswick | 8 | 8 | 9 | 180 | 253 | 323 |
| Quebec | 76 | 74 | 92 | 1,901 | 1,658 | 2,009 |
| Ontario | 159 | 160 | 157 | 7,175 | 7,351 | 6,793 |
| Manitoba | 12 | 16 | 19 | 403 | 436 | 484 |
| Saskatchewan | 17 | 15 | 16 | 483 | 407 | 329 |
| Alberta | 38 | 30 | 26 | 3,258 | 2,784 | 2,254 |
| British Columbia | 79 | 79 | 81 | 2,336 | 2,534 | 2,456 |
| Yukon | 3 | 3 | 3 | 39 | 59 | 39 |
| Northwest Territories | 3 | 3 | 3 | 82 | 88 | 65 |
| Nunavut | 2 | 3 | 3 | 36 | 53 | 59 |
| Canada | 423 | 418 | 437 | 16,271 | 16,009 | 15,185 |
Impact of the COVID-19 pandemic on emergency shelter capacity
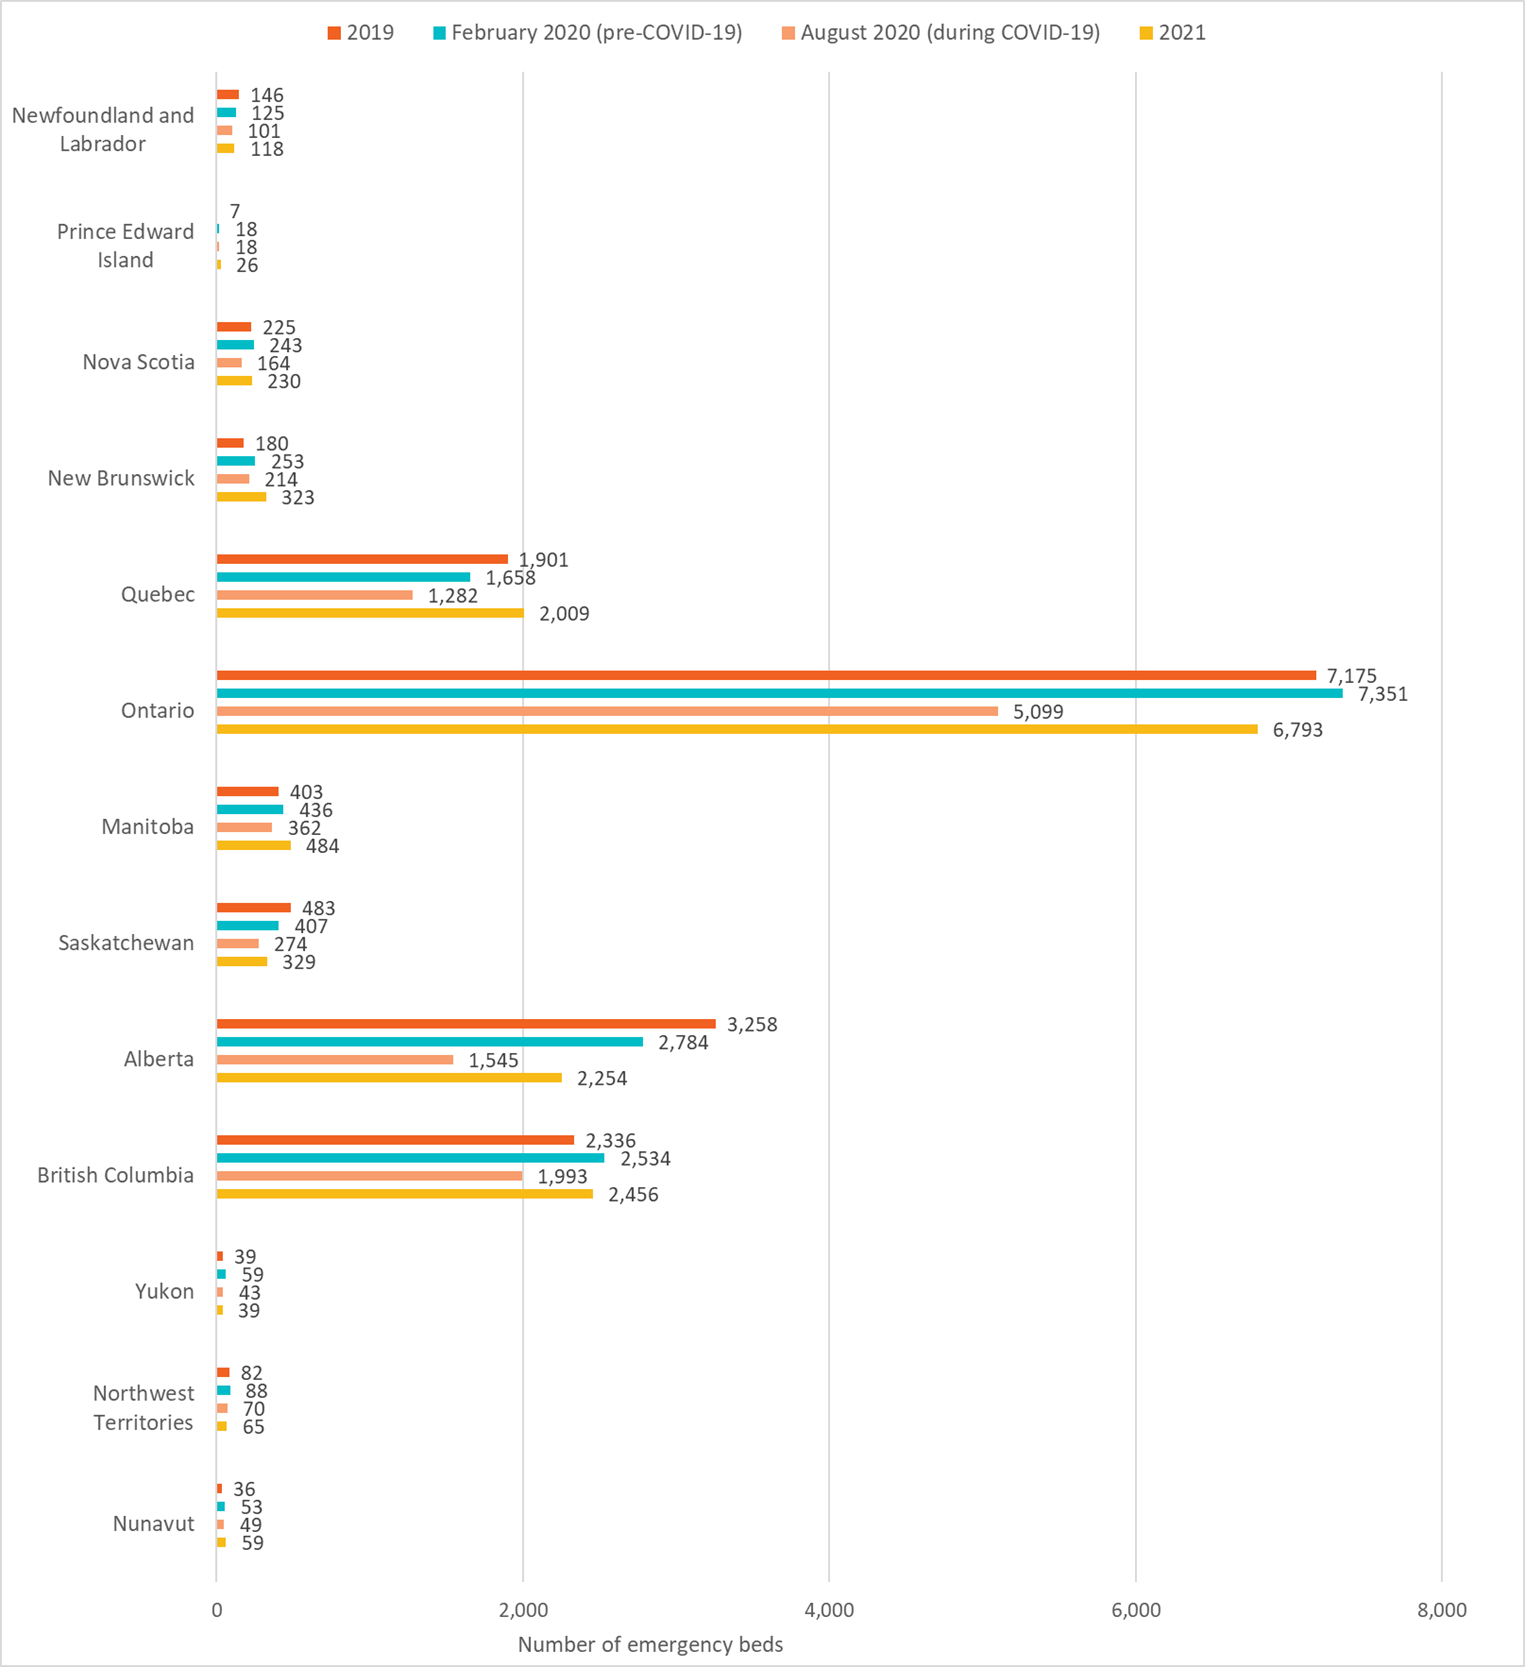
Permanent shelter capacity for the year 2020 was collected at two points in the year: February 2020 ("pre-COVID-19") and August 2020 ("during COVID-19"). The February 2020 data has been reported in the 2020 Shelter Capacity Report and the 2020 National Service Provider List.
The capacity data collected during the COVID-19 pandemic (August 2020) shows that bed capacity reduced significantly across most jurisdictions (an average reduction of 22%) due in part to isolation and physical distancing protocols. Many shelters were able to extend their services to temporary locations such as leased hotels/motels. However, beds corresponding to these COVID-19 temporary response sites are not included in this analysis as they are not offered on a permanent basis.
Results show that by the end of 2021 some jurisdictions including Nunavut, Prince Edward Island, New Brunswick, Manitoba, and Quebec had more emergency shelter beds than before the pandemic. This demonstrates a gradual stabilization of bed capacity from the effects brought on by the COVID-19 pandemic.
Figure 3 demonstrates provincial bed capacity changes between 2019 and 2021. Only permanent emergency beds are included in the total count of beds available. For bed capacity corresponding to August 2020, 85% of shelters provided an actual capacity figure for their services. In order to estimate the missing capacities, internal shelter usage data was used, taking averages of shelter user numbers in 2019 and 2020. A COVID-19 adjustment factor was calculated and applied to the existing February 2020 capacity of those services with missing August 2020 data. Therefore, the August 2020 capacity totals are a sum of actual values and approximated values.
Figure 3: Impact of COVID-19 - Number of emergency beds by province and territory, 2019-2021
-
Figure 3 - Text version
Province and territory 2019 February 2020
(pre-COVID-19)August 2020
(during COVID-19)2021 Newfoundland and Labrador 146 125 101 118 Prince Edward Island 7 18 18 26 Nova Scotia 225 243 164 230 New Brunswick 180 253 214 323 Quebec 1,901 1,658 1,282 2,009 Ontario 7,175 7,351 5,099 6,793 Manitoba 403 436 362 484 Saskatchewan 483 407 274 329 Alberta 3,258 2,784 1,545 2,254 British Columbia 2,336 2,534 1,993 2,456 Yukon 39 59 43 39 Northwest Territories 82 88 70 65 Nunavut 36 53 49 59
Distribution of emergency shelters and beds by community size, 2021
The majority of permanent emergency beds were found in large communities. For the purpose of this analysis, a large community is one with a population equal to or greater than 100,000 persons and a small community is of less than 100,000 persons, with the Population Centre and Rural Area Classification (Statistic Canada, 2021) used as geographical framework. The total 2021 population for all communities (130) with permanent emergency shelter capacity was 25,118,511, where 88% was found in large communities and 12% in small communities. The results in Figure 4 below indicate that the proportion of beds found in large communities (83%) is slightly less than their indicated populations, but nevertheless proportional. Results also indicate that shelters in smaller communities tend to have less capacity.
Figure 4: Distribution of emergency shelters and permanent beds by community size (population of more, or less than 100,000), Canada, 2021

-
Figure 4 - Text version
Proportion of shelters and beds by community size Large population centres Small and medium population centres, and rural areas Percentage of all beds 83% 17% Percentage of all shelters 65% 35%
Emergency shelter capacity to population ratio - Number of emergency shelter beds per 10,000 population
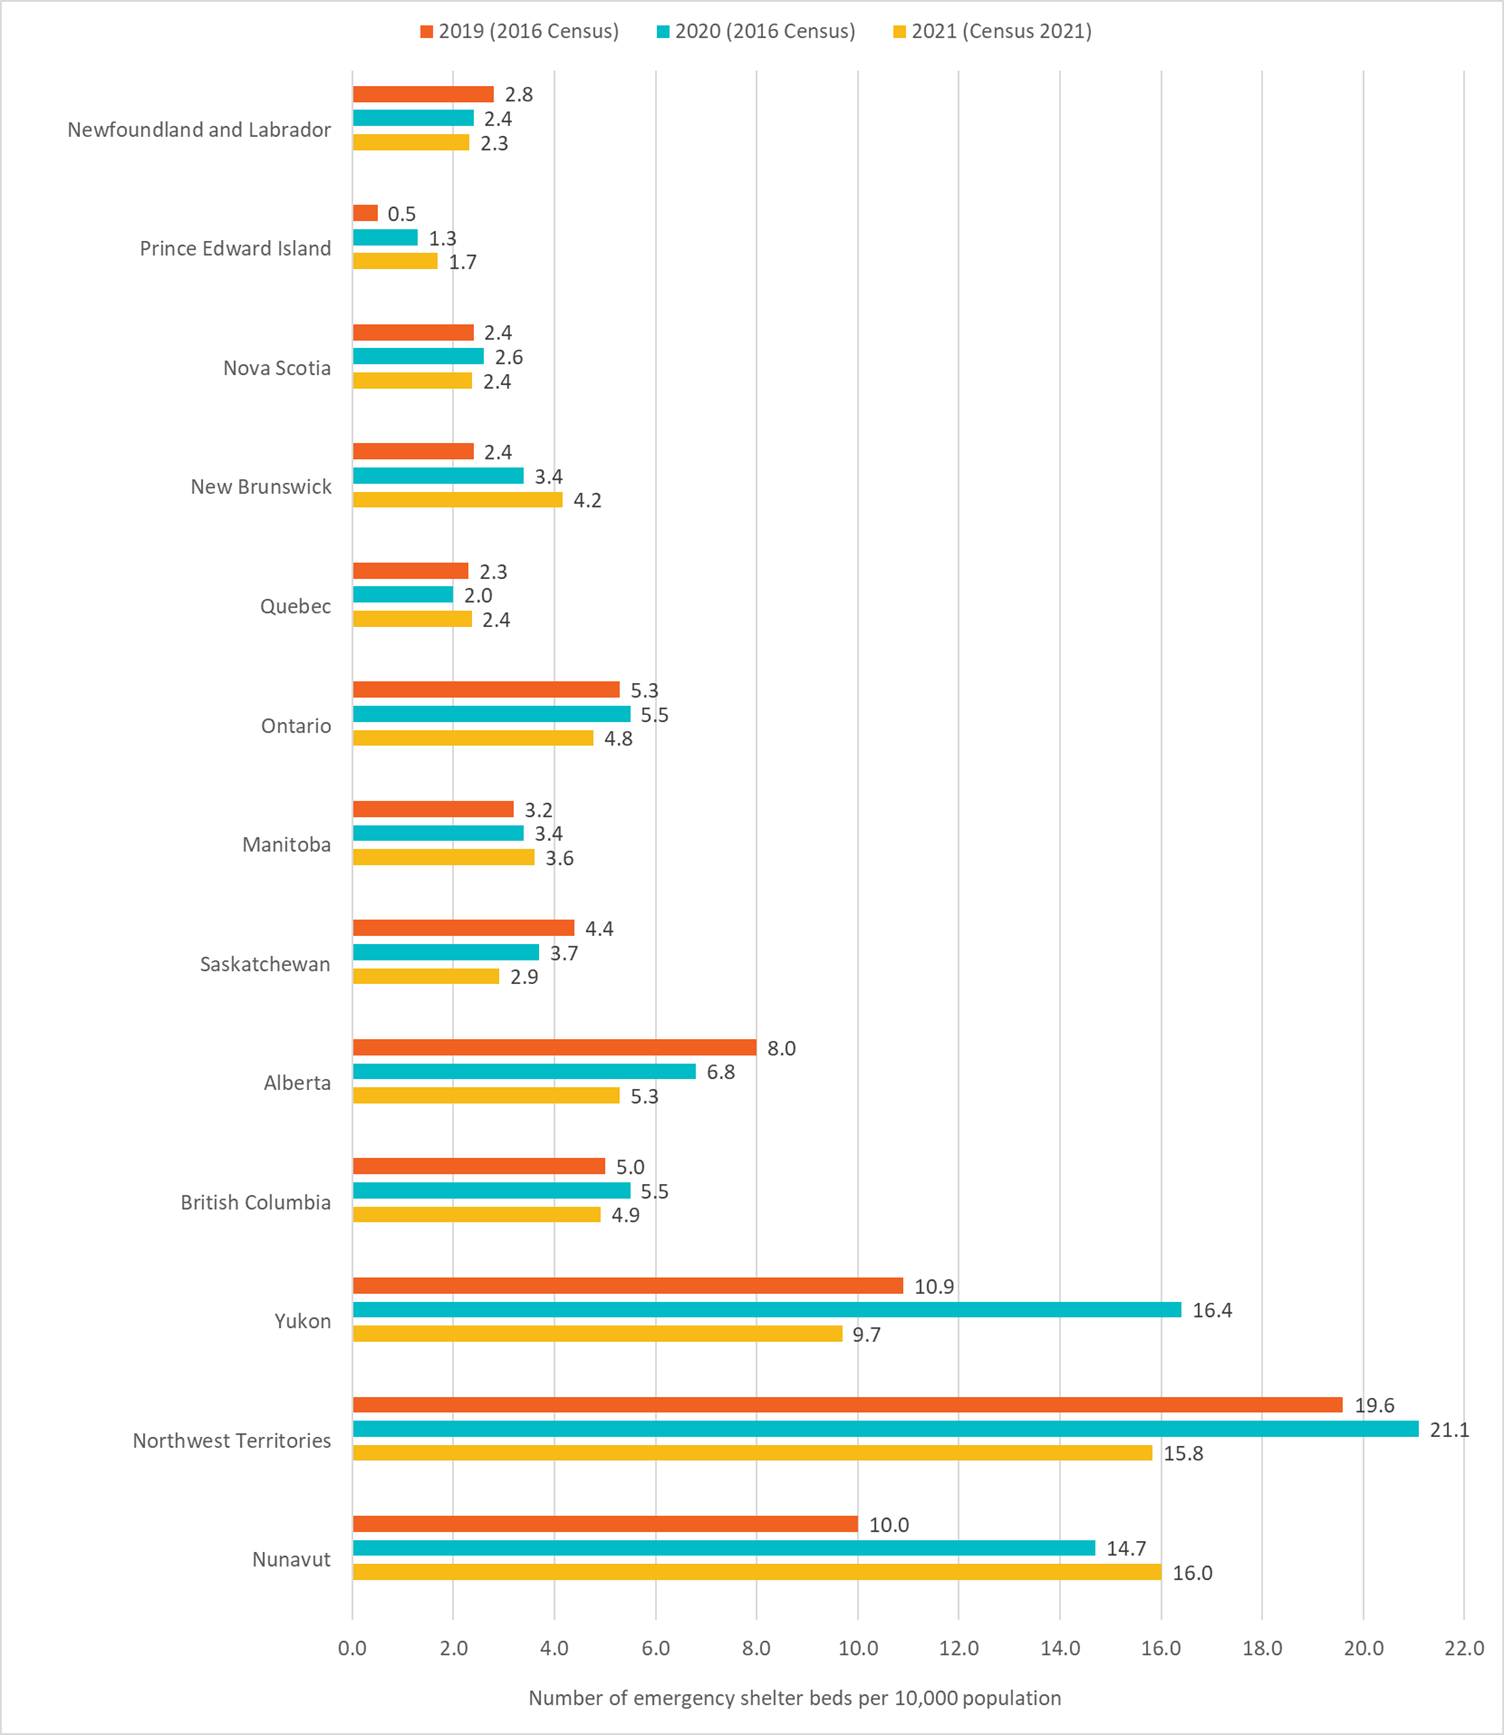
The number of emergency shelter beds by population of 10,000 is measured using the total number of emergency shelter beds and the census population of a province or territory. The 2021 results are based on 2021 census data while the 2020 and 2019 results were are based on 2016 census data. Changes between 2019 and 2020 directly come from a change in shelter beds while changes in 2021 are influenced by both factors (number beds and census population). Some notable findings include:
- The number of emergency shelter beds per 10,000 people in Canada decreased from 4.6 in 2020 to 4.1 in 2021.
- This reduction is due to Canada's population increase of 5.2% between 2016 and 2021, alongside a national reduction of 5.1% in permanent emergency beds available between 2020 and 2021.
- While Quebec, Manitoba, New Brunswick, Prince Edward Island, and Nunavut saw an increase in their total population, they also increased their number of shelter beds per capita.
- The three Territories consistently have the smallest population and have the highest number of shelter beds per capita.
Figure 5: Number of emergency shelter beds per 10,000 population, 2019-2021
-
Figure 5 - Text version
Province and territory Number of emergency shelter beds per 10,000 population, 2019 (2016 Census) Number of emergency shelter beds per 10,000 population, 2020 (2016 Census) Number of emergency shelter beds per 10,000 population, 2021 (2021 Census) Newfoundland and Labrador 2.8 2.4 2.3 Prince Edward Island 0.5 1.3 1.7 Nova Scotia 2.4 2.6 2.4 New Brunswick 2.4 3.4 4.2 Quebec 2.3 2.0 2.4 Ontario 5.3 5.5 4.8 Manitoba 3.2 3.4 3.6 Saskatchewan 4.4 3.7 2.9 Alberta 8.0 6.8 5.3 British Columbia 5.0 5.5 4.9 Yukon 10.9 16.4 9.7 Northwest Territories 19.6 21.1 15.8 Nunavut 10.0 14.7 16.0
Figure 6: Number of emergency shelter beds per 10,000 population, 2021

-
Figure 6 - Text version
Province and territory Number of emergency shelter beds per 10,000 population, 2021 (2021 Census) Newfoundland and Labrador 2.3 Prince Edward Island 1.7 Nova Scotia 2.4 New Brunswick 4.2 Quebec 2.4 Ontario 4.8 Manitoba 3.6 Saskatchewan 2.9 Alberta 5.3 British Columbia 4.9 Yukon 9.7 Northwest Territories 15.8 Nunavut 16.0
Emergency shelters capacity by clientele served, per province and territory, 2021
Emergency shelters serving the "General" clientele accounted for 37% of all shelters in 2021, and 40% of all emergency beds. There was a significant decrease in the number of men's beds in Ontario (533) from 2020 to 2021. While Alberta faced a significant reduction in general beds (752), Quebec increased general beds by 411. Shelters that exclusively serve youth make up 18% of all shelters, however they only account for 7% of all shelter beds.
| Province and territory | General shelters | General beds | Men's shelters | Men's beds | Women's shelters | Women's beds | Youth shelters | Youth beds | Family shelters | Family beds | Total shelters | Total beds |
|---|---|---|---|---|---|---|---|---|---|---|---|---|
| Newfoundland and Labrador | 10 | 90 | 0 | 0 | 0 | 0 | 4 | 28 | 0 | 0 | 14 | 118 |
| Prince Edward Island | 0 | 0 | 2 | 18 | 1 | 8 | 0 | 0 | 0 | 0 | 3 | 26 |
| Nova Scotia | 4 | 92 | 2 | 70 | 2 | 34 | 2 | 28 | 1 | 6 | 11 | 230 |
| New Brunswick | 4 | 244 | 2 | 52 | 2 | 21 | 1 | 6 | 0 | 0 | 9 | 323 |
| Quebec | 37 | 830 | 11 | 565 | 14 | 262 | 22 | 229 | 8 | 123 | 92 | 2,009 |
| Ontario | 33 | 1,265 | 43 | 2,116 | 23 | 904 | 23 | 550 | 35 | 1,958 | 157 | 6,793 |
| Manitoba | 12 | 387 | 1 | 2 | 0 | 0 | 4 | 26 | 2 | 69 | 19 | 484 |
| Saskatchewan | 1 | 30 | 6 | 152 | 3 | 22 | 2 | 20 | 4 | 105 | 16 | 329 |
| Alberta | 12 | 1,428 | 2 | 480 | 2 | 167 | 7 | 69 | 3 | 110 | 26 | 2,254 |
| British Columbia | 47 | 1,622 | 9 | 400 | 5 | 179 | 11 | 119 | 9 | 136 | 81 | 2,456 |
| Yukon | 1 | 25 | 1 | 4 | 0 | 0 | 1 | 10 | 0 | 0 | 3 | 39 |
| Northwest Territories | 0 | 0 | 1 | 49 | 1 | 10 | 1 | 6 | 0 | 0 | 3 | 65 |
| Nunavut | 0 | 0 | 2 | 47 | 0 | 0 | 0 | 0 | 1 | 12 | 3 | 59 |
| Canada | 161 | 6,013 | 82 | 3,955 | 53 | 1,607 | 78 | 1,091 | 63 | 2,519 | 437 | 15,185 |
National summary: Change in emergency shelter beds by clientele served, 2019-2021
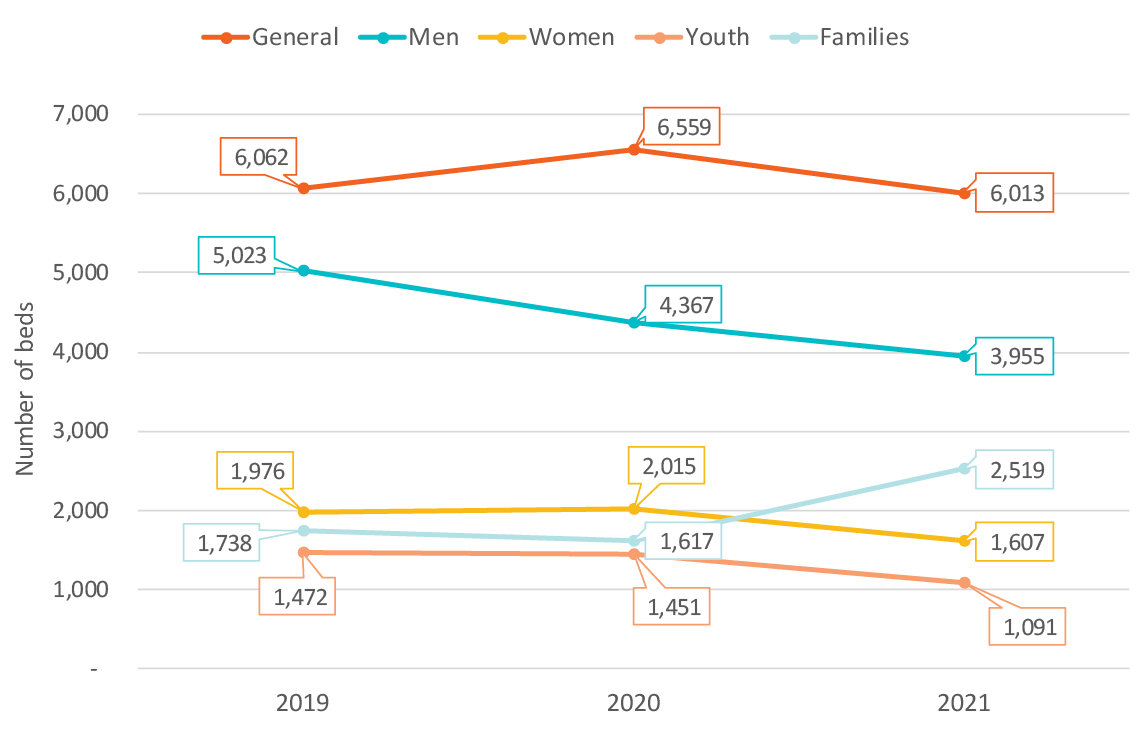
The total number of emergency beds serving adults of all genders ("General") decreased by 8% from 2020 to 2021. The proportion of those serving families increased to 17% of total beds, from 10% in 2020. This change is due in part to the reclassification of shelters serving "women with or without children" under the clientele serving "Women" to "Family" clientele beginning in 2021. The number of beds serving only men has declined since 2019, as well as those who serve youth.
Figure 7: Number of emergency shelter beds by clientele served, Canada, 2019-2021
-
Figure 7 - Text version
Clientele served 2019 2020 2021 General 6,062 6,559 6,013 Men 5,023 4,367 3,955 Women 1,976 2,015 1,607 Youth 1,472 1,451 1,091 Families 1,738 1,617 2,519
Appendix A: Transitional housing capacity, by province and territory, 2019-2021
| Province and territory | Shelters | Beds | ||||
|---|---|---|---|---|---|---|
| 2019 | 2020 | 2021 | 2019 | 2020 | 2021 | |
| Newfoundland and Labrador | 4 | 4 | 4 | 102 | 32 | 32 |
| Nova Scotia | 10 | 10 | 12 | 128 | 125 | 148 |
| New Brunswick | 4 | 7 | 13 | 37 | 48 | 66 |
| Prince Edward Island | 0 | 0 | 1 | 0 | 0 | 9 |
| Quebec | 114 | 116 | 153 | 2,428 | 2,358 | 2,796 |
| Ontario | 106 | 116 | 149 | 2,134 | 2,128 | 2,764 |
| Manitoba | 10 | 11 | 16 | 349 | 441 | 297 |
| Saskatchewan | 23 | 20 | 22 | 309 | 235 | 244 |
| Alberta | 36 | 38 | 35 | 1,135 | 1,108 | 711 |
| British Columbia | 33 | 41 | 43 | 972 | 1,179 | 1,017 |
| Yukon | 1 | 2 | 0 | 2 | 4 | 0 |
| Northwest Territories | 5 | 5 | 4 | 98 | 97 | 66 |
| Nunavut | 0 | 0 | 0 | 0 | 0 | 0 |
| Canada | 346 | 370 | 452 | 7,694 | 7,755 | 8,150 |
Appendix B: Transitional housing capacity by clientele served, per province and territory, 2021
| Province and territory | General shelters | General beds | Men's shelters | Men's beds | Women's shelters | Women's beds | Youth shelters | Youth beds | Family shelters | Family beds | Total shelters | Total beds |
|---|---|---|---|---|---|---|---|---|---|---|---|---|
| Newfoundland and Labrador | 1 | 3 | 0 | 0 | 1 | 4 | 2 | 25 | 0 | 0 | 4 | 32 |
| Prince Edward Island | 1 | 9 | 0 | 0 | 0 | 0 | 0 | 0 | 0 | 0 | 1 | 9 |
| Nova Scotia | 3 | 54 | 1 | 19 | 1 | 5 | 5 | 49 | 2 | 21 | 12 | 148 |
| New Brunswick | 5 | 16 | 0 | 0 | 1 | 8 | 7 | 42 | 0 | 0 | 13 | 66 |
| Quebec | 60 | 893 | 21 | 791 | 6 | 82 | 27 | 357 | 39 | 673 | 153 | 2,796 |
| Ontario | 30 | 610 | 28 | 811 | 19 | 317 | 53 | 683 | 19 | 343 | 149 | 2,764 |
| Manitoba | 7 | 142 | 3 | 55 | 2 | 34 | 4 | 66 | 0 | 0 | 16 | 297 |
| Saskatchewan | 5 | 81 | 4 | 45 | 1 | 10 | 9 | 62 | 3 | 46 | 22 | 244 |
| Alberta | 4 | 80 | 7 | 299 | 4 | 151 | 17 | 145 | 3 | 36 | 35 | 711 |
| British Columbia | 26 | 739 | 5 | 135 | 1 | 10 | 8 | 78 | 3 | 55 | 43 | 1,017 |
| Yukon | 0 | 0 | 0 | 0 | 0 | 0 | 0 | 0 | 0 | 0 | 0 | 0 |
| Northwest Territories | 1 | 6 | 1 | 32 | 0 | 0 | 1 | 10 | 1 | 18 | 4 | 66 |
| Nunavut | 0 | 0 | 0 | 0 | 0 | 0 | 0 | 0 | 0 | 0 | 0 | 0 |
| Canada | 143 | 2,633 | 70 | 2,187 | 36 | 621 | 133 | 1,517 | 70 | 1,192 | 452 | 8,150 |
Appendix C: Domestic violence shelter capacity, by province and territory, 2019-2021
| Province and territory | Shelters | Beds | ||||
|---|---|---|---|---|---|---|
| 2019 | 2020 | 2021 | 2019 | 2020 | 2021 | |
| Newfoundland and Labrador | 21 | 14 | 20 | 176 | 191 | 187 |
| Nova Scotia | 17 | 16 | 23 | 211 | 242 | 309 |
| New Brunswick | 18 | 18 | 20 | 303 | 303 | 283 |
| Prince Edward Island | 3 | 3 | 3 | 45 | 43 | 43 |
| Quebec | 109 | 104 | 138 | 1,370 | 1,466 | 1,776 |
| Ontario | 136 | 134 | 159 | 2,510 | 2,629 | 2,896 |
| Manitoba | 23 | 19 | 20 | 385 | 414 | 353 |
| Saskatchewan | 15 | 16 | 17 | 238 | 277 | 322 |
| Alberta | 54 | 52 | 57 | 1,291 | 1,329 | 1,297 |
| British Columbia | 132 | 109 | 141 | 1,259 | 1,329 | 1,601 |
| Yukon | 6 | 8 | 6 | 52 | 101 | 65 |
| Northwest Territories | 6 | 6 | 5 | 44 | 44 | 34 |
| Nunavut | 5 | 4 | 3 | 41 | 41 | 31 |
| Canada | 545 | 503 | 612 | 7,925 | 8,409 | 9,197 |
Appendix D: Domestic violence shelter capacity by clientele served, per province and territory, 2021
| Province and territory | General shelters | General beds | Men's shelters | Men's beds | Women's shelters | Women's beds | Youth shelters | Youth beds | Family shelters | Family beds | Total shelters | Total beds |
|---|---|---|---|---|---|---|---|---|---|---|---|---|
| Newfoundland and Labrador | 0 | 0 | 0 | 0 | 0 | 0 | 0 | 0 | 20 | 187 | 20 | 187 |
| Prince Edward Island | 0 | 0 | 0 | 0 | 0 | 0 | 0 | 0 | 3 | 43 | 3 | 43 |
| Nova Scotia | 0 | 0 | 0 | 0 | 0 | 0 | 0 | 0 | 23 | 309 | 23 | 309 |
| New Brunswick | 0 | 0 | 0 | 0 | 0 | 0 | 0 | 0 | 20 | 283 | 20 | 283 |
| Quebec | 3 | 46 | 6 | 52 | 0 | 0 | 0 | 0 | 129 | 1,678 | 138 | 1,776 |
| Ontario | 3 | 39 | 0 | 0 | 3 | 30 | 5 | 25 | 148 | 2,802 | 159 | 2,896 |
| Manitoba | 0 | 0 | 0 | 0 | 0 | 0 | 0 | 0 | 20 | 353 | 20 | 353 |
| Saskatchewan | 0 | 0 | 0 | 0 | 0 | 0 | 0 | 0 | 17 | 322 | 17 | 322 |
| Alberta | 1 | 7 | 0 | 0 | 0 | 0 | 0 | 0 | 56 | 1,290 | 57 | 1,297 |
| British Columbia | 0 | 0 | 0 | 0 | 2 | 27 | 0 | 0 | 139 | 1,574 | 141 | 1,601 |
| Yukon | 0 | 0 | 0 | 0 | 0 | 0 | 0 | 0 | 6 | 65 | 6 | 65 |
| Northwest Territories | 0 | 0 | 0 | 0 | 0 | 0 | 0 | 0 | 5 | 34 | 5 | 34 |
| Nunavut | 0 | 0 | 0 | 0 | 0 | 0 | 0 | 0 | 3 | 31 | 3 | 31 |
| Canada | 7 | 92 | 6 | 52 | 5 | 57 | 5 | 25 | 589 | 8,971 | 612 | 9,197 |
Appendix E: Glossary
- Emergency shelters
- A permanent facility that provides temporary, short-term accommodation (typically less than 3 months in duration) for homeless individuals and families. There is no cost to service users and no referral or entry application is necessary to access the service. Counselling, treatment and other support services including food and clothing may be available to the people who access the service, but participation is not mandatory. Often only a place to sleep is provided.
- Transitional Housing
- Facilities that provide temporary, longer-term accommodation for homeless or at risk of homelessness individuals and/or families. Transitional housing is an intermediate step between emergency shelter and permanent housing. They differ from emergency shelters by a longer length of stay and greater intensity of support services. Stays typically last between 3 months and 3 years.
- Domestic violence shelter
- Facilities that provide temporary accommodation (emergency beds) to individuals and/or families fleeing domestic abuse or the threat of violence that functions either as a crisis capacity or as transitional/second stage housing, which refers to units designed to provide them with transitional accommodation when they decide not to return to the family home.
- Homelessness
- The living situation of an individual or family who does not have stable, permanent, appropriate housing, or the immediate prospect, means and ability of acquiring a home.
- Large population centres
- Communities with a population greater than 100,000.
- Medium population centres
- Communities with a population between 30,000 and 99,999.
- Small population centres
- Communities with a population between 1,000 and 29,999.
- Youth shelters
- Provide services to youth. Some serve all genders, others only serve girls/women or boys/men. Shelters have varying definitions of youth, often ranging from 12 to 29 years of age.
- Women's shelters
- Provide services to adults identifying as women. Some also accept girls.
- Men's shelters
- Provide services to adults identifying as men. Some also accept boys.
- General shelters
- Provide services to adults of all genders. Some also accept youth of all genders.
- Family shelters
- Provide services to families and adults with dependents. Some also accept single adult women without dependents.
- Homelessness service providers
- Service provider organizations that provide services to homeless individuals and families, and persons at risk of homelessness.
Related data
Statistic Canada data table: Homeless shelter capacity, bed and shelter counts for emergency shelters, transitional housing and domestic violence shelters by geography and reference period (from 2016 to 2021)
References
Statistics Canada. (2022). "Population and Dwelling Counts: Canada and Population Centres" 2021 Census. Statistics Canada Catalogue no. 98-10-0011-01. Ottawa, Ontario. January 30. Retrieved from: Table 98-10-0011-01 Population and dwelling counts: Canada and population centres
Statistics Canada. (2022). "Population and dwelling counts: Canada, provinces and territories"2021 and 2016 Censuses. Statistics Canada Catalogue no. 98-402-X2016001. Ottawa, Ontario. February 8. Retrieved from: Population and dwelling counts: Canada, provinces and territories (statcan.gc.ca)
Report a problem on this page
- Date modified: