
Shelter Capacity Report 2020
Shelter Capacity Report 2020
On this page
- List of figures
- List of tables
- Acknowledgements
- Introduction
- Scope of the data
- Types of shelters
- Clientele served
- National emergency shelter capacity overview
- National summary: Emergency shelters (2020)
- Emergency shelters by clientele served (2020)
- Emergency shelters and shelter beds by community (2020)
- Appendix A: National summary – Transitional housing shelters (2020)
- Appendix B: Transitional housing by clientele served (2020)
- Appendix C: National summary – Domestic violence shelters (2020)
- Appendix D: Glossary
- References
Alternate formats

Request other formats online or call 1 800 O-Canada (1-800-622-6232). If you use a teletypewriter (TTY), call 1-800-926-9105. Large print, braille, audio cassette, audio CD, e-text diskette, e-text CD and DAISY are available on demand.
List of figures
- Figure 1: Total number of emergency shelters and permanent emergency shelter beds in Canada
- Figure 2: Emergency shelter beds in Canada by clientele served
- Figure 3: Proportion of shelters and beds by community size
- Figure 4: Number of emergency shelter beds by province and territory
- Figure 5: Number of emergency shelters beds by population of 10,000
List of tables
- Table 1: National summary – Emergency shelters (2020)
- Table 2: Emergency shelters by clientele served (2020)
- Table 3: Emergency shelters and shelter beds, Alberta
- Table 4: Emergency shelters and shelter beds, British Columbia
- Table 5: Emergency shelters and shelter beds, Manitoba
- Table 6: Emergency shelters and shelter beds, New Brunswick
- Table 7: Emergency shelters and shelter beds, Newfoundland and Labrador
- Table 8: Emergency shelters and shelter beds, Northwest Territories
- Table 9: Emergency shelters and shelter beds, Nova Scotia
- Table 10: Emergency shelters and shelter beds, Nunavut
- Table 11: Emergency shelters and shelter beds, Ontario
- Table 12: Emergency shelters and shelter beds, Prince Edward Island
- Table 13: Emergency shelters and shelter beds, Quebec
- Table 14: Emergency shelters and shelter beds, Saskatchewan
- Table 15: Emergency shelters and shelter beds, Yukon
- Table 16: National summary – Transitional housing shelters (2020)
- Table 17: Transitional housing by clientele served (2020)
- Table 18: National summary – Domestic violence shelters (2020)
Acknowledgements
We would like to thank service providers and Community Entities for their collaboration in the development of the National Service Provider List. This support is key to advancing the understanding of homelessness in Canada.
Introduction
The Shelter Capacity Report is a descriptive account of capacity statistics for emergency homeless shelters in Canada. The report provides information on the number of emergency shelter facilities and permanent beds for each province, territory, and community. In addition, the appendices include overviews of transitional housing facilities and domestic violence shelters. The Homelessness Policy Directorate of Infrastructure Canada prepares this report annually using information obtained from the National Service Provider List. The National Service Provider List is a comprehensive listing of homeless shelters in Canada maintained by the Directorate.
The Directorate conducted a comprehensive update of the emergency shelters in 2020 between August and December 2020. For this process, Community Entities and Service Canada in the region of Quebec updated and validated information for the services in their community. Additional information was obtained from community organizations and publicly available sources to ensure accuracy of findings.
Scope of the data
The scope of this report excludes shelters that are not primarily for people experiencing homelessness, including shelters for specific populations (for example, immigrants/refugees or pregnant women). It also excludes motel/hotel programs, supportive housing, and correctional shelters data.
Data in this report only covers the pre-pandemic information (as of February 2020). Further analysis will follow on the impact of the pandemic on the capacity of the shelter system in Canada. This will include information on temporary COVID-19 response shelters, and measures taken by the homelessness sector to follow social distancing requirements.
For this report, all services offered by an umbrella organization to a specific target population, and located at the same address, have been merged as one shelter. As a result, the number of shelters listed in this report may be slightly lower, in some cases, than the number reported in the 2020 National Service Provider List.
Some fluctuations in the reported number of shelters and beds between 2019 and 2020 may reflect administrative changes in updating the type of service or geographical location of service providers rather than actual changes in national shelter capacity.
Types of shelters
Emergency shelters
Facilities that provide temporary, short-term accommodation for homeless individuals and families. This may or may not include other services such as food, clothing or counselling. Motel and hotel programs are excluded.
Transitional housing
Facilities that provide longer-term temporary shelter with a greater intensity of support services than emergency shelters. Transitional housing is an intermediate step between emergency shelter and permanent housing. Support services help clients to gain the stability and self-sufficiency needed to maintain permanent housing.
Domestic violence shelters
Facilities that provide temporary shelter to individuals and/or families fleeing domestic abuse or the threat of violence that function either as a crisis capacity or as transitional housing.
Clientele served
Emergency shelters, transitional housing, and domestic violence shelter are further categorized according to the clients they serve:
- men’s shelters provide services to adult males. Some also accept youth
- women’s shelters provide services to adult females. Some also accept youth
- general shelters provide services to adult males and females. Some also accept youth
- youth shelters provide services to youth. Shelters have varying definitions of youth, often ranging from 12 to 29 years of age
- family shelters provide services to families and adults with dependents. Some also accept single adult women without dependents
National emergency shelter capacity overview
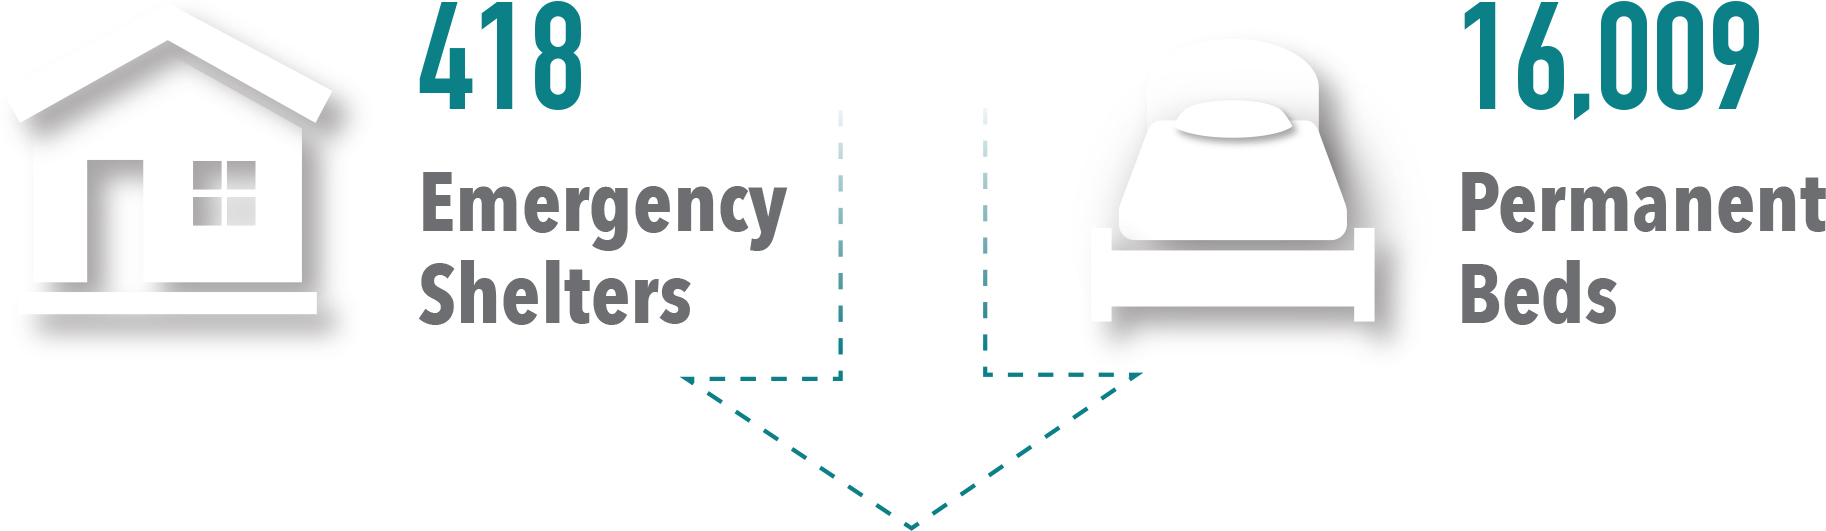
Text description of figure 1
Total number of emergency shelters and permanent emergency shelter beds in Canada.
There are 418 emergency shelters and 16,009 permanent beds in Canada.
Emergency shelter beds by clientele served
- More than two fifths (41%) of shelter beds are in general shelters that serve both men and women. This is an increase relative to the proportion identified in 2019 (37%)
- Although there are a similar number of shelters for men (77) and for women (71), men's shelters account for a greater percentage of all shelter beds (27%) compared to women's shelters (13%)
- Family shelters account for 10% of shelter beds
- Although shelters that exclusively serve youth make up 21% of all shelters, they only account for 9% of all shelter beds
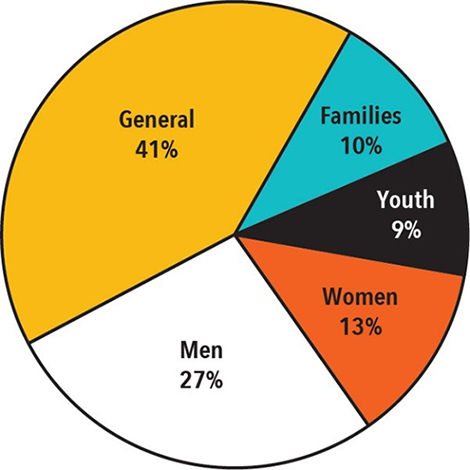
Text description of figure 2
| Clientele | Percentage (%) |
|---|---|
| General | 41 |
| Men | 27 |
| Women | 13 |
| Youth | 9 |
| Families | 10 |
Proportion of shelters and beds by community size
- A significant proportion of shelters (43%) are located in small communities (populations less than 300,000)
- However, the majority of shelter beds (78%) are in large communities (populations of greater than 300,000)
- The median number of beds per shelter in small communities is 16, while the median number for large communities is 35
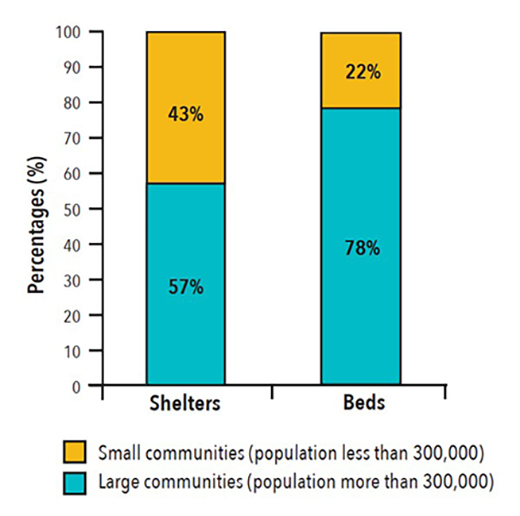
Text description of figure 3
| Shelters | Proportion (%) |
|---|---|
| Small communities (population less than 300,000) | 43 |
| Large communities (population more than 300,000) | 57 |
| Beds | Proportion (%) |
|---|---|
| Small communities (population less than 300,000) | 22 |
| Large communities (population more than 300,000) | 78 |
Number of emergency shelter beds by province and territory
- The majority of shelter beds (89%) are in the provinces of Ontario, Alberta, British Columbia, and Quebec
- Almost half of all emergency shelter beds (46%) are located in Ontario
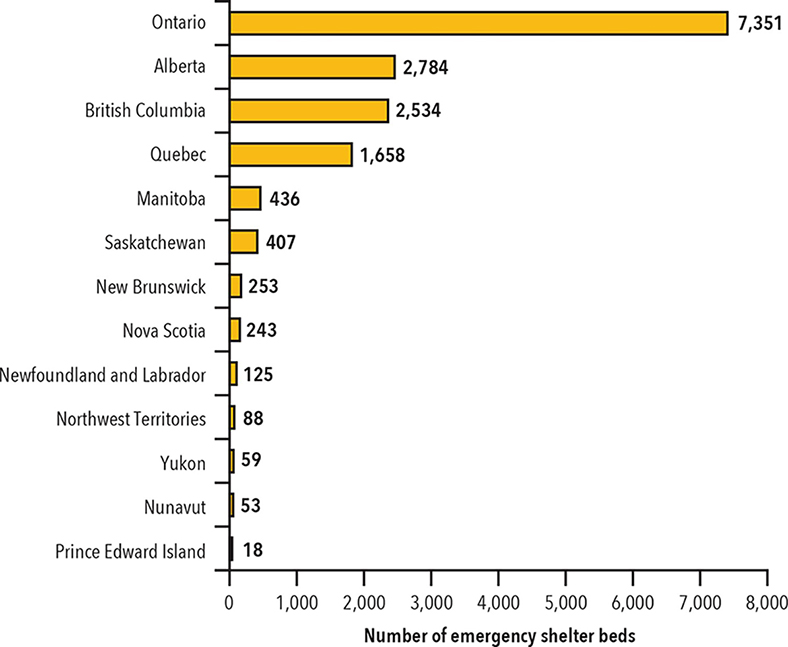
Text description of figure 4
| Province | Number of emergency shelter beds |
|---|---|
| Ontario | 7,351 |
| Alberta | 2,784 |
| British Columbia | 2,534 |
| Quebec | 1,658 |
| Manitoba | 436 |
| Saskatchewan | 407 |
| New Brunswick | 253 |
| Nova Scotia | 243 |
| Newfoundland and Labrador | 125 |
| Northwest Territories | 88 |
| Yukon | 59 |
| Nunavut | 53 |
| Prince Edward Island | 18 |
Number of emergency shelter beds by population of 10,000
- The northern territories (Yukon, Northwest Territories and Nunavut) have the highest number of shelter beds per capita
- Prince Edward Island, Quebec, and Newfoundland and Labrador rank lowest in terms of emergency shelter capacity per capita
- The national number of emergency shelter beds per 10,000 people is 4.6
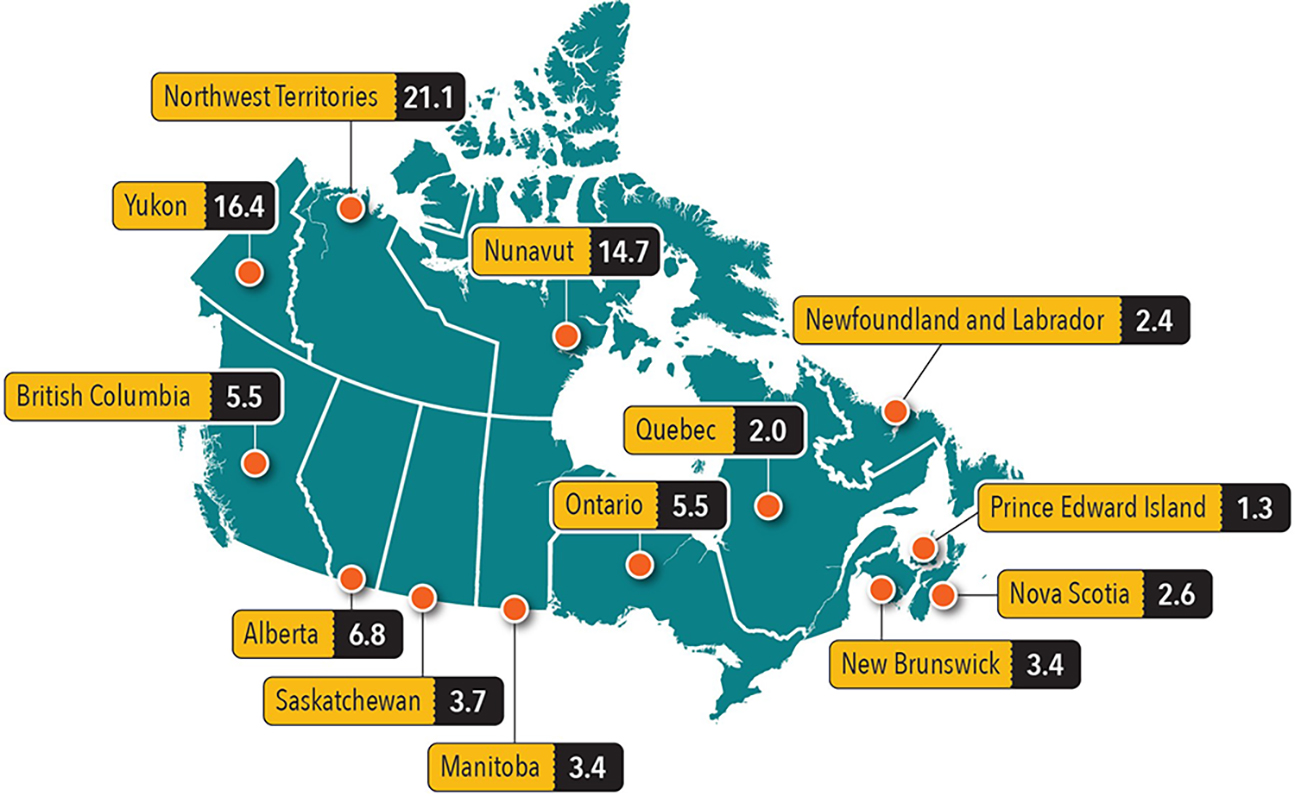
Source: Statistics Canada, 2017. Population and Dwelling Count Highlight Tables, 2016 Census.
Text description of figure 5
| Province | Beds by population of 10,000 |
|---|---|
| Alberta | 6.8 |
| British Columbia | 5.5 |
| Manitoba | 3.4 |
| New Brunswick | 3.4 |
| Newfoundland and Labrador | 2.4 |
| Northwest Territories | 21.1 |
| Nova Scotia | 2.6 |
| Nunavut | 14.7 |
| Ontario | 5.5 |
| Prince Edward Island | 1.3 |
| Quebec | 2.0 |
| Saskatchewan | 3.7 |
| Yukon | 16.4 |
National summary: Emergency shelters (2020)
| Province and territory | 2020 Shelters |
2020 Beds |
2019 Shelters |
2019 Beds |
2018 Shelters |
2018 Beds |
|---|---|---|---|---|---|---|
| Alberta | 30 | 2,784 | 38 | 3,258 | 35 | 3,304 |
| British Columbia | 79 | 2,534 | 79 | 2,336 | 78 | 2,170 |
| Manitoba | 16 | 436 | 12 | 403 | 13 | 650 |
| New Brunswick | 8 | 253 | 8 | 180 | 9 | 157 |
| Newfoundland and Labrador | 14 | 125 | 14 | 146 | 7 | 67 |
| Northwest Territories | 3 | 88 | 3 | 82 | 3 | 82 |
| Nova Scotia | 11 | 243 | 11 | 225 | 9 | 220 |
| Nunavut | 3 | 53 | 2 | 36 | 2 | 44 |
| Ontario | 160 | 7,351 | 159 | 7,175 | 149 | 6,898 |
| Prince Edward Island | 2 | 18 | 1 | 7 | 1 | 7 |
| Quebec | 74 | 1,658 | 76 | 1,901 | 65 | 1,757 |
| Saskatchewan | 15 | 407 | 17 | 483 | 18 | 476 |
| Yukon | 3 | 59 | 3 | 39 | 3 | 27 |
| Canada | 418 | 16,009* | 423 | 16,271 | 392 | 15,859 |
*There was a national reduction of 262 emergency beds from 2019 to 2020.
Emergency shelters by clientele served (2020)
| Province or territory | General shelters | General beds | Men's shelters | Men's beds | Women's shelters | Women's beds | Youth shelters | Youth beds | Family shelters | Family beds | Total shelters | Total beds |
|---|---|---|---|---|---|---|---|---|---|---|---|---|
| Alberta | 14 | 2,180 | 2 | 150 | 4 | 181 | 8 | 146 | 2 | 127 | 30 | 2,784 |
| British Columbia | 46 | 1,740 | 11 | 436 | 9 | 201 | 11 | 127 | 2 | 30 | 79 | 2,534 |
| Manitoba | 11 | 338 | 1 | 3 | 0 | 0 | 2 | 26 | 2 | 69 | 16 | 436 |
| New Brunswick | 3 | 170 | 2 | 52 | 2 | 23 | 1 | 8 | 0 | 0 | 8 | 253 |
| Newfoundland and Labrador | 10 | 90 | 0 | 0 | 0 | 0 | 3 | 20 | 1 | 15 | 14 | 125 |
| Northwest Territories | 1 | 24 | 1 | 49 | 0 | 0 | 1 | 15 | 0 | 0 | 3 | 88 |
| Nova Scotia | 4 | 67 | 2 | 110 | 3 | 42 | 2 | 24 | 0 | 0 | 11 | 243 |
| Nunavut | 0 | 0 | 2 | 41 | 1 | 12 | 0 | 0 | 0 | 0 | 3 | 53 |
| Ontario | 36 | 1,430 | 42 | 2,649 | 32 | 1,166 | 30 | 762 | 20 | 1,344 | 160 | 7,351 |
| Prince Edward Island | 0 | 0 | 1 | 10 | 1 | 8 | 0 | 0 | 0 | 0 | 2 | 18 |
| Quebec | 25 | 419 | 6 | 689 | 14 | 226 | 25 | 292 | 4 | 32 | 74 | 1,658 |
| Saskatchewan | 2 | 56 | 6 | 175 | 5 | 156 | 2 | 20 | 0 | 0 | 15 | 407 |
| Yukon | 1 | 45 | 1 | 3 | 0 | 0 | 1 | 11 | 0 | 0 | 3 | 59 |
| Canada | 153 | 6,559 | 77 | 4,367 | 71 | 2,015 | 86 | 1,451 | 31 | 1,617 | 418 | 16,009 |
Emergency shelters and shelter beds by community (2020)
Alberta
| Community | General shelters | General beds | Men's shelters | Men's beds | Women's shelters | Women's beds | Youth shelters | Youth beds | Family shelters | Family beds | Total shelters | Total beds |
|---|---|---|---|---|---|---|---|---|---|---|---|---|
| Calgary | 4 | 1,591 | 1 | 80 | 2 | 45 | 1 | 18 | 2 | 127 | 10 | 1,861 |
| Edmonton | 1 | 200 | 1 | 70 | 2 | 136 | 3 | 91 | 0 | 0 | 7 | 497 |
| Grande Prairie | 1 | 96 | 0 | 0 | 0 | 0 | 1 | 12 | 0 | 0 | 2 | 108 |
| Lac La Biche | 1 | 9 | 0 | 0 | 0 | 0 | 0 | 0 | 0 | 0 | 1 | 9 |
| Lethbridge | 1 | 80 | 0 | 0 | 0 | 0 | 1 | 8 | 0 | 0 | 2 | 88 |
| Medicine Hat | 1 | 30 | 0 | 0 | 0 | 0 | 1 | 5 | 0 | 0 | 2 | 35 |
| Red Deer | 2 | 72 | 0 | 0 | 0 | 0 | 1 | 12 | 0 | 0 | 3 | 84 |
| Strathmore | 1 | 20 | 0 | 0 | 0 | 0 | 0 | 0 | 0 | 0 | 1 | 20 |
| Wood Buffalo | 2 | 82 | 0 | 0 | 0 | 0 | 0 | 0 | 0 | 0 | 2 | 82 |
| Total | 14 | 2,180 | 2 | 150 | 4 | 181 | 8 | 146 | 2 | 127 | 30 | 2,784* |
*There was an overall reduction of 474 beds from 2019 to 2020.
British Columbia
| Community | General shelters | General beds | Men's shelters | Men's beds | Women's shelters | Women's beds | Youth shelters | Youth beds | Family shelters | Family beds | Total shelters | Total beds |
|---|---|---|---|---|---|---|---|---|---|---|---|---|
| Abbotsford | 2 | 78 | 0 | 0 | 0 | 0 | 1 | 6 | 0 | 0 | 3 | 84 |
| Campbell River | 1 | 22 | 0 | 0 | 0 | 0 | 0 | 0 | 0 | 0 | 1 | 22 |
| Chilliwack | 4 | 186 | 0 | 0 | 0 | 0 | 1 | 9 | 0 | 0 | 5 | 195 |
| Courtenay | 1 | 18 | 0 | 0 | 0 | 0 | 0 | 0 | 0 | 0 | 1 | 18 |
| Dawson Creek | 1 | 8 | 0 | 0 | 0 | 0 | 0 | 0 | 0 | 0 | 1 | 8 |
| Duncan | 1 | 30 | 0 | 0 | 1 | 15 | 0 | 0 | 0 | 0 | 2 | 45 |
| Fort Nelson | 0 | 0 | 1 | 7 | 0 | 0 | 0 | 0 | 0 | 0 | 1 | 7 |
| Fort St. John | 1 | 24 | 0 | 0 | 0 | 0 | 0 | 0 | 0 | 0 | 1 | 24 |
| Hope | 1 | 20 | 0 | 0 | 0 | 0 | 0 | 0 | 0 | 0 | 1 | 20 |
| Kamloops | 1 | 55 | 0 | 0 | 0 | 0 | 1 | 4 | 0 | 0 | 2 | 59 |
| Kelowna | 0 | 0 | 1 | 60 | 1 | 20 | 1 | 10 | 0 | 0 | 3 | 90 |
| Mission | 1 | 27 | 0 | 0 | 0 | 0 | 0 | 0 | 0 | 0 | 1 | 27 |
| Nanaimo | 0 | 0 | 1 | 24 | 1 | 14 | 1 | 8 | 0 | 0 | 3 | 46 |
| Nelson | 1 | 17 | 0 | 0 | 0 | 0 | 0 | 0 | 0 | 0 | 1 | 17 |
| Penticton | 1 | 30 | 0 | 0 | 0 | 0 | 0 | 0 | 0 | 0 | 1 | 30 |
| Port Alberni | 1 | 18 | 0 | 0 | 0 | 0 | 0 | 0 | 0 | 0 | 1 | 18 |
| Prince George | 2 | 52 | 1 | 21 | 0 | 0 | 1 | 10 | 0 | 0 | 4 | 83 |
| Quesnel | 1 | 17 | 0 | 0 | 0 | 0 | 0 | 0 | 0 | 0 | 1 | 17 |
| Sechelt | 1 | 24 | 0 | 0 | 0 | 0 | 0 | 0 | 0 | 0 | 1 | 24 |
| Squamish | 1 | 15 | 0 | 0 | 0 | 0 | 0 | 0 | 0 | 0 | 1 | 15 |
| Terrace | 1 | 16 | 0 | 0 | 0 | 0 | 0 | 0 | 0 | 0 | 1 | 16 |
| Vancouver | 19 | 906 | 6 | 303 | 5 | 127 | 5 | 80 | 2 | 30 | 37 | 1,446 |
| Victoria | 3 | 165 | 1 | 21 | 1 | 25 | 0 | 0 | 0 | 0 | 5 | 211 |
| Williams Lake | 1 | 12 | 0 | 0 | 0 | 0 | 0 | 0 | 0 | 0 | 1 | 12 |
| Grand Total | 46 | 1,740 | 11 | 436 | 9 | 201 | 11 | 127 | 2 | 30 | 79 | 2,534* |
*There was an overall increase of 198 beds from 2019 to 2020.
Manitoba
| Community | General shelters | General beds | Men's shelters | Men's beds | Women's shelters | Women's beds | Youth shelters | Youth beds | Family shelters | Family beds | Total shelters | Total beds |
|---|---|---|---|---|---|---|---|---|---|---|---|---|
| Brandon | 2 | 36 | 0 | 0 | 0 | 0 | 0 | 0 | 1 | 9 | 3 | 45 |
| Dawson | 2 | 21 | 0 | 0 | 0 | 0 | 0 | 0 | 0 | 0 | 2 | 21 |
| Flin Flon | 1 | 15 | 0 | 0 | 0 | 0 | 0 | 0 | 0 | 0 | 1 | 15 |
| Steinbach | 1 | 4 | 0 | 0 | 0 | 0 | 0 | 0 | 0 | 0 | 1 | 4 |
| Swan River | 1 | 8 | 1 | 3 | 0 | 0 | 0 | 0 | 0 | 0 | 2 | 11 |
| Thompson | 1 | 24 | 0 | 0 | 0 | 0 | 0 | 0 | 0 | 0 | 1 | 24 |
| Winnipeg | 3 | 230 | 0 | 0 | 0 | 0 | 2 | 26 | 1 | 60 | 6 | 316 |
| Total | 11 | 338 | 1 | 3 | 0 | 0 | 2 | 26 | 2 | 69 | 16 | 436* |
*There was an overall increase of 33 beds from 2019 to 2020.
New Brunswick
| Community | General shelters | General beds | Men's shelters | Men's beds | Women's shelters | Women's beds | Youth shelters | Youth beds | Family shelters | Family beds | Total shelters | Total beds |
|---|---|---|---|---|---|---|---|---|---|---|---|---|
| Bathurst | 1 | 19 | 0 | 0 | 0 | 0 | 1 | 8 | 0 | 0 | 2 | 27 |
| Fredericton | 0 | 0 | 1 | 27 | 1 | 13 | 0 | 0 | 0 | 0 | 2 | 40 |
| Moncton | 2 | 151 | 0 | 0 | 0 | 0 | 0 | 0 | 0 | 0 | 2 | 151 |
| Saint John | 0 | 0 | 1 | 25 | 1 | 10 | 0 | 0 | 0 | 0 | 2 | 35 |
| Total | 3 | 170 | 2 | 52 | 2 | 23 | 1 | 8 | 0 | 0 | 8 | 253* |
*There was an overall increase of 73 beds from 2019 to 2020.
Newfoundland and Labrador
| Community | General shelters | General beds | Men's shelters | Men's beds | Women's shelters | Women's beds | Youth shelters | Youth beds | Family shelters | Family beds | Total shelters | Total beds |
|---|---|---|---|---|---|---|---|---|---|---|---|---|
| Happy Valley-Goose Bay | 1 | 8 | 0 | 0 | 0 | 0 | 0 | 0 | 0 | 0 | 1 | 8 |
| Natuashish | 0 | 0 | 0 | 0 | 0 | 0 | 1 | 3 | 0 | 0 | 1 | 3 |
| St. John's | 8 | 78 | 0 | 0 | 0 | 0 | 2 | 17 | 1 | 15 | 11 | 110 |
| Stephenville | 1 | 4 | 0 | 0 | 0 | 0 | 0 | 0 | 0 | 0 | 1 | 4 |
| Total | 10 | 90 | 0 | 0 | 0 | 0 | 3 | 20 | 1 | 15 | 14 | 125* |
*There was an overall reduction of 21 beds from 2019 to 2020.
Northwest Territories
| Community | General shelters | General beds | Men's shelters | Men's beds | Women's shelters | Women's beds | Youth shelters | Youth beds | Family shelters | Family beds | Total shelters | Total beds |
|---|---|---|---|---|---|---|---|---|---|---|---|---|
| Yellowknife | 1 | 24 | 1 | 49 | 0 | 0 | 1 | 15 | 0 | 0 | 3 | 88 |
| Total | 1 | 24 | 1 | 49 | 0 | 0 | 1 | 15 | 0 | 0 | 3 | 88* |
*There was an overall increase of six beds from 2019 to 2020.
Nova Scotia
| Community | General shelters | General beds | Men's shelters | Men's beds | Women's shelters | Women's beds | Youth shelters | Youth beds | Family shelters | Family beds | Total shelters | Total beds |
|---|---|---|---|---|---|---|---|---|---|---|---|---|
| Halifax | 1 | 15 | 2 | 110 | 2 | 36 | 1 | 20 | 0 | 0 | 6 | 181 |
| New Glasgow | 1 | 8 | 0 | 0 | 0 | 0 | 1 | 4 | 0 | 0 | 2 | 12 |
| Sydney | 1 | 28 | 0 | 0 | 1 | 6 | 0 | 0 | 0 | 0 | 2 | 34 |
| Truro | 1 | 16 | 0 | 0 | 0 | 0 | 0 | 0 | 0 | 0 | 1 | 16 |
| Total | 4 | 67 | 2 | 110 | 3 | 42 | 2 | 24 | 0 | 0 | 11 | 243* |
*There was an overall increase of 18 beds from 2019 to 2020.
Nunavut
| Community | General shelters | General beds | Men's shelters | Men's beds | Women's shelters | Women's beds | Youth shelters | Youth beds | Family shelters | Family beds | Total shelters | Total beds |
|---|---|---|---|---|---|---|---|---|---|---|---|---|
| Iqaluit | 0 | 0 | 2 | 41 | 1 | 12 | 0 | 0 | 0 | 0 | 3 | 53 |
| Total | 0 | 0 | 2 | 41 | 1 | 12 | 0 | 0 | 0 | 0 | 3 | 53* |
*There was an overall increase of 17 men beds from 2019 to 2020.
Ontario
| Community | General shelters | General beds | Men's shelters | Men's beds | Women's shelters | Women's beds | Youth shelters | Youth beds | Family shelters | Family beds | Total shelters | Total beds |
|---|---|---|---|---|---|---|---|---|---|---|---|---|
| Barrie-Simcoe | 2 | 38 | 2 | 44 | 1 | 18 | 1 | 17 | 1 | 36 | 7 | 153 |
| Belleville | 1 | 21 | 0 | 0 | 0 | 0 | 0 | 0 | 0 | 0 | 1 | 21 |
| Brant-Brantford | 1 | 40 | 1 | 20 | 1 | 10 | 1 | 18 | 0 | 0 | 4 | 88 |
| Cobourg | 1 | 22 | 0 | 0 | 0 | 0 | 0 | 0 | 0 | 0 | 1 | 22 |
| Cochrane | 0 | 0 | 1 | 6 | 0 | 0 | 0 | 0 | 0 | 0 | 1 | 6 |
| Dufferin Region | 0 | 0 | 0 | 0 | 0 | 0 | 1 | 20 | 0 | 0 | 1 | 20 |
| Durham Region | 0 | 0 | 1 | 40 | 1 | 55 | 1 | 13 | 0 | 0 | 3 | 108 |
| Elliot Lake | 0 | 0 | 1 | 6 | 0 | 0 | 0 | 0 | 0 | 0 | 1 | 6 |
| Halton Region | 1 | 32 | 0 | 0 | 0 | 0 | 0 | 0 | 0 | 0 | 1 | 32 |
| Hamilton | 0 | 0 | 3 | 194 | 3 | 55 | 1 | 21 | 1 | 80 | 8 | 350 |
| Kenora | 1 | 18 | 0 | 0 | 0 | 0 | 0 | 0 | 0 | 0 | 1 | 18 |
| Kingston | 1 | 29 | 0 | 0 | 0 | 0 | 1 | 15 | 1 | 19 | 3 | 63 |
| Lambton County | 1 | 25 | 1 | 23 | 0 | 0 | 1 | 9 | 1 | 4 | 4 | 61 |
| Lindsay | 1 | 19 | 0 | 0 | 0 | 0 | 0 | 0 | 0 | 0 | 1 | 19 |
| London | 3 | 57 | 2 | 198 | 1 | 20 | 0 | 0 | 1 | 41 | 7 | 316 |
| Niagara Region | 2 | 75 | 2 | 34 | 2 | 40 | 2 | 20 | 2 | 21 | 10 | 190 |
| Nipissing (North Bay) | 1 | 19 | 1 | 7 | 1 | 10 | 0 | 0 | 0 | 0 | 3 | 36 |
| Ottawa | 1 | 34 | 3 | 467 | 2 | 101 | 1 | 24 | 2 | 201 | 9 | 827 |
| Peel Region | 1 | 119 | 1 | 86 | 0 | 0 | 2 | 60 | 1 | 225 | 5 | 490 |
| Peterborough | 0 | 0 | 1 | 40 | 1 | 12 | 1 | 47 | 0 | 0 | 3 | 99 |
| Red Lake | 1 | 14 | 0 | 0 | 0 | 0 | 0 | 0 | 0 | 0 | 1 | 14 |
| Sault Ste. Marie | 0 | 0 | 1 | 23 | 0 | 0 | 0 | 0 | 1 | 19 | 2 | 42 |
| Sioux Lookout | 1 | 26 | 0 | 0 | 0 | 0 | 0 | 0 | 0 | 0 | 1 | 26 |
| Sudbury | 1 | 30 | 0 | 0 | 0 | 0 | 0 | 0 | 1 | 26 | 2 | 56 |
| Thunder Bay | 1 | 42 | 1 | 17 | 0 | 0 | 0 | 0 | 0 | 0 | 2 | 59 |
| Timmins | 1 | 42 | 0 | 0 | 0 | 0 | 0 | 0 | 0 | 0 | 1 | 42 |
| Toronto | 8 | 518 | 16 | 1,317 | 15 | 743 | 11 | 415 | 5 | 536 | 55 | 3,529 |
| Waterloo Region | 1 | 78 | 1 | 51 | 0 | 0 | 2 | 27 | 1 | 66 | 5 | 222 |
| Wellington-Guelph | 1 | 5 | 1 | 22 | 1 | 16 | 1 | 14 | 0 | 0 | 4 | 57 |
| Windsor | 2 | 105 | 1 | 24 | 2 | 58 | 0 | 0 | 0 | 0 | 5 | 187 |
| Woodstock | 1 | 22 | 0 | 0 | 0 | 0 | 0 | 0 | 1 | 10 | 2 | 32 |
| York Region | 0 | 0 | 1 | 30 | 1 | 28 | 3 | 42 | 1 | 60 | 6 | 160 |
| Total | 36 | 1,430 | 42 | 2,649 | 32 | 1,166 | 30 | 762 | 20 | 1,344 | 160 | 7,351* |
*There was an overall increase of 176 beds from 2019 to 2020.
Prince Edward Island
| Community | General shelters | General beds | Men's shelters | Men's beds | Women's shelters | Women's beds | Youth shelters | Youth beds | Family shelters | Family beds | Total shelters | Total beds |
|---|---|---|---|---|---|---|---|---|---|---|---|---|
| Charlottetown | 0 | 0 | 1 | 10 | 1 | 8 | 0 | 0 | 0 | 0 | 2 | 18 |
| Total | 0 | 0 | 1 | 10 | 1 | 8 | 0 | 0 | 0 | 0 | 2 | 18* |
*There was an overall increase of 11 beds from 2019 to 2020.
Quebec
| Community | General shelters | General beds | Men's shelters | Men's beds | Women's shelters | Women's beds | Youth shelters | Youth beds | Family shelters | Family beds | Total shelters | Total beds |
|---|---|---|---|---|---|---|---|---|---|---|---|---|
| Alma | 1 | 8 | 0 | 0 | 0 | 0 | 0 | 0 | 0 | 0 | 1 | 8 |
| Drummondville | 0 | 0 | 0 | 0 | 0 | 0 | 1 | 9 | 1 | 9 | 2 | 18 |
| Fermont | 1 | 6 | 0 | 0 | 0 | 0 | 0 | 0 | 0 | 0 | 1 | 6 |
| Gatineau | 1 | 55 | 0 | 0 | 0 | 0 | 2 | 18 | 1 | 9 | 4 | 82 |
| Joliette | 1 | 8 | 0 | 0 | 0 | 0 | 2 | 21 | 0 | 0 | 3 | 29 |
| La Pocatière | 0 | 0 | 0 | 0 | 0 | 0 | 1 | 9 | 0 | 0 | 1 | 9 |
| Mont-Laurier | 1 | 9 | 0 | 0 | 0 | 0 | 0 | 0 | 0 | 0 | 1 | 9 |
| Montreal | 6 | 117 | 4 | 625 | 10 | 185 | 9 | 133 | 1 | 7 | 30 | 1,067 |
| Pointe-à-la-Croix | 1 | 7 | 0 | 0 | 0 | 0 | 0 | 0 | 0 | 0 | 1 | 7 |
| Quebec City Region | 2 | 50 | 1 | 39 | 3 | 34 | 5 | 57 | 0 | 0 | 11 | 180 |
| Rimouski | 0 | 0 | 0 | 0 | 0 | 0 | 1 | 10 | 0 | 0 | 1 | 10 |
| Rivière-du-Loup | 1 | 9 | 0 | 0 | 0 | 0 | 0 | 0 | 0 | 0 | 1 | 9 |
| Rouyn-Noranda | 1 | 15 | 0 | 0 | 0 | 0 | 0 | 0 | 0 | 0 | 1 | 15 |
| Saguenay | 2 | 4 | 1 | 25 | 1 | 7 | 0 | 0 | 0 | 0 | 4 | 36 |
| Saint-Georges | 1 | 23 | 0 | 0 | 0 | 0 | 0 | 0 | 0 | 0 | 1 | 23 |
| Saint-Hyacinthe | 0 | 0 | 0 | 0 | 0 | 0 | 1 | 9 | 0 | 0 | 1 | 9 |
| Salaberry-de-Valleyfield | 1 | 20 | 0 | 0 | 0 | 0 | 1 | 9 | 1 | 7 | 3 | 36 |
| Sept-Îles | 1 | 12 | 0 | 0 | 0 | 0 | 0 | 0 | 0 | 0 | 1 | 12 |
| Sherbrooke | 1 | 18 | 0 | 0 | 0 | 0 | 2 | 17 | 0 | 0 | 3 | 35 |
| Trois-Rivières | 2 | 30 | 0 | 0 | 0 | 0 | 0 | 0 | 0 | 0 | 2 | 30 |
| Val D'or | 1 | 28 | 0 | 0 | 0 | 0 | 0 | 0 | 0 | 0 | 1 | 28 |
| Total | 25 | 419 | 6 | 689 | 14 | 226 | 25 | 292 | 4 | 32 | 74 | 1,658* |
*There was an overall reduction of 243 beds from 2019 to 2020.
Saskatchewan
| Community | General shelters | General beds | Men's shelters | Men's beds | Women's shelters | Women's beds | Youth shelters | Youth beds | Family shelters | Family beds | Total shelters | Total beds |
|---|---|---|---|---|---|---|---|---|---|---|---|---|
| Lloydminster | 0 | 0 | 1 | 28 | 0 | 0 | 0 | 0 | 0 | 0 | 1 | 28 |
| Moose Jaw | 0 | 0 | 1 | 10 | 0 | 0 | 0 | 0 | 0 | 0 | 1 | 10 |
| North Battleford | 1 | 34 | 0 | 0 | 0 | 0 | 0 | 0 | 0 | 0 | 1 | 34 |
| Prince Albert | 1 | 22 | 0 | 0 | 1 | 48 | 0 | 0 | 0 | 0 | 2 | 70 |
| Regina | 0 | 0 | 2 | 50 | 2 | 38 | 1 | 15 | 0 | 0 | 5 | 103 |
| Saskatoon | 0 | 0 | 2 | 87 | 2 | 70 | 1 | 5 | 0 | 0 | 5 | 162 |
| Total | 2 | 56 | 6 | 175 | 5 | 156 | 2 | 20 | 0 | 0 | 15 | 407* |
*There was an overall reduction of 76 beds from 2019 to 2020.
Yukon
| Community | General shelters | General beds | Men's shelters | Men's beds | Women's shelters | Women's beds | Youth shelters | Youth beds | Family shelters | Family beds | Total shelters | Total beds |
|---|---|---|---|---|---|---|---|---|---|---|---|---|
| Dawson City | 0 | 0 | 1 | 3 | 0 | 0 | 0 | 0 | 0 | 0 | 1 | 3 |
| Whitehorse | 1 | 45 | 0 | 0 | 0 | 0 | 1 | 11 | 0 | 0 | 2 | 56 |
| Total | 1 | 45 | 1 | 3 | 0 | 0 | 1 | 11 | 0 | 0 | 3 | 59* |
*There was an overall increase of 20 beds from 2019 to 2020.
Appendix A: National summary – Transitional housing shelters
| Province or territory | Total shelters 2020 | Total beds 2020 | Total shelters 2019 | Total beds 2019 | Total shelters 2018 | Total beds 2018 |
|---|---|---|---|---|---|---|
| Alberta | 38 | 1,108 | 36 | 1,135 | 37 | 1,177 |
| British Columbia | 41 | 1,179 | 33 | 972 | 33 | 901 |
| Manitoba | 11 | 441 | 10 | 349 | 10 | 229 |
| New Brunswick | 7 | 48 | 4 | 37 | 2 | 14 |
| Newfoundland and Labrador | 4 | 32 | 4 | 102 | 4 | 102 |
| Northwest Territories | 5 | 97 | 5 | 98 | 3 | 63 |
| Nova Scotia | 10 | 125 | 10 | 128 | 8 | 119 |
| Nunavut* | 0 | 0 | 0 | 0 | 0 | 0 |
| Ontario | 116 | 2,128 | 106 | 2,134 | 104 | 2,188 |
| Prince Edward Island* | 0 | 0 | 0 | 0 | 0 | 0 |
| Quebec | 116 | 2,358 | 114 | 2,428 | 114 | 2,522 |
| Saskatchewan | 20 | 235 | 23 | 309 | 22 | 328 |
| Yukon | 2 | 4 | 1 | 2 | 1 | 2 |
| Canada | 370 | 7,755** | 364 | 7,694 | 338 | 7,645 |
*There were no transitional housing facilities identified Nunavut and Prince Edward Island in 2020.
**There was a national increase of 61 transitional beds from 2019 to 2020.
Appendix B: Transitional housing by clientele served (2020)
| Province or territory | General shelters | General beds | Men's shelters | Men's beds | Women's shelters | Women's beds | Youth shelters | Youth beds | Family shelters | Family beds | Total shelters | Total beds |
|---|---|---|---|---|---|---|---|---|---|---|---|---|
| Alberta | 6 | 90 | 8 | 616 | 7 | 194 | 15 | 136 | 2 | 72 | 38 | 1,108 |
| British Columbia | 26 | 838 | 5 | 136 | 5 | 127 | 5 | 78 | 0 | 0 | 41 | 1,179 |
| Manitoba | 5 | 274 | 2 | 58 | 1 | 55 | 3 | 54 | 0 | 0 | 11 | 441 |
| New Brunswick | 2 | 12 | 0 | 0 | 1 | 8 | 4 | 28 | 0 | 0 | 7 | 48 |
| Newfoundland and Labrador | 1 | 3 | 0 | 0 | 1 | 4 | 2 | 25 | 0 | 0 | 4 | 32 |
| Northwest Territories | 1 | 10 | 1 | 32 | 2 | 42 | 1 | 13 | 0 | 0 | 5 | 97 |
| Nova Scotia | 0 | 0 | 2 | 20 | 3 | 41 | 5 | 64 | 0 | 0 | 10 | 125 |
| Nunavut | 0 | 0 | 0 | 0 | 0 | 0 | 0 | 0 | 0 | 0 | 0 | 0 |
| Ontario | 20 | 457 | 22 | 600 | 24 | 349 | 42 | 496 | 8 | 226 | 116 | 2,128 |
| Prince Edward Island | 0 | 0 | 0 | 0 | 0 | 0 | 0 | 0 | 0 | 0 | 0 | 0 |
| Quebec | 24 | 436 | 18 | 714 | 29 | 670 | 41 | 499 | 4 | 39 | 116 | 2,358 |
| Saskatchewan | 5 | 82 | 3 | 40 | 4 | 54 | 8 | 59 | 0 | 0 | 20 | 235 |
| Yukon | 0 | 0 | 2 | 4 | 0 | 0 | 0 | 0 | 0 | 0 | 2 | 4 |
| Canada | 90 | 2,202 | 63 | 2,220 | 77 | 1,544 | 126 | 1,452 | 14 | 337 | 370 | 7,755 |
Appendix C: National summary – Domestic violence shelters*
| Province or territory | Total shelters 2020 | Total beds 2020 | Total shelters 2019 | Total beds 2019 | Total shelters 2018 | Total beds 2018 |
|---|---|---|---|---|---|---|
| Alberta | 52 | 1,329 | 54 | 1,291 | 46 | 1,223 |
| British Columbia | 109 | 1,329 | 132 | 1,259 | 93 | 953 |
| Manitoba | 19 | 414 | 23 | 385 | 17 | 364 |
| New Brunswick | 18 | 303 | 18 | 303 | 18 | 298 |
| Newfoundland and Labrador | 14 | 191 | 21 | 176 | 15 | 176 |
| Northwest Territories | 6 | 44 | 6 | 44 | 6 | 44 |
| Nova Scotia | 16 | 242 | 17 | 211 | 15 | 192 |
| Nunavut | 4 | 41 | 5 | 41 | 5 | 41 |
| Ontario | 134 | 2,629 | 136 | 2,510 | 119 | 2,466 |
| Prince Edward Island | 3 | 43 | 3 | 45 | 3 | 45 |
| Quebec | 104 | 1,466 | 109 | 1,370 | 95 | 1,360 |
| Saskatchewan | 16 | 277 | 15 | 238 | 14 | 283 |
| Yukon | 8 | 101 | 6 | 52 | 5 | 49 |
| Canada | 503 | 8,409** | 545 | 7,925 | 451 | 7,494 |
*The breakdown by clientele served is not included for domestic violence shelters, as the vast majority of beds serve women with, or without children.
**There was a national increase of 484 domestic violence shelter beds from 2019 to 2020.
Appendix D: Glossary
- Emergency shelters
- Facilities that provide temporary, short-term accommodation for homeless individuals and families. This may or may not include other services such as food, clothing or counselling. This excludes motel and hotel programs.
- Domestic violence shelters
- Facilities that provide temporary shelter to individuals and/or families fleeing domestic abuse or the threat of violence that functions either as a crisis capacity or as transitional housing.
- Family shelters
- Facilities that provide temporary, short-term accommodation specifically for families.
- General shelters
- Facilities that provide services to adult males and females. Some also accept youth.
- Homelessness
- The living situation of an individual or family who does not have stable, permanent, appropriate housing, or the immediate prospect, means and ability of acquiring a home.
- Large communities
- Communities with a population greater than 300,000.
- Men's shelters
- Facilities that provide services to adult males. Some also accept youth.
- Service providers
- Organizations that provide services to homeless individuals and families, and persons at risk of homelessness.
- Small communities
- Communities with a population of less than 300,000.
- Transitional housing
- Facilities that provide longer-term temporary shelter with a greater intensity of support services than emergency shelters. Transitional housing is an intermediate step between emergency shelter and permanent housing. Support services help clients to gain the stability and self-sufficiency needed to maintain permanent housing. Stays are typically between 3 months and 3 years.
- Youth shelters
- Facilities that provide services to youth. Shelters have varying definitions of youth, often ranging from 12 to 29 years of age.
- Women's shelters
- Facilities that provide services to adult females. Some also accept youth.
References
Statistics Canada. (2017). "Population and Dwelling Count Highlight Tables, 2016 Census" Census. Statistics Canada Catalogue no. 98-402-X2016001. Ottawa, Ontario. February 8.
Report a problem on this page
- Date modified: