
Shelter Capacity Report 2018
Shelter Capacity Report 2018
Introduction
The Shelter Capacity Report is a descriptive account of capacity statistics for emergency homeless shelters in Canada. The number of emergency shelter facilities and the number of permanent beds are reported for each province and territory, as well as by community. In addition, brief overviews of Transitional Housing facilities and Violence Against Women shelters are provided in the appendices.
This report is provided annually by Employment and Social Development Canada (ESDC), Homelessness Partnering Strategy (HPS). The information in this report was obtained from the National Service Provider List (NSPL), a comprehensive listing of homeless shelters in Canada. This list is maintained by ESDC as part of the National Homelessness Information System (NHIS), a data development initiative that focuses on the collection and analysis of homeless shelter data in Canada.
2018 Update
ESDC conducted a comprehensive update of the NSPL in 2018. Between August and December 2018, community entities (CE) were given the opportunity to update and validate information on services in their community. There was an 85% response rate from designated communities. Services in the remaining 15%, as well as non-designated communities with no CE were contacted directly to update their information. This approach sets a new baseline for the NSPL and ensures higher accuracy of findings. As a result, changes in the reported number of shelters and beds between 2017 and 2018 primarily reflect updated information rather than actual changes in national shelter capacity.
Types of shelters
Emergency shelters
Facilities that provide temporary, short-term accommodation for homeless individuals and families. This may or may not include other services such as food, clothing or counselling.
Transitional housing
Facilities that provide temporary shelter, but can be differentiated from emergency shelters by the longer length of stay and greater intensity of support services offered to clients. Transitional housing is an intermediate step between emergency shelter and permanent housing. Support services help clients gain stability and self-sufficiency to maintain permanent housing. Stays are typically between three months and three years.
Violence against women shelters
Facilities that provide temporary shelter to single women or women with children fleeing domestic abuse. They may function in either a crisis capacity or as transitional or second-stage housing
Emergency shelters and transitional housing are further characterized according to the clients they serve:
- Men’s shelters provide services to adult males. Some also accept youth.
- Women’s shelters provide services to adult females. Some also accept youth.
- General shelters provide services to adult males and females. Some also accept youth.
- Youth shelters provide services to youth. Shelters have varying definitions of youth, often ranging from 12 to 29 years of age.
- Family shelters provide services to families and adults with dependents. Some also accept single adult women without dependents.
National shelter capacity
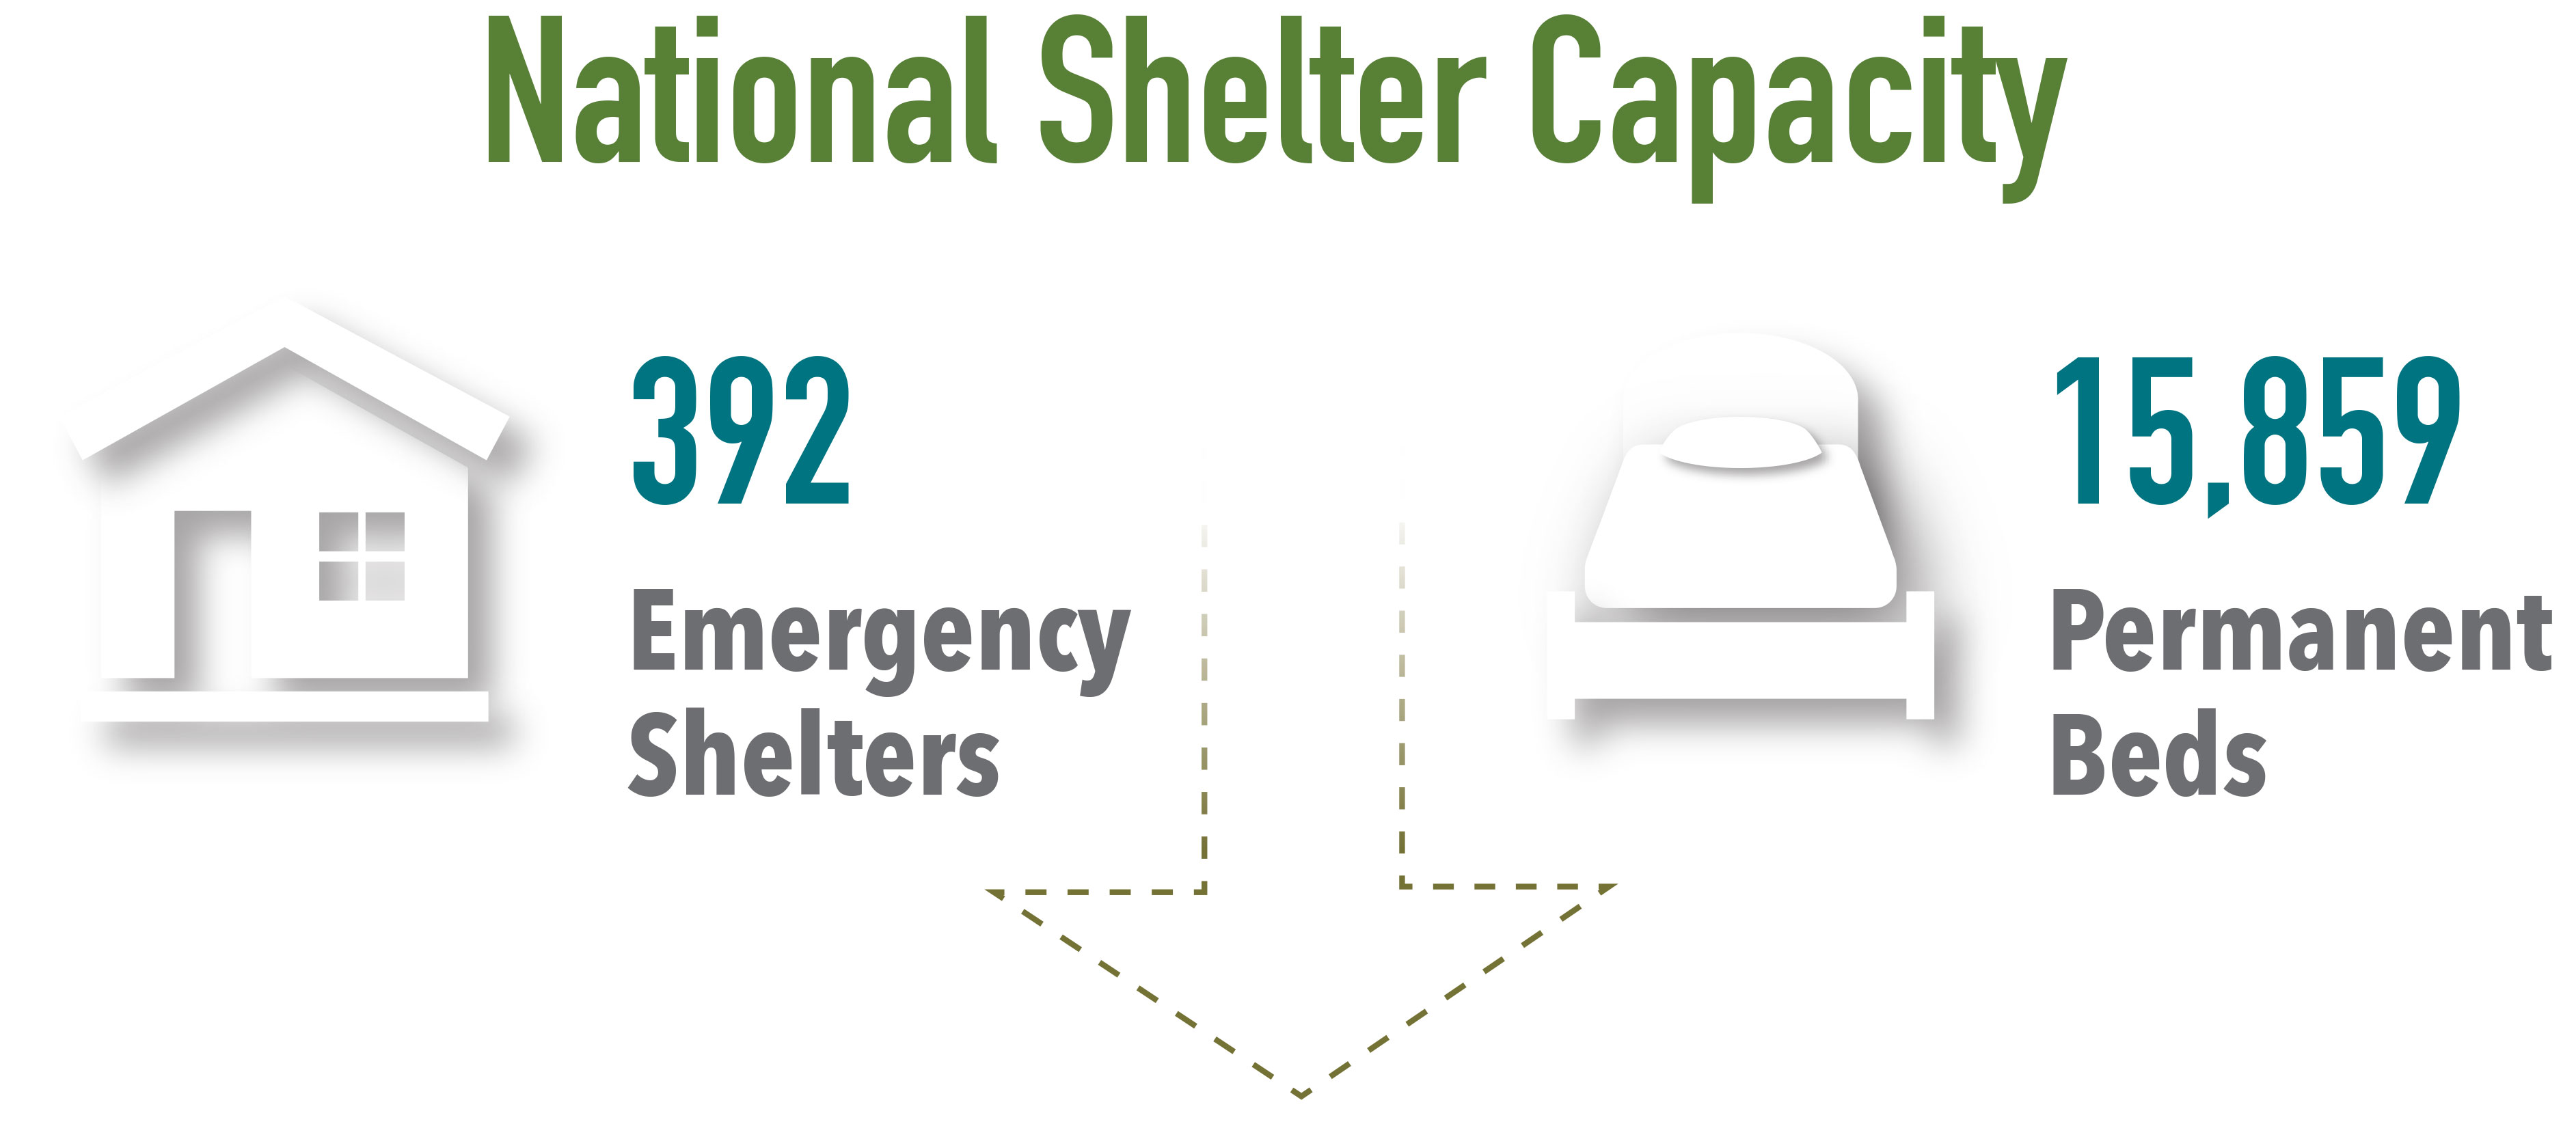
Figure 1 - Text version
There are 392 emergency shelters and 15,859 permanent shelter beds in Canada.
Emergency shelter beds by clientele served
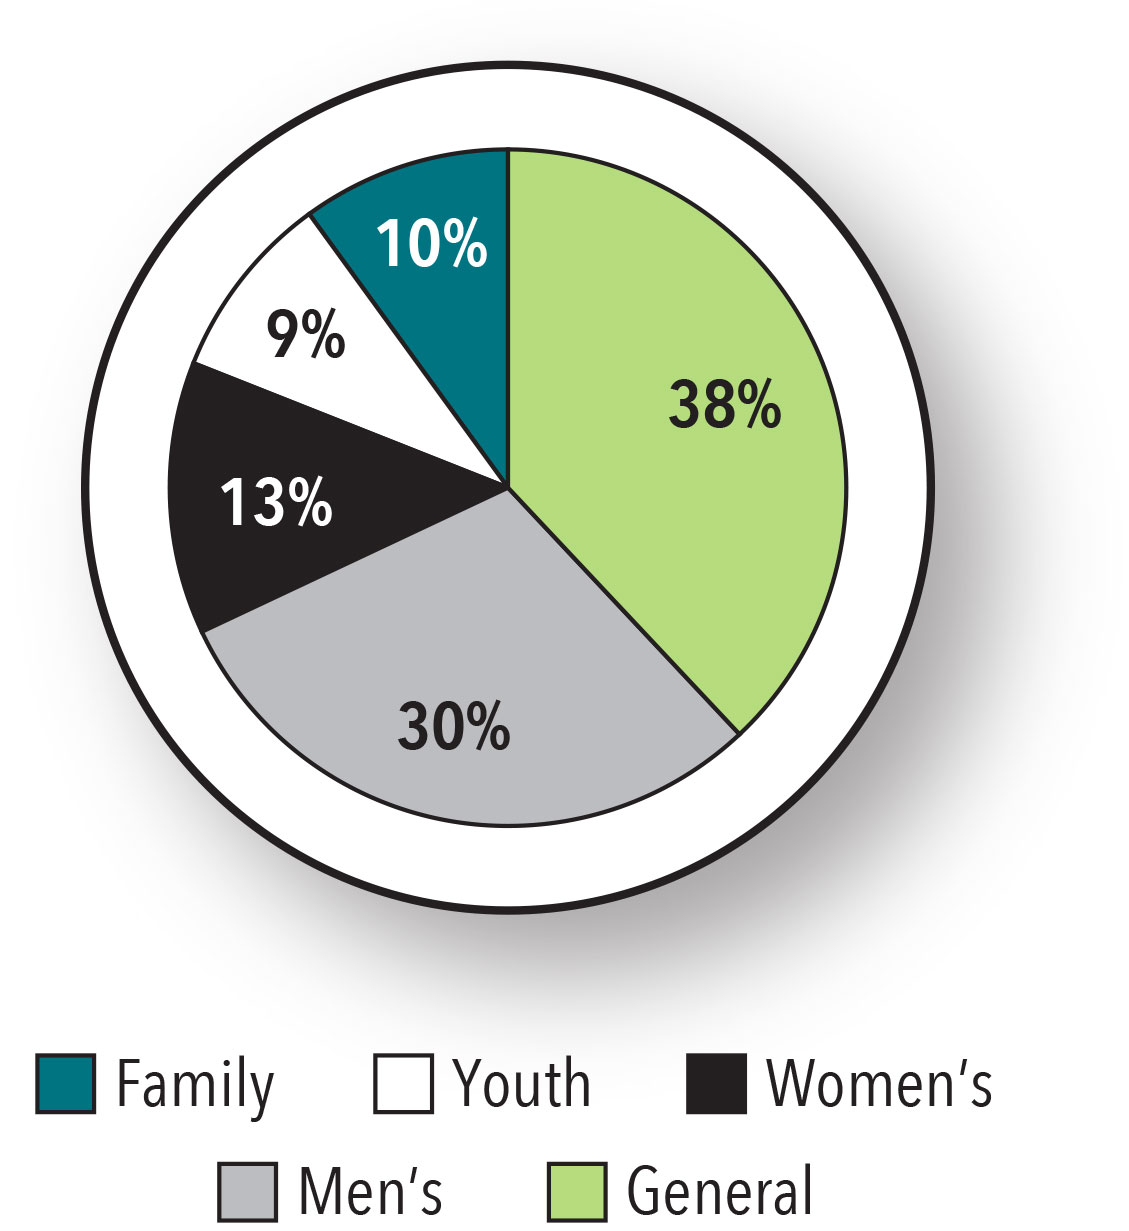
Figure 2 - Text version
- General 38%
- Men’s 30%
- Women’s 13%
- Youth 9%
- Family 10%
- 38% of shelter beds are in general shelters that serve both men and women.
- Men’s shelters account for a greater percentage of all shelter beds (30%) compared to women’s shelters (13%).
- Family shelters account for 10% of all shelter beds.
- Shelters that exclusively serve youth tend to be smaller in size. Although they make up almost a quarter of all shelters, they account only for 9% of all emergency shelter beds.
Community
The majority of emergency shelter beds (81%) are found in large cities. While smaller communities have fewer shelter beds, they still account for nearly half (41%) of all emergency shelters.
The average number of beds per shelter is 18 in small communities versus 55 in large communities.
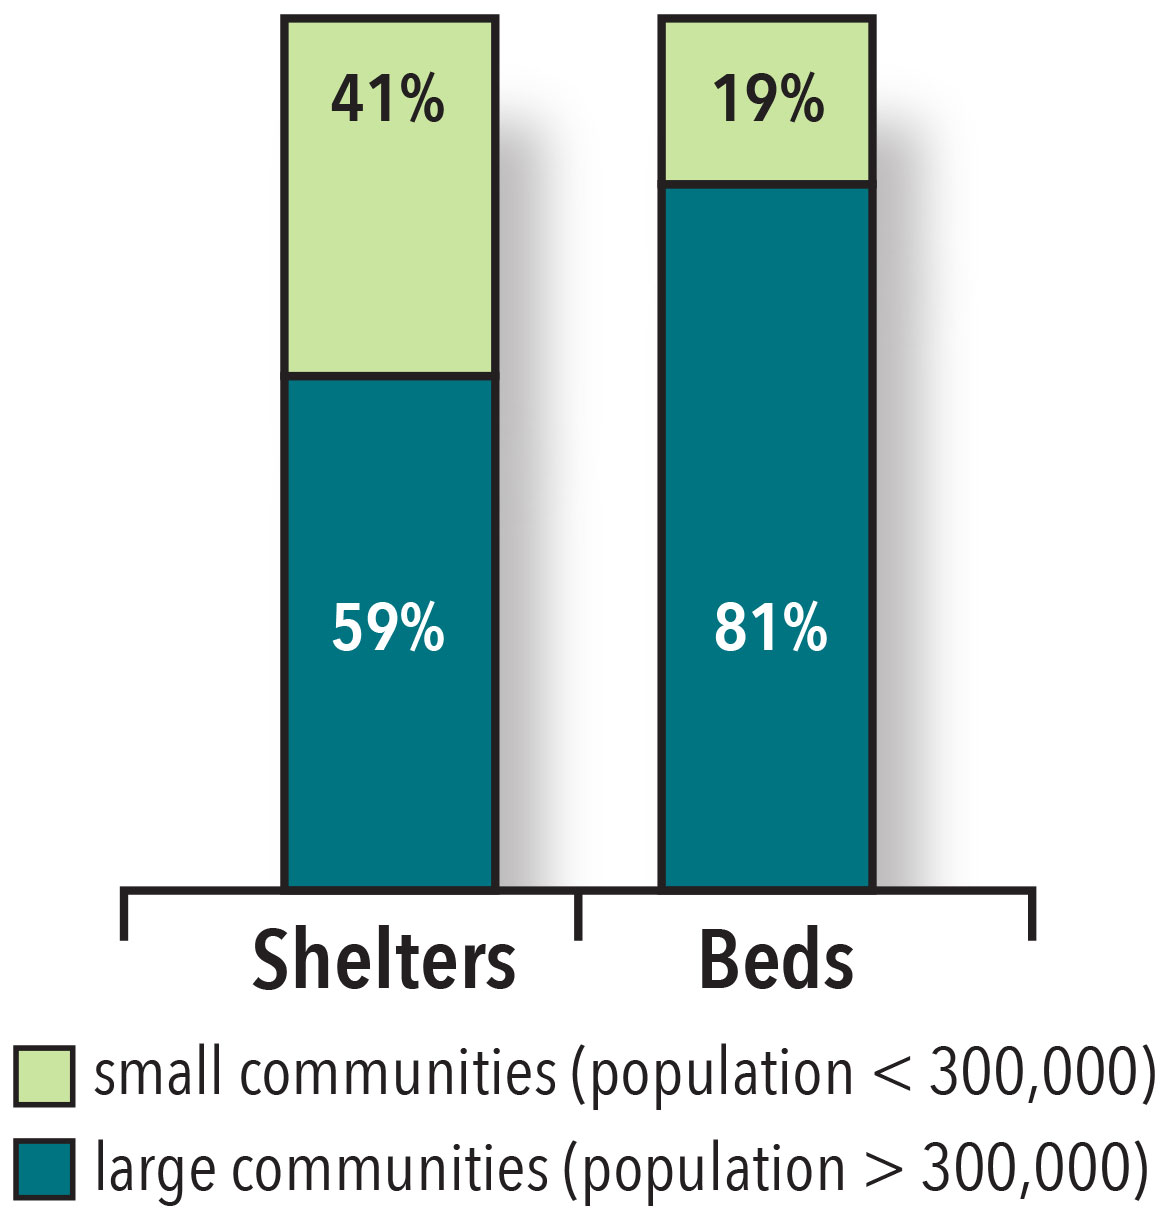
Figure 3 - Text version
- In Canada, 41% of emergency shelters are found in small communities with a population of less than 300,000.
- In Canada, 59% of emergency shelters are found in large communities with a population of 300,000 or more.
- In Canada, 19% of permanent shelter beds are found in small communities with a population of less than 300,000.
- In Canada, 81% of permanent shelter beds are found in large communities with a population of 300,000 or more.
National summary: Emergency shelters (2018)*
| Province/Territory | 2018 | 2017 | 2016 | |||
|---|---|---|---|---|---|---|
| Shelters | Beds | Shelters | Beds | Shelters | Beds | |
| Newfoundland and Labrador | 7 | 67 | 6 | 61 | 5 | 53 |
| Nova Scotia | 9 | 220 | 9 | 217 | 8 | 208 |
| New Brunswick | 9 | 157 | 9 | 148 | 9 | 150 |
| Prince Edward Island | 1 | 7 | 1 | 7 | 1 | 7 |
| Québec | 65 | 1,757 | 75 | 1,934 | 74 | 1,948 |
| Ontario | 149 | 6,898 | 149 | 6,764 | 147 | 6,622 |
| Manitoba | 13 | 650 | 15 | 661 | 15 | 661 |
| Saskatchewan | 18 | 476 | 21 | 443 | 21 | 439 |
| Alberta | 35 | 3,304 | 36 | 3,182 | 36 | 3,182 |
| British Columbia | 78 | 2,170 | 77 | 2,069 | 76 | 2,019 |
| Yukon | 3 | 27 | 3 | 27 | 3 | 27 |
| Northwest Territories | 3 | 82 | 3 | 76 | 4 | 100 |
| Nunavut | 2 | 44 | 2 | 34 | 2 | 34 |
| Canada | 392 | 15,859 | 407 | 15,623 | 401 | 15,450 |
*Changes in the reported number of shelters and beds during the years 2016 to 2018 may reflect updated information rather than actual changes in capacity.
Emergency shelters by clientele served (2018)
| Province/Territory | General | Men’s | Women’s | Youth | Family | Total | ||||||
|---|---|---|---|---|---|---|---|---|---|---|---|---|
| Shelters | Beds | Shelters | Beds | Shelters | Beds | Shelters | Beds | Shelters | Beds | Shelters | Beds | |
| Newfoundland and Labrador | 3 | 32 | 0 | 0 | 0 | 0 | 3 | 20 | 1 | 15 | 7 | 67 |
| Nova Scotia | 1 | 16 | 3 | 138 | 3 | 42 | 2 | 24 | 0 | 0 | 9 | 220 |
| New Brunswick | 4 | 82 | 2 | 45 | 2 | 20 | 1 | 10 | 0 | 0 | 9 | 157 |
| Prince Edward Island | 0 | 0 | 1 | 7 | 0 | 0 | 0 | 0 | 0 | 0 | 1 | 7 |
| Québec | 20 | 363 | 7 | 887 | 12 | 220 | 25 | 274 | 1 | 13 | 65 | 1,757 |
| Ontario | 27 | 1,053 | 39 | 2,701 | 27 | 1,067 | 32 | 774 | 24 | 1,303 | 149 | 6,898 |
| Manitoba | 8 | 520 | 0 | 0 | 0 | 0 | 2 | 24 | 3 | 106 | 13 | 650 |
| Saskatchewan | 2 | 56 | 6 | 156 | 7 | 225 | 3 | 39 | 0 | 0 | 18 | 476 |
| Alberta | 17 | 2,485 | 4 | 320 | 4 | 197 | 8 | 132 | 2 | 170 | 35 | 3,304 |
| British Columbia | 43 | 1,338 | 14 | 483 | 10 | 221 | 10 | 126 | 1 | 2 | 78 | 2,170 |
| Yukon | 1 | 14 | 1 | 2 | 0 | 0 | 1 | 11 | 0 | 0 | 3 | 27 |
| Northwest Territories | 0 | 0 | 1 | 49 | 1 | 25 | 1 | 8 | 0 | 0 | 3 | 82 |
| Nunavut | 0 | 0 | 1 | 32 | 1 | 12 | 0 | 0 | 0 | 0 | 2 | 44 |
| Canada | 126 | 5,959 | 79 | 4,820 | 67 | 2,029 | 88 | 1,442 | 32 | 1,609 | 392 | 15,859 |
Emergency shelters and shelter beds by community (2018)
| Community | General | Men’s | Women’s | Youth | Family | Total | ||||||
|---|---|---|---|---|---|---|---|---|---|---|---|---|
| Shelters | Beds | Shelters | Beds | Shelters | Beds | Shelters | Beds | Shelters | Beds | Shelters | Beds | |
| Happy Valley – Goose Bay | 1 | 8 | 0 | 0 | 0 | 0 | 0 | 0 | 0 | 0 | 1 | 8 |
| Natuashish | 0 | 0 | 0 | 0 | 0 | 0 | 1 | 3 | 0 | 0 | 1 | 3 |
| St. John’s | 2 | 24 | 0 | 0 | 0 | 0 | 2 | 17 | 1 | 15 | 5 | 56 |
| Total | 3 | 32 | 0 | 0 | 0 | 0 | 3 | 20 | 1 | 15 | 7 | 67 |
| Community | General | Men’s | Women’s | Youth | Family | Total | ||||||
|---|---|---|---|---|---|---|---|---|---|---|---|---|
| Shelters | Beds | Shelters | Beds | Shelters | Beds | Shelters | Beds | Shelters | Beds | Shelters | Beds | |
| Halifax | 0 | 0 | 2 | 126 | 2 | 36 | 1 | 20 | 0 | 0 | 5 | 182 |
| New Glasgow | 0 | 0 | 0 | 0 | 0 | 0 | 1 | 4 | 0 | 0 | 1 | 4 |
| Sydney | 0 | 0 | 1 | 12 | 1 | 6 | 0 | 0 | 0 | 0 | 2 | 18 |
| Truro | 1 | 16 | 0 | 0 | 0 | 0 | 0 | 0 | 0 | 0 | 1 | 16 |
| Total | 1 | 16 | 3 | 138 | 3 | 42 | 2 | 24 | 0 | 0 | 9 | 220 |
| Community | General | Men’s | Women’s | Youth | Family | Total | ||||||
|---|---|---|---|---|---|---|---|---|---|---|---|---|
| Shelters | Beds | Shelters | Beds | Shelters | Beds | Shelters | Beds | Shelters | Beds | Shelters | Beds | |
| Bathurst | 1 | 12 | 0 | 0 | 0 | 0 | 0 | 0 | 0 | 0 | 1 | 12 |
| Fredericton | 1 | 10 | 1 | 25 | 1 | 10 | 0 | 0 | 0 | 0 | 3 | 45 |
| Moncton | 2 | 60 | 0 | 0 | 0 | 0 | 0 | 0 | 0 | 0 | 2 | 60 |
| Saint John | 0 | 0 | 1 | 20 | 1 | 10 | 1 | 10 | 0 | 0 | 3 | 40 |
| Total | 4 | 82 | 2 | 45 | 2 | 20 | 1 | 10 | 0 | 0 | 9 | 157 |
| Community | General | Men’s | Women’s | Youth | Family | Total | ||||||
|---|---|---|---|---|---|---|---|---|---|---|---|---|
| Shelters | Beds | Shelters | Beds | Shelters | Beds | Shelters | Beds | Shelters | Beds | Shelters | Beds | |
| Charlottetown | 0 | 0 | 1 | 7 | 0 | 0 | 0 | 0 | 0 | 0 | 1 | 7 |
| Total | 0 | 0 | 1 | 7 | 0 | 0 | 0 | 0 | 0 | 0 | 1 | 7 |
| Community | General | Men’s | Women’s | Youth | Family | Total | ||||||
|---|---|---|---|---|---|---|---|---|---|---|---|---|
| Shelters | Beds | Shelters | Beds | Shelters | Beds | Shelters | Beds | Shelters | Beds | Shelters | Beds | |
| Alma | 1 | 1 | 0 | 0 | 0 | 0 | 0 | 0 | 0 | 0 | 1 | 1 |
| Drummondville | 0 | 0 | 0 | 0 | 0 | 0 | 2 | 18 | 0 | 0 | 2 | 18 |
| Fermont | 1 | 6 | 0 | 0 | 0 | 0 | 0 | 0 | 0 | 0 | 1 | 6 |
| Gatineau | 1 | 55 | 0 | 0 | 0 | 0 | 2 | 16 | 0 | 0 | 3 | 71 |
| Joliette | 1 | 6 | 0 | 0 | 0 | 0 | 2 | 21 | 0 | 0 | 3 | 27 |
| La Pocatière | 0 | 0 | 0 | 0 | 0 | 0 | 1 | 9 | 0 | 0 | 1 | 9 |
| Mont-Laurier | 1 | 9 | 0 | 0 | 0 | 0 | 0 | 0 | 0 | 0 | 1 | 9 |
| Montreal | 7 | 132 | 4 | 811 | 9 | 185 | 9 | 125 | 1 | 13 | 30 | 1,266 |
| Quebec City | 2 | 52 | 1 | 39 | 3 | 35 | 4 | 37 | 0 | 0 | 10 | 163 |
| Rimouski | 0 | 0 | 0 | 0 | 0 | 0 | 1 | 10 | 0 | 0 | 1 | 10 |
| Rouyn-Noranda | 1 | 15 | 0 | 0 | 0 | 0 | 0 | 0 | 0 | 0 | 1 | 15 |
| Saguenay | 0 | 0 | 1 | 29 | 0 | 0 | 0 | 0 | 0 | 0 | 1 | 29 |
| Saint-Georges | 1 | 23 | 0 | 0 | 0 | 0 | 0 | 0 | 0 | 0 | 1 | 23 |
| Saint-Hyacinthe | 0 | 0 | 0 | 0 | 0 | 0 | 1 | 9 | 0 | 0 | 1 | 9 |
| Salaberry-de-Valleyfield | 1 | 20 | 0 | 0 | 0 | 0 | 1 | 9 | 0 | 0 | 2 | 29 |
| Sherbrooke | 1 | 18 | 1 | 8 | 0 | 0 | 1 | 9 | 0 | 0 | 3 | 35 |
| Trois-Rivières | 2 | 26 | 0 | 0 | 0 | 0 | 1 | 11 | 0 | 0 | 3 | 37 |
| Total | 20 | 363 | 7 | 722 | 12 | 220 | 25 | 274 | 1 | 13 | 65 | 1,757 |
| Community | General | Men’s | Women’s | Youth | Family | Total | ||||||
|---|---|---|---|---|---|---|---|---|---|---|---|---|
| Shelters | Beds | Shelters | Beds | Shelters | Beds | Shelters | Beds | Shelters | Beds | Shelters | Beds | |
| Barrie-Simcoe | 2 | 38 | 2 | 34 | 0 | 0 | 1 | 15 | 0 | 0 | 5 | 87 |
| Brantford | 1 | 36 | 1 | 28 | 0 | 0 | 1 | 20 | 0 | 0 | 3 | 84 |
| Cobourg | 1 | 20 | 0 | 0 | 0 | 0 | 0 | 0 | 0 | 0 | 1 | 20 |
| Cochrane | 0 | 0 | 1 | 6 | 0 | 0 | 0 | 0 | 0 | 0 | 1 | 6 |
| Dufferin Region | 0 | 0 | 0 | 0 | 0 | 0 | 1 | 20 | 0 | 0 | 1 | 20 |
| Durham Region | 0 | 0 | 1 | 40 | 1 | 45 | 1 | 13 | 1 | 20 | 4 | 118 |
| Guelph | 0 | 0 | 1 | 22 | 1 | 16 | 1 | 16 | 1 | 0 | 4 | 54 |
| Halton Region | 1 | 32 | 0 | 0 | 0 | 0 | 0 | 0 | 1 | 0* | 2 | 32 |
| Hamilton | 0 | 0 | 3 | 215 | 3 | 51 | 1 | 20 | 1 | 103 | 8 | 389 |
| Kenora | 1 | 20 | 0 | 0 | 0 | 0 | 0 | 0 | 0 | 0 | 1 | 20 |
| Kingston | 1 | 29 | 0 | 0 | 0 | 0 | 1 | 15 | 1 | 19 | 3 | 63 |
| Lindsay | 0 | 0 | 0 | 0 | 0 | 0 | 0 | 0 | 1 | 19 | 1 | 19 |
| London | 2 | 58 | 2 | 198 | 1 | 10 | 1 | 36 | 1 | 41 | 7 | 343 |
| Niagara Region | 2 | 55 | 2 | 32 | 2 | 40 | 2 | 20 | 1 | 18 | 9 | 165 |
| Nipissing/North Bay | 1 | 19 | 0 | 0 | 1 | 10 | 0 | 0 | 0 | 0 | 2 | 29 |
| Ottawa | 1 | 76 | 3 | 459 | 2 | 125 | 1 | 28 | 3 | 277 | 10 | 965 |
| Owen Sound | 0 | 0 | 0 | 0 | 0 | 0 | 0 | 0 | 1 | 0* | 1 | 0 |
| Peel Region | 1 | 119 | 1 | 86 | 0 | 0 | 2 | 54 | 1 | 225 | 5 | 484 |
| Peterborough | 0 | 0 | 1 | 40 | 1 | 10 | 0 | 0 | 1 | 30 | 3 | 80 |
| Red Lake | 1 | 16 | 0 | 0 | 0 | 0 | 0 | 0 | 0 | 0 | 1 | 16 |
| Sarnia | 1 | 25 | 1 | 20 | 0 | 0 | 1 | 9 | 1 | 3 | 4 | 57 |
| Sault Ste. Marie | 0 | 0 | 1 | 23 | 1 | 7 | 1 | 12 | 1 | 4 | 4 | 46 |
| Sioux Lookout | 1 | 20 | 0 | 0 | 0 | 0 | 0 | 0 | 0 | 0 | 1 | 20 |
| Sudbury | 0 | 0 | 1 | 22 | 0 | 0 | 1 | 16 | 1 | 26 | 3 | 64 |
| Thunder Bay | 1 | 42 | 1 | 17 | 0 | 0 | 0 | 0 | 0 | 0 | 2 | 59 |
| Toronto | 5 | 244 | 14 | 1,347 | 12 | 715 | 9 | 391 | 4 | 382 | 44 | 3,079 |
| Waterloo Region | 1 | 78 | 1 | 51 | 0 | 0 | 4 | 47 | 1 | 66 | 7 | 242 |
| Windsor | 2 | 108 | 1 | 31 | 1 | 11 | 0 | 0 | 0 | 0 | 4 | 150 |
| Woodstock | 1 | 18 | 0 | 0 | 0 | 0 | 0 | 0 | 1 | 10 | 2 | 28 |
| York Region | 0 | 0 | 1 | 30 | 1 | 27 | 3 | 42 | 1 | 60 | 6 | 159 |
| Total | 27 | 1,053 | 39 | 2,701 | 27 | 1,067 | 32 | 774 | 24 | 1,303 | 149 | 6,898 |
* This is an emergency motel program with no fixed capacity. They only provide a bed in a motel when it is needed.
| Community | General | Men’s | Women’s | Youth | Family | Total | ||||||
|---|---|---|---|---|---|---|---|---|---|---|---|---|
| Shelters | Beds | Shelters | Beds | Shelters | Beds | Shelters | Beds | Shelters | Beds | Shelters | Beds | |
| Brandon | 1 | 25 | 0 | 0 | 0 | 0 | 0 | 0 | 1 | 12 | 2 | 37 |
| Dauphin | 1 | 17 | 0 | 0 | 0 | 0 | 0 | 0 | 0 | 0 | 1 | 17 |
| Flin Flon | 1 | 10 | 0 | 0 | 0 | 0 | 0 | 0 | 0 | 0 | 1 | 10 |
| Swan River | 1 | 9 | 0 | 0 | 0 | 0 | 0 | 0 | 0 | 0 | 1 | 9 |
| The Pas | 0 | 0 | 0 | 0 | 0 | 0 | 0 | 0 | 1 | 34 | 1 | 34 |
| Thompson | 1 | 24 | 0 | 0 | 0 | 0 | 0 | 0 | 0 | 0 | 1 | 24 |
| Winnipeg | 3 | 435 | 0 | 0 | 0 | 0 | 2 | 24 | 1 | 60 | 6 | 519 |
| Total | 8 | 520 | 0 | 0 | 0 | 0 | 2 | 24 | 3 | 106 | 13 | 650 |
| Community | General | Men’s | Women’s | Youth | Family | Total | ||||||
|---|---|---|---|---|---|---|---|---|---|---|---|---|
| Shelters | Beds | Shelters | Beds | Shelters | Beds | Shelters | Beds | Shelters | Beds | Shelters | Beds | |
| Moose Jaw | 0 | 0 | 1 | 10 | 0 | 0 | 0 | 0 | 0 | 0 | 1 | 10 |
| North Battleford | 1 | 34 | 0 | 0 | 0 | 0 | 0 | 0 | 0 | 0 | 1 | 34 |
| Prince Albert | 1 | 22 | 0 | 0 | 1 | 50 | 0 | 0 | 0 | 0 | 2 | 72 |
| Regina | 0 | 0 | 2 | 64 | 2 | 76 | 1 | 15 | 0 | 0 | 5 | 155 |
| Saskatoon | 0 | 0 | 3 | 82 | 4 | 99 | 2 | 24 | 0 | 0 | 9 | 205 |
| Total | 2 | 56 | 6 | 156 | 7 | 225 | 3 | 39 | 0 | 0 | 18 | 476 |
| Community | General | Men’s | Women’s | Youth | Family | Total | ||||||
|---|---|---|---|---|---|---|---|---|---|---|---|---|
| Shelters | Beds | Shelters | Beds | Shelters | Beds | Shelters | Beds | Shelters | Beds | Shelters | Beds | |
| Brocket | 1 | 0 | 0 | 0 | 0 | 0 | 0 | 0 | 0 | 0 | 1 | 0 |
| Calgary | 3 | 1,723 | 1 | 80 | 2 | 61 | 1 | 18 | 2 | 170 | 9 | 2,052 |
| Edmonton | 2 | 330 | 1 | 180 | 2 | 136 | 3 | 81 | 0 | 0 | 8 | 727 |
| Grande Prairie | 1 | 92 | 0 | 0 | 0 | 0 | 1 | 12 | 0 | 0 | 2 | 104 |
| High Level | 1 | 20 | 0 | 0 | 0 | 0 | 0 | 0 | 0 | 0 | 1 | 20 |
| Lac La Biche | 1 | 9 | 0 | 0 | 0 | 0 | 0 | 0 | 0 | 0 | 1 | 9 |
| Lethbridge | 1 | 80 | 0 | 0 | 0 | 0 | 1 | 8 | 0 | 0 | 2 | 88 |
| Lloydminster | 0 | 0 | 1 | 28 | 0 | 0 | 0 | 0 | 0 | 0 | 1 | 28 |
| Medicine Hat | 1 | 30 | 0 | 0 | 0 | 0 | 1 | 1 | 0 | 0 | 2 | 31 |
| Red Deer | 2 | 72 | 0 | 0 | 0 | 0 | 1 | 12 | 0 | 0 | 3 | 84 |
| Standoff | 1 | 0 | 0 | 0 | 0 | 0 | 0 | 0 | 0 | 0 | 1 | 0 |
| Strathmore | 1 | 10 | 0 | 0 | 0 | 0 | 0 | 0 | 0 | 0 | 1 | 10 |
| Wood Buffalo | 2 | 119 | 1 | 32 | 0 | 0 | 0 | 0 | 0 | 0 | 3 | 151 |
| Total | 17 | 2,485 | 4 | 320 | 4 | 197 | 8 | 132 | 2 | 170 | 35 | 3,304 |
| Community | General | Men’s | Women’s | Youth | Family | Total | ||||||
|---|---|---|---|---|---|---|---|---|---|---|---|---|
| Shelters | Beds | Shelters | Beds | Shelters | Beds | Shelters | Beds | Shelters | Beds | Shelters | Beds | |
| Abbotsford | 1 | 20 | 0 | 0 | 0 | 0 | 1 | 6 | 0 | 0 | 2 | 26 |
| Campbell River | 1 | 22 | 0 | 0 | 0 | 0 | 0 | 0 | 0 | 0 | 1 | 22 |
| Chetwynd | 1 | 3 | 0 | 0 | 0 | 0 | 0 | 0 | 0 | 0 | 1 | 3 |
| Chilliwack | 2 | 57 | 0 | 0 | 0 | 0 | 1 | 7 | 0 | 0 | 3 | 64 |
| Courtenay | 1 | 14 | 0 | 0 | 0 | 0 | 0 | 0 | 0 | 0 | 1 | 14 |
| Dawson Creek | 1 | 8 | 0 | 0 | 0 | 0 | 0 | 0 | 0 | 0 | 1 | 8 |
| Duncan | 1 | 15 | 0 | 0 | 0 | 0 | 0 | 0 | 0 | 0 | 1 | 15 |
| Fort Nelson | 0 | 0 | 1 | 6 | 0 | 0 | 0 | 0 | 0 | 0 | 1 | 6 |
| Fort St. John | 1 | 24 | 0 | 0 | 0 | 0 | 0 | 0 | 0 | 0 | 1 | 24 |
| Hope | 1 | 4 | 0 | 0 | 0 | 0 | 0 | 0 | 0 | 0 | 1 | 4 |
| Kamloops | 1 | 42 | 0 | 0 | 0 | 0 | 1 | 4 | 0 | 0 | 2 | 46 |
| Kelowna | 0 | 0 | 1 | 60 | 1 | 20 | 1 | 10 | 0 | 0 | 3 | 90 |
| Mission | 1 | 20 | 0 | 0 | 0 | 0 | 0 | 0 | 0 | 0 | 1 | 20 |
| Nanaimo | 0 | 0 | 1 | 23 | 1 | 14 | 0 | 0 | 0 | 0 | 2 | 37 |
| Nelson | 1 | 17 | 0 | 0 | 0 | 0 | 0 | 0 | 0 | 0 | 1 | 17 |
| Penticton | 1 | 16 | 0 | 0 | 0 | 0 | 0 | 0 | 0 | 0 | 1 | 16 |
| Port Alberni | 1 | 12 | 0 | 0 | 0 | 0 | 0 | 0 | 0 | 0 | 1 | 12 |
| Prince George | 1 | 30 | 1 | 21 | 1 | 30 | 1 | 10 | 0 | 0 | 4 | 91 |
| Prince Rupert | 1 | 8 | 0 | 0 | 0 | 0 | 0 | 0 | 0 | 0 | 1 | 8 |
| Quesnel | 1 | 10 | 0 | 0 | 0 | 0 | 0 | 0 | 0 | 0 | 1 | 10 |
| Sechelt | 1 | 19 | 0 | 0 | 0 | 0 | 0 | 0 | 0 | 0 | 1 | 19 |
| Smithers | 1 | 9 | 0 | 0 | 0 | 0 | 0 | 0 | 0 | 0 | 1 | 9 |
| Squamish | 1 | 12 | 0 | 0 | 0 | 0 | 0 | 0 | 0 | 0 | 1 | 12 |
| Terrace | 1 | 16 | 0 | 0 | 0 | 0 | 0 | 0 | 0 | 0 | 1 | 16 |
| Vancouver | 18 | 821 | 8 | 328 | 6 | 132 | 4 | 79 | 0 | 0 | 36 | 1,360 |
| Vernon | 1 | 25 | 1 | 24 | 0 | 0 | 0 | 0 | 0 | 0 | 2 | 49 |
| Victoria | 1 | 84 | 1 | 21 | 1 | 25 | 1 | 10 | 1 | 2 | 5 | 142 |
| Williams Lake | 1 | 30 | 0 | 0 | 0 | 0 | 0 | 0 | 0 | 0 | 1 | 30 |
| Total | 43 | 1,338 | 14 | 483 | 10 | 221 | 10 | 126 | 1 | 2 | 78 | 2,170 |
| Community | General | Men’s | Women’s | Youth | Family | Total | ||||||
|---|---|---|---|---|---|---|---|---|---|---|---|---|
| Shelters | Beds | Shelters | Beds | Shelters | Beds | Shelters | Beds | Shelters | Beds | Shelters | Beds | |
| Dawson City | 0 | 0 | 0 | 0 | 1 | 2 | 0 | 0 | 0 | 0 | 1 | 2 |
| Whitehorse | 1 | 14 | 0 | 0 | 0 | 0 | 1 | 11 | 0 | 0 | 2 | 25 |
| Total | 1 | 14 | 0 | 0 | 1 | 2 | 1 | 11 | 0 | 0 | 3 | 27 |
| Community | General | Men’s | Women’s | Youth | Family | Total | ||||||
|---|---|---|---|---|---|---|---|---|---|---|---|---|
| Shelters | Beds | Shelters | Beds | Shelters | Beds | Shelters | Beds | Shelters | Beds | Shelters | Beds | |
| Yellowknife | 0 | 0 | 1 | 49 | 1 | 25 | 1 | 8 | 0 | 0 | 3 | 82 |
| Total | 0 | 0 | 1 | 49 | 1 | 25 | 1 | 8 | 0 | 0 | 3 | 82 |
| Community | General | Men’s | Women’s | Youth | Family | Total | ||||||
|---|---|---|---|---|---|---|---|---|---|---|---|---|
| Shelters | Beds | Shelters | Beds | Shelters | Beds | Shelters | Beds | Shelters | Beds | Shelters | Beds | |
| Iqaluit | 0 | 0 | 1 | 32 | 1 | 12 | 0 | 0 | 0 | 0 | 2 | 44 |
| Total | 0 | 0 | 1 | 32 | 1 | 12 | 0 | 0 | 0 | 0 | 2 | 44 |
Appendix A: Transitional housing by clientele served (2018)
| Province/Territory | General | Men’s | Women’s | Youth | Family | Total | ||||||
|---|---|---|---|---|---|---|---|---|---|---|---|---|
| Shelters | Beds | Shelters | Beds | Shelters | Beds | Shelters | Beds | Shelters | Beds | Shelters | Beds | |
| Newfoundland and Labrador | 1 | 74 | 0 | 0 | 1 | 3 | 2 | 25 | 0 | 0 | 4 | 102 |
| Nova Scotia | 0 | 0 | 1 | 19 | 4 | 55 | 3 | 45 | 0 | 0 | 8 | 119 |
| New Brunswick | 1 | 4 | 0 | 0 | 0 | 0 | 1 | 10 | 0 | 0 | 2 | 14 |
| Prince Edward Island | 0 | 0 | 0 | 0 | 0 | 0 | 0 | 0 | 0 | 0 | 0 | 0 |
| Québec | 26 | 447 | 14 | 668 | 26 | 745 | 42 | 566 | 6 | 96 | 114 | 2,522 |
| Ontario | 23 | 519 | 18 | 646 | 24 | 398 | 34 | 442 | 5 | 183 | 104 | 2,188 |
| Manitoba | 6 | 144 | 2 | 58 | 0 | 0 | 2 | 27 | 0 | 0 | 10 | 229 |
| Saskatchewan | 5 | 106 | 5 | 88 | 5 | 65 | 6 | 62 | 1 | 7 | 22 | 328 |
| Alberta | 10 | 296 | 7 | 575 | 6 | 151 | 13 | 152 | 1 | 3 | 37 | 1,177 |
| British Columbia | 20 | 667 | 4 | 109 | 4 | 57 | 5 | 68 | 0 | 0 | 33 | 901 |
| Yukon | 0 | 0 | 1 | 2 | 0 | 0 | 0 | 0 | 0 | 0 | 1 | 2 |
| Northwest Territories | 0 | 0 | 1 | 32 | 1 | 18 | 1 | 13 | 0 | 0 | 3 | 63 |
| Nunavut | 0 | 0 | 0 | 0 | 0 | 0 | 0 | 0 | 0 | 0 | 0 | 0 |
| Canada | 92 | 2,257 | 53 | 2,197 | 71 | 1,492 | 109 | 1,410 | 13 | 289 | 338 | 7,645 |

Figure 4 - Text version
- General 30%
- Men’s 29%
- Women’s 19%
- Youth 18%
- Family 4%
Appendix B: Violence against women shelters (2018)
| Province/Territory | Shelters | Beds |
|---|---|---|
| Newfoundland and Labrador | 15 | 176 |
| Nova Scotia | 15 | 192 |
| New Brunswick | 18 | 298 |
| Prince Edward Island | 3 | 45 |
| Québec | 95 | 1,360 |
| Ontario | 119 | 2,466 |
| Manitoba | 17 | 364 |
| Saskatchewan | 14 | 283 |
| Alberta | 46 | 1,223 |
| British Columbia | 93 | 953 |
| Yukon | 5 | 49 |
| Northwest Territories | 6 | 44 |
| Nunavut | 5 | 41 |
| Canada | 451 | 7,494 |
Report a problem on this page
- Date modified: