
Shelter Capacity Report 2017
Shelter Capacity Report 2017
Alternate formats
Shelter Capacity report 2017 [PDF - 1.23 MB]
Request other formats online or call 1 800 O-Canada (1-800-622-6232). If you use a teletypewriter (TTY), call 1-800-926-9105. Large print, braille, audio cassette, audio CD, e-text diskette, e-text CD and DAISY are available on demand.
Introduction
The Shelter Capacity Report is a descriptive account of capacity statistics for emergency homeless shelters in Canada. The number of emergency shelter facilities and the number of permanent beds are reported for each province and territory, as well as by community. In addition, brief overviews of Transitional Housing facilities and Violence Against Women shelters are provided in the appendices.
This report is provided annually by Employment and Social Development Canada (ESDC), Homelessness Partnering Strategy (HPS). The information in this report was obtained from the National Service Provider List (NSPL), a comprehensive listing of homeless shelters in Canada. This list is maintained by ESDC as part of the National Homelessness Information System (NHIS), a data development initiative that focuses on the collection and analysis of homeless shelter data in Canada.
Types of shelters
Emergency shelters
Facilities that provide temporary, short-term accommodation for homeless individuals and families. This may or may not include other services such as food, clothing or counselling.
Transitional housing
Facilities that provide temporary shelter, but can be differentiated from emergency shelters by the longer length of stay and greater intensity of support services offered to clients. Transitional housing is an intermediate step between emergency shelter and permanent housing. Support services help clients gain stability and self-sufficiency to maintain permanent housing. Stays are typically between 3 months and 3 years.
Violence against women shelters
Facilities that provide temporary shelter to single women or women with children fleeing domestic abuse. They may function in either a crisis capacity or as transitional or second-stage housing.
Emergency shelters and transitional housing are further characterized according to the clients they serve:
- Men’s shelters provide services to adult males. Some also accept youth.
- Women’s shelters provide services to adult females. Some also accept youth.
- General shelters provide services to adult males and females. Some also accept youth.
- Youth shelters provide services to youth. Shelters have varying definitions of youth, often ranging from 12 to 29 years of age.
- Family shelters provide services to families and adults with dependents. Some also accept single adult women without dependents.
Shelter capacity

Figure 1 - Text version
There are 407 emergency shelters and 15,623 permanent shelter beds in Canada.
These numbers have remained relatively stable over the past 5 years.
Emergency shelter beds by clientele served
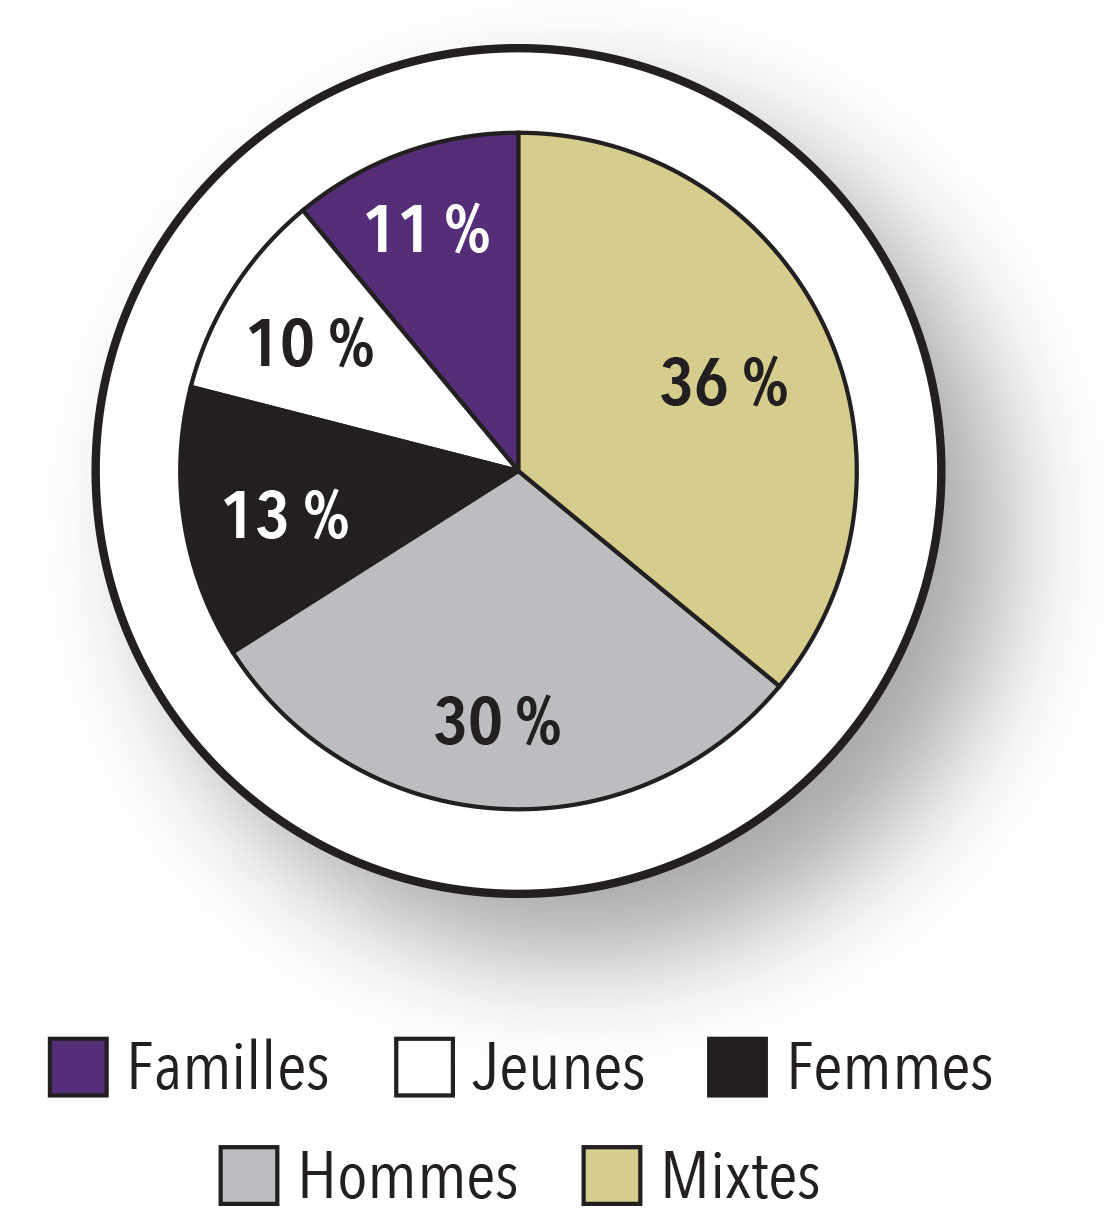
Figure 2 - Text version
- General 36%
- Men’s 30%
- Women’s 13%
- Youth 10%
- Family 11%
- 36% of shelter beds in Canada are found in general shelters serving both men and women
- Men’s shelters account for a greater percentage of all shelter beds (30%) compared to women’s shelters (13%)
- Family shelters account for 11% of all shelter beds
- Shelters that exclusively serve youth tend to be smaller in size. Although they make up almost a quarter of all shelters, they account only for 10% of all emergency shelter beds
Community
The majority of emergency shelter beds (82%) are found in large cities. While smaller communities have fewer shelter beds, they still account for nearly half (38%) of all emergency shelters.
The average number of beds is 18 per shelter in small communities versus 51 in large communities.
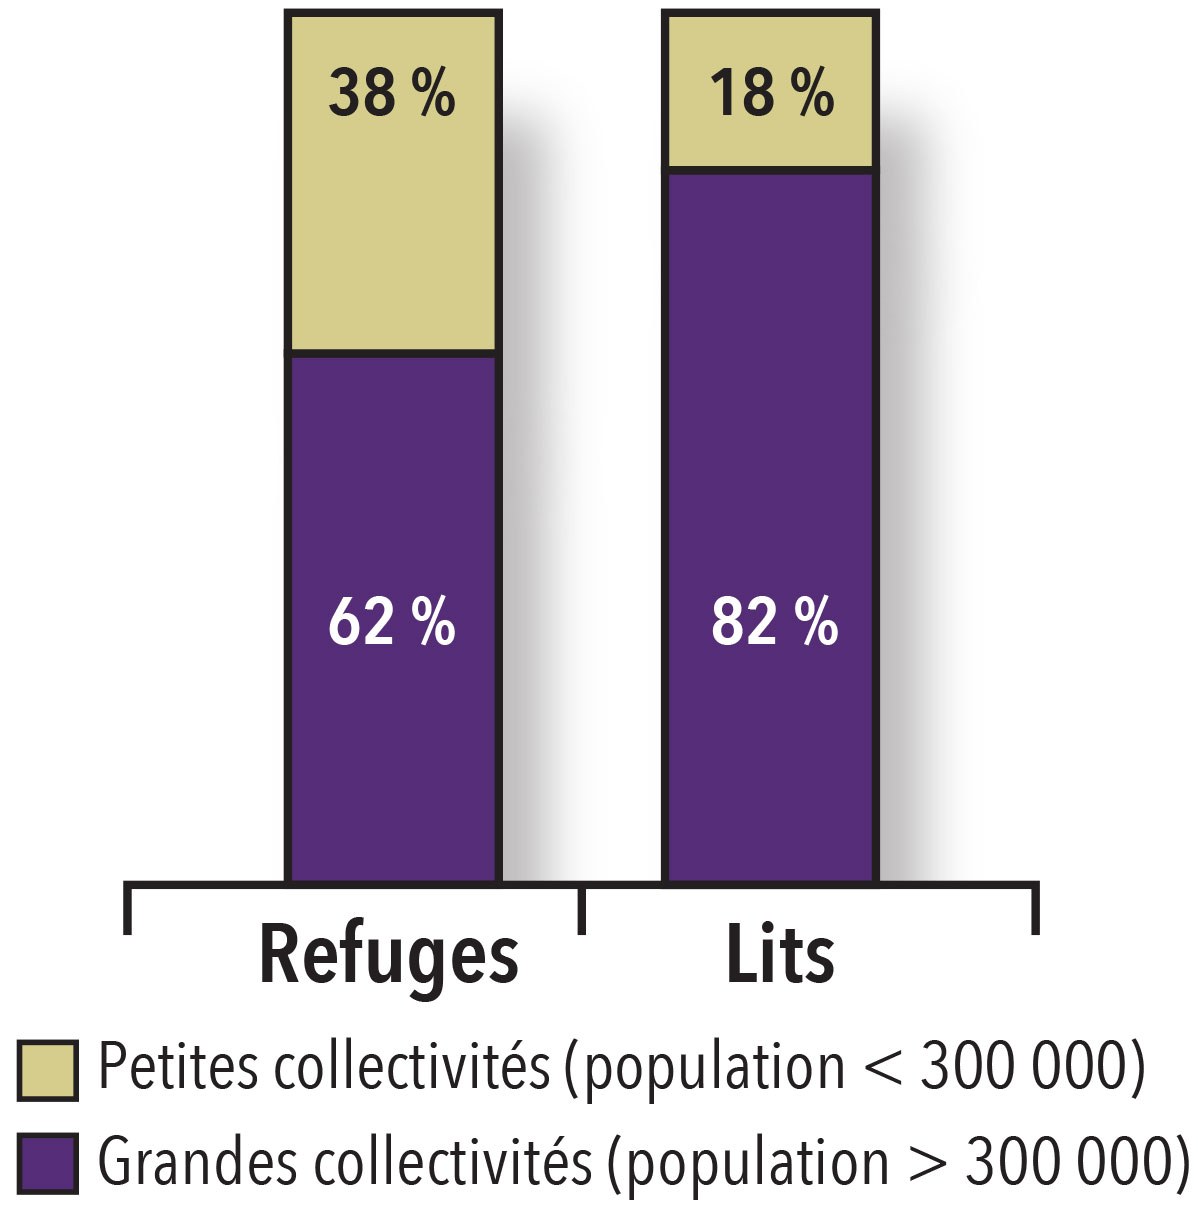
Figure 3 - Text version
- In Canada, 38% of emergency shelters are found in small communities with a population of less than 300,000
- In Canada, 62% of emergency shelters are found in large communities with a population of 300,000 or more
- In Canada, 18% of permanent shelter beds are found in small communities with a population of less than 300,000
- In Canada, 82% of permanent shelter beds are found in large communities with a population of 300,000 or more
National summary: Emergency shelters (2017)*
| Province/Territory | 2017 | 2016 | 2015 | |||
|---|---|---|---|---|---|---|
| Shelters | Beds | Shelters | Beds | Shelters | Beds | |
| Newfoundland and Labrador | 6 | 61 | 5 | 53 | 5 | 53 |
| Nova Scotia | 9 | 217 | 8 | 208 | 7 | 193 |
| New Brunswick | 9 | 148 | 9 | 150 | 9 | 150 |
| Prince Edward Island | 1 | 7 | 1 | 7 | 1 | 7 |
| Québec | 75 | 1,934 | 74 | 1,948 | 79 | 1,995 |
| Ontario | 149 | 6,764 | 147 | 6,622 | 145 | 6,715 |
| Manitoba | 15 | 661 | 15 | 661 | 15 | 661 |
| Saskatchewan | 21 | 443 | 21 | 439 | 21 | 459 |
| Alberta | 36 | 3,182 | 36 | 3,182 | 36 | 3,182 |
| British Columbia | 77 | 2,069 | 76 | 2,019 | 72 | 1,859 |
| Yukon | 3 | 27 | 3 | 27 | 3 | 20 |
| Northwest Territories | 3 | 76 | 4 | 100 | 4 | 100 |
| Nunavut | 2 | 34 | 2 | 34 | 2 | 34 |
| Canada | 407 | 15,623 | 401 | 15,450 | 399 | 15,428 |
*Changes in the reported number of shelters and beds during the years 2015 to 2017 may reflect updated information rather than actual changes in national shelter capacity.
Emergency shelters by clientele served (2017)
| Province/Territory | General | Men’s | Women’s | Youth | Family | Total | ||||||
|---|---|---|---|---|---|---|---|---|---|---|---|---|
| Shelters | Beds | Shelters | Beds | Shelters | Beds | Shelters | Beds | Shelters | Beds | Shelters | Beds | |
| Newfoundland and Labrador | 3 | 32 | 0 | 0 | 0 | 0 | 2 | 17 | 1 | 12 | 6 | 61 |
| Nova Scotia | 1 | 15 | 3 | 135 | 3 | 43 | 2 | 24 | 0 | 0 | 9 | 217 |
| New Brunswick | 3 | 68 | 2 | 45 | 2 | 20 | 2 | 15 | 0 | 0 | 9 | 148 |
| Prince Edward Island | 0 | 0 | 1 | 7 | 0 | 0 | 0 | 0 | 0 | 0 | 1 | 7 |
| Québec | 26 | 431 | 9 | 891 | 12 | 231 | 27 | 327 | 1 | 54 | 75 | 1,934 |
| Ontario | 26 | 850 | 40 | 2,638 | 27 | 1,079 | 37 | 773 | 20 | 1,424 | 150 | 6,764 |
| Manitoba | 10 | 534 | 0 | 0 | 0 | 0 | 2 | 24 | 3 | 103 | 15 | 661 |
| Saskatchewan | 3 | 50 | 5 | 146 | 10 | 236 | 3 | 11 | 0 | 0 | 21 | 443 |
| Alberta | 17 | 2,416 | 4 | 389 | 4 | 134 | 10 | 183 | 1 | 60 | 36 | 3,182 |
| British Columbia | 41 | 1,243 | 10 | 356 | 11 | 295 | 12 | 140 | 3 | 35 | 77 | 2,069 |
| Yukon | 1 | 14 | 0 | 0 | 1 | 2 | 1 | 11 | 0 | 0 | 3 | 27 |
| Northwest Territories | 0 | 0 | 1 | 35 | 1 | 31 | 1 | 10 | 0 | 0 | 3 | 76 |
| Nunavut | 0 | 0 | 1 | 22 | 1 | 12 | 0 | 0 | 0 | 0 | 2 | 34 |
| Canada | 132 | 5,653 | 76 | 4,664 | 72 | 2,083 | 99 | 1,535 | 29 | 1,688 | 407 | 15,623 |
Emergency shelters and shelter beds by community (2017)
Newfoundland and Labrador
| Community | General | Men’s | Women’s | Youth | Family | Total | ||||||
|---|---|---|---|---|---|---|---|---|---|---|---|---|
| Shelters | Beds | Shelters | Beds | Shelters | Beds | Shelters | Beds | Shelters | Beds | Shelters | Beds | |
| Happy Valley – Goose Bay | 1 | 8 | 0 | 0 | 0 | 0 | 0 | 0 | 0 | 0 | 1 | 8 |
| St. John’s | 2 | 24 | 0 | 0 | 0 | 0 | 2 | 17 | 1 | 12 | 5 | 53 |
| Total | 2 | 24 | 0 | 0 | 0 | 0 | 2 | 17 | 1 | 12 | 5 | 53 |
Nova Scotia
| Community | General | Men’s | Women’s | Youth | Family | Total | ||||||
|---|---|---|---|---|---|---|---|---|---|---|---|---|
| Shelters | Beds | Shelters | Beds | Shelters | Beds | Shelters | Beds | Shelters | Beds | Shelters | Beds | |
| Halifax | 0 | 0 | 2 | 120 | 2 | 36 | 1 | 20 | 0 | 0 | 5 | 176 |
| New Glasgow | 0 | 0 | 0 | 0 | 0 | 0 | 1 | 4 | 0 | 0 | 1 | 4 |
| Sydney | 0 | 0 | 1 | 15 | 1 | 7 | 0 | 0 | 0 | 0 | 2 | 22 |
| Truro | 1 | 15 | 0 | 0 | 0 | 0 | 0 | 0 | 0 | 0 | 1 | 15 |
| Total | 1 | 15 | 3 | 135 | 3 | 43 | 2 | 24 | 0 | 0 | 9 | 217 |
New Brunswick
| Community | General | Men’s | Women’s | Youth | Family | Total | ||||||
|---|---|---|---|---|---|---|---|---|---|---|---|---|
| Shelters | Beds | Shelters | Beds | Shelters | Beds | Shelters | Beds | Shelters | Beds | Shelters | Beds | |
| Bathurst | 1 | 6 | 0 | 0 | 0 | 0 | 0 | 0 | 0 | 0 | 1 | 6 |
| Fredericton | 0 | 0 | 1 | 25 | 1 | 10 | 0 | 0 | 0 | 0 | 2 | 35 |
| Miramichi | 0 | 0 | 0 | 0 | 0 | 0 | 1 | 5 | 0 | 0 | 1 | 5 |
| Moncton | 2 | 62 | 0 | 0 | 0 | 0 | 0 | 0 | 0 | 0 | 2 | 62 |
| Saint John | 0 | 0 | 1 | 20 | 1 | 10 | 1 | 10 | 0 | 0 | 3 | 40 |
| Total | 3 | 68 | 2 | 45 | 2 | 20 | 2 | 15 | 0 | 0 | 9 | 148 |
Prince Edward Island
| Community | General | Men’s | Women’s | Youth | Family | Total | ||||||
|---|---|---|---|---|---|---|---|---|---|---|---|---|
| Shelters | Beds | Shelters | Beds | Shelters | Beds | Shelters | Beds | Shelters | Beds | Shelters | Beds | |
| Charlottetown | 0 | 0 | 1 | 7 | 0 | 0 | 0 | 0 | 0 | 0 | 1 | 7 |
| Total | 0 | 0 | 1 | 7 | 0 | 0 | 0 | 0 | 0 | 0 | 1 | 7 |
Quebec
| Community | General | Men’s | Women’s | Youth | Family | Total | ||||||
|---|---|---|---|---|---|---|---|---|---|---|---|---|
| Shelters | Beds | Shelters | Beds | Shelters | Beds | Shelters | Beds | Shelters | Beds | Shelters | Beds | |
| Amos | 1 | 8 | 0 | 0 | 0 | 0 | 0 | 0 | 0 | 0 | 1 | 8 |
| Baie-Comeau | 0 | 0 | 1 | 17 | 0 | 0 | 0 | 0 | 0 | 0 | 1 | 17 |
| Drummondville | 1 | 9 | 0 | 0 | 0 | 0 | 1 | 9 | 0 | 0 | 2 | 18 |
| Fermont | 0 | 0 | 0 | 0 | 1 | 6 | 0 | 0 | 0 | 0 | 1 | 6 |
| Gatineau | 1 | 55 | 0 | 0 | 0 | 0 | 1 | 6 | 0 | 0 | 2 | 61 |
| Granby | 0 | 0 | 0 | 0 | 0 | 0 | 1 | 20 | 0 | 0 | 1 | 20 |
| Grand-Mère | 1 | 15 | 0 | 0 | 0 | 0 | 0 | 0 | 0 | 0 | 1 | 15 |
| Ham-Sud | 1 | 17 | 0 | 0 | 0 | 0 | 0 | 0 | 0 | 0 | 1 | 17 |
| Joliette | 1 | 6 | 0 | 0 | 0 | 0 | 2 | 21 | 0 | 0 | 3 | 27 |
| Mont-Laurier | 1 | 9 | 0 | 0 | 0 | 0 | 0 | 0 | 0 | 0 | 1 | 9 |
| Montréal | 5 | 96 | 6 | 832 | 9 | 205 | 17 | 229 | 1 | 54 | 38 | 1,416 |
| Québec City | 3 | 52 | 1 | 39 | 1 | 12 | 2 | 14 | 0 | 0 | 7 | 117 |
| Rouyn-Noranda | 1 | 15 | 0 | 0 | 0 | 0 | 0 | 0 | 0 | 0 | 1 | 15 |
| Saguenay | 2 | 45 | 1 | 3 | 0 | 0 | 0 | 0 | 0 | 0 | 3 | 48 |
| St-Eugène-de-Guigues | 1 | 14 | 0 | 0 | 0 | 0 | 0 | 0 | 0 | 0 | 1 | 14 |
| Sherbrooke | 1 | 22 | 0 | 0 | 1 | 8 | 1 | 8 | 0 | 0 | 3 | 38 |
| St-Georges | 2 | 25 | 0 | 0 | 0 | 0 | 0 | 0 | 0 | 0 | 2 | 25 |
| Thetford Mines | 1 | 9 | 0 | 0 | 0 | 0 | 0 | 0 | 0 | 0 | 1 | 9 |
| Trois-Rivières | 1 | 8 | 0 | 0 | 0 | 0 | 1 | 11 | 0 | 0 | 2 | 19 |
| Valleyfield | 2 | 26 | 0 | 0 | 0 | 0 | 0 | 0 | 0 | 0 | 2 | 26 |
| Victoriaville | 0 | 0 | 0 | 0 | 0 | 0 | 1 | 9 | 0 | 0 | 1 | 9 |
| Total | 26 | 431 | 9 | 891 | 12 | 231 | 27 | 327 | 1 | 54 | 75 | 1,934 |
Ontario
| Community | General | Men’s | Women’s | Youth | Family | Total | ||||||
|---|---|---|---|---|---|---|---|---|---|---|---|---|
| Shelters | Beds | Shelters | Beds | Shelters | Beds | Shelters | Beds | Shelters | Beds | Shelters | Beds | |
| Barrie-Simcoe | 1 | 20 | 1 | 20 | 0 | 0 | 1 | 15 | 0 | 0 | 3 | 55 |
| Brantford | 1 | 36 | 1 | 38 | 0 | 0 | 1 | 20 | 0 | 0 | 3 | 94 |
| Cochrane | 0 | 0 | 1 | 10 | 0 | 0 | 0 | 0 | 0 | 0 | 1 | 10 |
| Dufferin region | 0 | 0 | 0 | 0 | 0 | 0 | 1 | 20 | 0 | 0 | 1 | 20 |
| Durham region | 0 | 0 | 1 | 40 | 1 | 45 | 1 | 13 | 1 | 20 | 4 | 118 |
| Guelph | 0 | 0 | 1 | 18 | 1 | 14 | 1 | 16 | 2 | 35 | 5 | 83 |
| Halton region | 2 | 42 | 0 | 0 | 0 | 0 | 0 | 0 | 1 | 20 | 3 | 62 |
| Hamilton | 0 | 0 | 3 | 215 | 2 | 35 | 1 | 20 | 1 | 103 | 7 | 373 |
| Hunstville | 0 | 0 | 1 | 8 | 0 | 0 | 0 | 0 | 0 | 0 | 1 | 8 |
| Jarvis | 0 | 0 | 0 | 0 | 0 | 0 | 1 | 8 | 0 | 0 | 1 | 8 |
| Kenora | 1 | 25 | 0 | 0 | 0 | 0 | 0 | 0 | 0 | 0 | 1 | 25 |
| Kingston | 2 | 39 | 1 | 18 | 2 | 24 | 1 | 15 | 0 | 0 | 6 | 96 |
| Lindsay | 1 | 19 | 0 | 0 | 0 | 0 | 0 | 0 | 0 | 0 | 1 | 19 |
| London | 1 | 45 | 2 | 255 | 1 | 31 | 0 | 0 | 1 | 41 | 5 | 372 |
| Niagara region | 2 | 61 | 1 | 20 | 1 | 20 | 2 | 30 | 1 | 16 | 7 | 147 |
| Nippissing/North Bay | 1 | 19 | 0 | 0 | 1 | 10 | 0 | 0 | 0 | 0 | 2 | 29 |
| Ottawa | 1 | 12 | 3 | 431 | 2 | 109 | 2 | 24 | 3 | 554 | 11 | 1,130 |
| Peel region | 1 | 119 | 1 | 60 | 0 | 0 | 2 | 59 | 1 | 225 | 5 | 463 |
| Peterborough | 0 | 0 | 1 | 40 | 1 | 10 | 1 | 15 | 1 | 15 | 4 | 80 |
| Red Lake | 1 | 22 | 0 | 0 | 0 | 0 | 0 | 0 | 0 | 0 | 1 | 22 |
| Sarnia | 1 | 25 | 1 | 12 | 0 | 0 | 1 | 9 | 1 | 8 | 4 | 54 |
| Sault Ste. Marie | 0 | 0 | 1 | 24 | 1 | 7 | 1 | 10 | 1 | 7 | 4 | 48 |
| Sioux Lookout | 2 | 34 | 0 | 0 | 0 | 0 | 0 | 0 | 0 | 0 | 2 | 34 |
| Stratford | 0 | 0 | 0 | 0 | 0 | 0 | 1 | 14 | 0 | 0 | 1 | 14 |
| Sudbury | 0 | 0 | 1 | 36 | 0 | 0 | 1 | 16 | 1 | 20 | 3 | 72 |
| Thunder Bay | 1 | 42 | 2 | 34 | 0 | 0 | 0 | 0 | 0 | 0 | 3 | 76 |
| Timmins | 1 | 28 | 0 | 0 | 0 | 0 | 0 | 0 | 0 | 0 | 1 | 28 |
| Toronto | 3 | 197 | 14 | 1,235 | 12 | 735 | 10 | 374 | 3 | 240 | 42 | 2,781 |
| Waterloo region | 1 | 40 | 1 | 39 | 0 | 0 | 4 | 45 | 1 | 60 | 7 | 184 |
| Windsor | 2 | 25 | 1 | 56 | 1 | 11 | 1 | 10 | 0 | 0 | 5 | 102 |
| York region | 0 | 0 | 1 | 29 | 1 | 28 | 3 | 40 | 1 | 60 | 6 | 157 |
| Total | 26 | 850 | 40 | 2,638 | 27 | 1,079 | 37 | 773 | 20 | 1,424 | 150 | 6,764 |
Manitoba
| Community | General | Men’s | Women’s | Youth | Family | Total | ||||||
|---|---|---|---|---|---|---|---|---|---|---|---|---|
| Shelters | Beds | Shelters | Beds | Shelters | Beds | Shelters | Beds | Shelters | Beds | Shelters | Beds | |
| Brandon | 1 | 3 | 0 | 0 | 0 | 0 | 0 | 0 | 1 | 9 | 2 | 12 |
| Dauphin | 1 | 6 | 0 | 0 | 0 | 0 | 0 | 0 | 0 | 0 | 1 | 6 |
| Flin Flon | 1 | 26 | 0 | 0 | 0 | 0 | 0 | 0 | 0 | 0 | 1 | 26 |
| Swan River | 1 | 10 | 0 | 0 | 0 | 0 | 0 | 0 | 0 | 0 | 1 | 10 |
| The Pas | 0 | 0 | 0 | 0 | 0 | 0 | 0 | 0 | 1 | 34 | 1 | 34 |
| Thompson | 1 | 24 | 0 | 0 | 0 | 0 | 0 | 0 | 0 | 0 | 1 | 24 |
| Winnipeg | 5 | 465 | 0 | 0 | 0 | 0 | 2 | 24 | 1 | 60 | 8 | 549 |
| Total | 10 | 534 | 0 | 0 | 0 | 0 | 2 | 24 | 3 | 103 | 15 | 661 |
Saskatchewan
| Community | General | Men’s | Women’s | Youth | Family | Total | ||||||
|---|---|---|---|---|---|---|---|---|---|---|---|---|
| Shelters | Beds | Shelters | Beds | Shelters | Beds | Shelters | Beds | Shelters | Beds | Shelters | Beds | |
| Moose Jaw | 1 | 12 | 0 | 0 | 0 | 0 | 0 | 0 | 0 | 0 | 1 | 12 |
| North Battleford | 1 | 16 | 0 | 0 | 0 | 0 | 0 | 0 | 0 | 0 | 1 | 16 |
| Prince Albert | 1 | 22 | 0 | 0 | 2 | 58 | 0 | 0 | 0 | 0 | 3 | 80 |
| Regina | 0 | 0 | 2 | 64 | 3 | 88 | 0 | 0 | 0 | 0 | 5 | 152 |
| Saskatoon | 0 | 0 | 3 | 82 | 5 | 90 | 3 | 11 | 0 | 0 | 11 | 183 |
| Total | 3 | 50 | 5 | 146 | 10 | 236 | 3 | 11 | 0 | 0 | 21 | 443 |
Alberta
| Community | General | Men’s | Women’s | Youth | Family | Total | ||||||
|---|---|---|---|---|---|---|---|---|---|---|---|---|
| Shelters | Beds | Shelters | Beds | Shelters | Beds | Shelters | Beds | Shelters | Beds | Shelters | Beds | |
| Calgary | 5 | 1,746 | 1 | 80 | 2 | 18 | 3 | 45 | 1 | 60 | 12 | 1,949 |
| Edmonton | 4 | 307 | 1 | 249 | 2 | 116 | 2 | 88 | 0 | 0 | 9 | 760 |
| Grand Prairie | 1 | 92 | 0 | 0 | 0 | 0 | 1 | 14 | 0 | 0 | 2 | 106 |
| High Level | 1 | 20 | 0 | 0 | 0 | 0 | 0 | 0 | 0 | 0 | 1 | 20 |
| Lethbridge | 1 | 80 | 0 | 0 | 0 | 0 | 1 | 14 | 0 | 0 | 2 | 94 |
| Lloydminster | 0 | 0 | 1 | 28 | 0 | 0 | 0 | 0 | 0 | 0 | 1 | 28 |
| Medicine Hat | 1 | 30 | 0 | 0 | 0 | 0 | 1 | 6 | 0 | 0 | 2 | 36 |
| Red Deer | 2 | 61 | 0 | 0 | 0 | 0 | 1 | 8 | 0 | 0 | 3 | 69 |
| Wood Buffalo | 2 | 80 | 1 | 32 | 0 | 0 | 1 | 8 | 0 | 0 | 4 | 120 |
| Total | 17 | 2,416 | 4 | 389 | 4 | 134 | 10 | 183 | 1 | 60 | 36 | 3,182 |
British Columbia
| Community | General | Men’s | Women’s | Youth | Family | Total | ||||||
|---|---|---|---|---|---|---|---|---|---|---|---|---|
| Shelters | Beds | Shelters | Beds | Shelters | Beds | Shelters | Beds | Shelters | Beds | Shelters | Beds | |
| Abbotsford | 1 | 20 | 0 | 0 | 0 | 0 | 1 | 14 | 0 | 0 | 2 | 34 |
| Campbell River | 1 | 22 | 0 | 0 | 0 | 0 | 0 | 0 | 0 | 0 | 1 | 22 |
| Chetwynd | 1 | 3 | 0 | 0 | 0 | 0 | 0 | 0 | 0 | 0 | 1 | 3 |
| Chilliwack | 1 | 11 | 0 | 0 | 0 | 0 | 0 | 0 | 0 | 0 | 1 | 11 |
| Courtenay | 1 | 14 | 0 | 0 | 0 | 0 | 0 | 0 | 0 | 0 | 1 | 14 |
| Dawson Creek | 1 | 8 | 0 | 0 | 0 | 0 | 0 | 0 | 0 | 0 | 1 | 8 |
| Duncan | 1 | 30 | 0 | 0 | 0 | 0 | 0 | 0 | 0 | 0 | 1 | 30 |
| Fort Nelson | 1 | 6 | 0 | 0 | 0 | 0 | 0 | 0 | 0 | 0 | 1 | 6 |
| Fort St. John | 1 | 20 | 0 | 0 | 0 | 0 | 0 | 0 | 0 | 0 | 1 | 20 |
| Kamloops | 1 | 35 | 0 | 0 | 0 | 0 | 1 | 6 | 0 | 0 | 2 | 41 |
| Kelowna | 1 | 60 | 0 | 0 | 1 | 20 | 1 | 10 | 0 | 0 | 3 | 90 |
| Mission | 1 | 20 | 0 | 0 | 0 | 0 | 0 | 0 | 0 | 0 | 1 | 20 |
| Nanaimo | 0 | 0 | 1 | 23 | 1 | 10 | 0 | 0 | 0 | 0 | 2 | 33 |
| Nelson | 1 | 17 | 0 | 0 | 0 | 0 | 0 | 0 | 0 | 0 | 1 | 17 |
| Penticton | 1 | 11 | 0 | 0 | 0 | 0 | 0 | 0 | 0 | 0 | 1 | 11 |
| Port Alberni | 1 | 12 | 0 | 0 | 0 | 0 | 0 | 0 | 0 | 0 | 1 | 12 |
| Prince George | 1 | 30 | 1 | 21 | 1 | 30 | 1 | 10 | 0 | 0 | 4 | 91 |
| Prince Rupert | 1 | 10 | 0 | 0 | 0 | 0 | 0 | 0 | 0 | 0 | 1 | 10 |
| Quesnel | 1 | 10 | 0 | 0 | 0 | 0 | 0 | 0 | 0 | 0 | 1 | 10 |
| Smithers | 1 | 9 | 0 | 0 | 0 | 0 | 0 | 0 | 0 | 0 | 1 | 9 |
| Squamish | 1 | 15 | 0 | 0 | 0 | 0 | 0 | 0 | 0 | 0 | 1 | 15 |
| Terrace | 1 | 16 | 0 | 0 | 0 | 0 | 0 | 0 | 0 | 0 | 1 | 16 |
| Vancouver | 16 | 675 | 7 | 291 | 7 | 200 | 7 | 90 | 2 | 30 | 39 | 1,286 |
| Vernon | 1 | 25 | 0 | 0 | 0 | 0 | 0 | 0 | 0 | 0 | 1 | 25 |
| Victoria | 2 | 134 | 1 | 21 | 1 | 25 | 1 | 10 | 1 | 5 | 6 | 195 |
| Williams Lake | 1 | 30 | 0 | 0 | 0 | 0 | 0 | 0 | 0 | 0 | 1 | 30 |
| Total | 41 | 1,243 | 10 | 356 | 11 | 295 | 12 | 140 | 3 | 35 | 77 | 2,069 |
Yukon
| Community | General | Men’s | Women’s | Youth | Family | Total | ||||||
|---|---|---|---|---|---|---|---|---|---|---|---|---|
| Shelters | Beds | Shelters | Beds | Shelters | Beds | Shelters | Beds | Shelters | Beds | Shelters | Beds | |
| Dawson City | 0 | 0 | 0 | 0 | 1 | 2 | 0 | 0 | 0 | 0 | 1 | 2 |
| Whitehorse | 1 | 14 | 0 | 0 | 0 | 0 | 1 | 11 | 0 | 0 | 2 | 25 |
| Total | 1 | 14 | 0 | 0 | 1 | 2 | 1 | 11 | 0 | 0 | 3 | 27 |
Northwest Territories
| Community | General | Men’s | Women’s | Youth | Family | Total | ||||||
|---|---|---|---|---|---|---|---|---|---|---|---|---|
| Shelters | Beds | Shelters | Beds | Shelters | Beds | Shelters | Beds | Shelters | Beds | Shelters | Beds | |
| Yellowknife | 0 | 0 | 1 | 35 | 1 | 31 | 1 | 10 | 0 | 0 | 3 | 76 |
| Total | 0 | 0 | 1 | 35 | 1 | 31 | 1 | 10 | 0 | 0 | 3 | 76 |
Nunavut
| Community | General | Men’s | Women’s | Youth | Family | Total | ||||||
|---|---|---|---|---|---|---|---|---|---|---|---|---|
| Shelters | Beds | Shelters | Beds | Shelters | Beds | Shelters | Beds | Shelters | Beds | Shelters | Beds | |
| Iqaluit | 0 | 0 | 1 | 22 | 1 | 12 | 0 | 0 | 0 | 0 | 2 | 34 |
| Total | 0 | 0 | 1 | 22 | 1 | 12 | 0 | 0 | 0 | 0 | 2 | 34 |
Appendix A: Transitional housing by clientele served (2017)
| Province/Territory | General | Men’s | Women’s | Youth | Family | Total | ||||||
|---|---|---|---|---|---|---|---|---|---|---|---|---|
| Shelters | Beds | Shelters | Beds | Shelters | Beds | Shelters | Beds | Shelters | Beds | Shelters | Beds | |
| Newfoundland and Labrador | 2 | 74 | 1 | 2 | 2 | 12 | 2 | 25 | 0 | 0 | 7 | 113 |
| Nova Scotia | 0 | 0 | 1 | 19 | 2 | 32 | 2 | 15 | 0 | 0 | 5 | 66 |
| New Brunswick | 1 | 4 | 0 | 0 | 1 | 12 | 1 | 8 | 0 | 0 | 3 | 24 |
| Prince Edward Island | 0 | 0 | 0 | 0 | 0 | 0 | 0 | 0 | 0 | 0 | 0 | 0 |
| Québec | 26 | 607 | 22 | 525 | 12 | 210 | 30 | 362 | 5 | 79 | 95 | 1,783 |
| Ontario | 19 | 747 | 17 | 506 | 6 | 131 | 23 | 299 | 4 | 506 | 69 | 2,189 |
| Manitoba | 7 | 159 | 3 | 75 | 0 | 0 | 2 | 10 | 2 | 42 | 14 | 286 |
| Saskatchewan | 3 | 71 | 6 | 103 | 4 | 48 | 13 | 170 | 0 | 0 | 26 | 392 |
| Alberta | 12 | 525 | 3 | 315 | 6 | 182 | 8 | 80 | 2 | 101 | 31 | 1,203 |
| British Columbia | 20 | 627 | 5 | 82 | 4 | 50 | 5 | 95 | 0 | 0 | 34 | 854 |
| Yukon | 0 | 0 | 0 | 0 | 0 | 0 | 0 | 0 | 0 | 0 | 0 | 0 |
| Northwest Territories | 0 | 0 | 1 | 32 | 0 | 0 | 0 | 0 | 1 | 44 | 2 | 76 |
| Nunavut | 0 | 0 | 0 | 0 | 0 | 0 | 0 | 0 | 0 | 0 | 0 | 0 |
| Canada | 90 | 2,814 | 59 | 1,659 | 37 | 677 | 86 | 1,064 | 14 | 772 | 286 | 6,986 |
Appendix B: Violence against women shelters
| Province/Territory | Shelters | Beds |
|---|---|---|
| Newfoundland and Labrador | 14 | 146 |
| Nova Scotia | 16 | 224 |
| New Brunswick | 16 | 230 |
| Prince Edward Island | 3 | 45 |
| Québec | 94 | 1,118 |
| Ontario | 120 | 2,311 |
| Manitoba | 20 | 387 |
| Saskatchewan | 18 | 301 |
| Alberta | 43 | 930 |
| British Columbia | 95 | 1,004 |
| Yukon | 5 | 37 |
| Northwest Territories | 5 | 44 |
| Nunavut | 5 | 34 |
| Canada | 454 | 6,811 |
Report a problem on this page
- Date modified: