
Homelessness data snapshot: Homelessness migration in Canada
Homelessness data snapshot: Homelessness migration in Canada
Introduction
These analyses are about migration of people experiencing homelessness in emergency shelters between municipalities in Canada.
Data
Data are from 306 emergency shelters across 91 municipalities in Canada. This is a subset of all emergency shelters. From 2008 to 2017, 412,018 people stayed overnight in these emergency shelters. The data are anonymous, but a unique identifier helps to understand shelter use within and between cities.
The results in this report represent a minimum estimate of migration during this time. Data are not available for every shelter in Canada. People might also migrate without accessing shelters. For example, the data do not include experiences of hidden homelessness (for example, couch surfing). Although the results miss some instances of migration, the data cover the majority of shelter spaces in Canada. This means that the findings in this report should still reflect general migration patterns during this period.
Research findings
Extent of homeless migration
Between 2008 and 2017, 9.4% (38,807) of shelter users in the sample stayed overnight in shelters in at least 2 cities. A smaller percentage, 2.4% (9,951), stayed in shelters in more than 1 province. Of those who migrated:
- 75.5% (29,311) moved to another city
- 24.5% (9,496) returned to the city they first sought shelter service
Demographics
Compared to people aged 16 and over who only used shelters in one city, those that migrated were:
- more likely to be male (77% compared to 66%)
- more likely to be single (92% compared to 78%)
- more likely to be Canadian citizens (94% compared to 89%)
- younger (average age of 36.6 compared to 37.9)
Migration and city size
Figure 1: Migration flow by city size (38,807 shelter users)
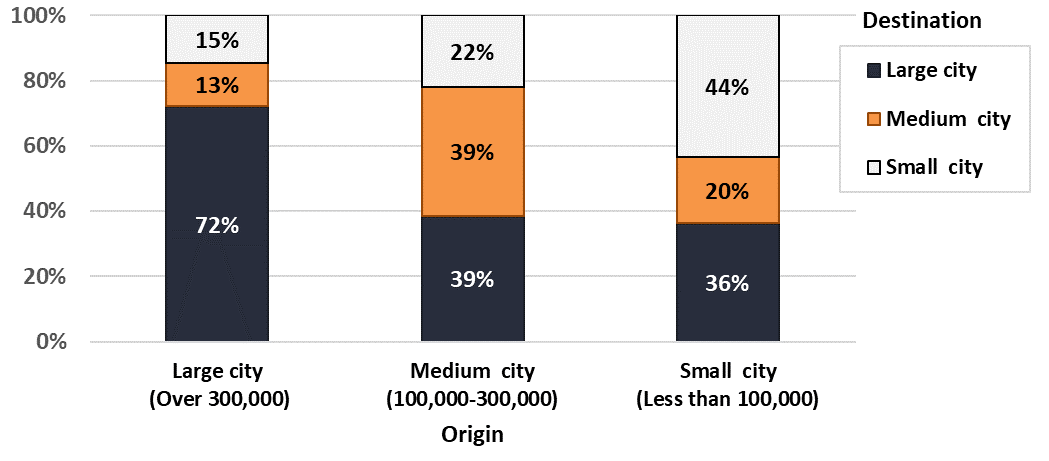
Figure 1 - Text version
| City size | Destination, large city (over 300,000 inhabitants) | Destination, medium city (100,000-300,000) | Destination, small city (less than 100,000 inhabitants) |
|---|---|---|---|
| Origin, large city (over 300,000 inhabitants) | 72% | 13% | 15% |
| Origin, medium city (100,000 to 300,000) | 39% | 39% | 22% |
| Origin, small city (less than 100,000 inhabitants) | 36% | 20% | 44% |
Most homeless migrants moved to cities with a similar or larger population. Fewer moved to cities with a smaller population. For example, over half of homeless migrants from small cities moved to larger cities. In contrast, less than 1 in 3 migrants from large cities moved to a medium or small city.
Figure 2: Proportional inflow, outflow and returned homeless migrants by city size (38,807 shelter users)
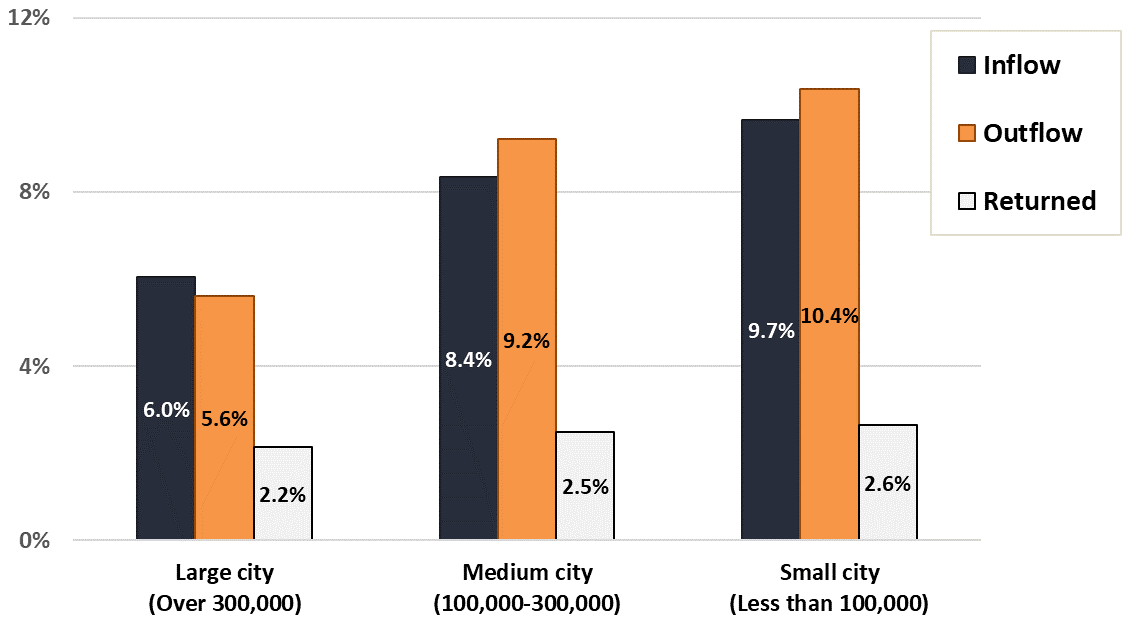
Figure 2 – Text version
| City size | Inflow | Outflow | Returned |
|---|---|---|---|
| Large city (over 300,000 inhabitants) | 6.0% | 5.6% | 2.2% |
| Medium city (100,000 to 300,000) | 8.4% | 9.2% | 2.5% |
| Small city (less than 100,000 inhabitants) | 9.7% | 10.4% | 2.6% |
Both inflow and outflow was lower in large cities relative to their homeless population. This means that larger cities had a lower proportion of people who migrated during this period.
Large cities were net recipients of homeless migration. The percentage of shelter users in large cities who had migrated to that city (inflow) was greater than the percentage of shelter users who left (outflow), 6.0% compared to 5.6%. Conversely, in small and medium-sized cities the outflow of shelter users was larger than inflow.
Seasonal migration patterns
Figure 3: Seasonal migration (152,035 shelter user moves)
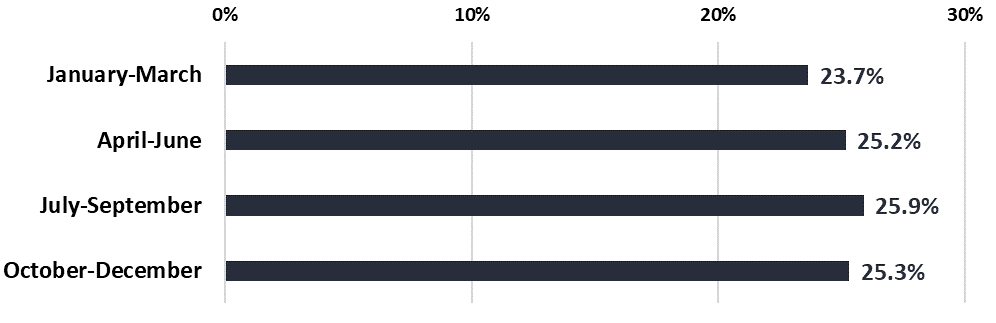
Figure 3 – Text version
| Month | Percentage |
|---|---|
| January to March | 23.7% |
| April to June | 25.2% |
| July to September | 25.9% |
| October to December | 25.3% |
There were small, but statistically significant, differences in migration levels between seasons. Migration was highest (25.9%) during the summer months (July to September) and lowest (23.8%) during the winter (January to March).
Key findings
- Most shelter users did not migrate between cities. Between 2008 and 2017, the majority of people who were experiencing homelessness only used shelters in 1 city. A minority used shelters in more than 1 city. Even fewer used shelters in more than 1 province
- Compared to people who only used shelters in 1 city, homeless migrants tended to be younger, male, single and Canadian citizens
- Larger cities had more inflow than outflow. In other words, more people came into large cities than left
- Most homeless migrants moved to cities with a similar or larger population
- Although migration was highest in the summer (July to September), seasonal differences were minor
Contact us
To find out more about homelessness research, visit the Data analysis, reports and publications page.
If you have any questions about this report, please contact us.
Report a problem on this page
- Date modified: