
Report on addiction, substance use and homelessness
Report on addiction, substance use and homelessness
On this page
- List of abbreviations
- List of figures
- Acknowledgements
- Author and principal investigators
- Report highlights
- Introduction
- Methods
- Results from the Point-in-Time counts for addiction or substance use
- Demographic characteristics
- Experience of homelessness
- Sources of income
- Comparisons between the 2016 and 2018 Point-in-Time counts
- Summary
- Glossary
- Annexe A: Participating Reaching Home designated communities
- Annexe B: 2018 Everyone counts survey
- Annexe C: Reaching Home program resources
- References
Alternate formats

Request other formats online or call 1 800 O-Canada (1-800-622-6232). If you use a teletypewriter (TTY), call 1-800-926-9105. Large print, braille, audio cassette, audio CD, e-text diskette, e-text CD and DAISY are available on demand.
List of abbreviations
- ESDC
- Employment and Social Development Canada
- PiT counts
- Point-in-Time counts
- ASU
- Addiction or substance use
- RCMP
- Royal Canadian Mounted Police
- RV
- Recreational vehicle
- CPP
- Canada Pension Plan
- OAS
- Old Age Security
- GIS
- Guaranteed Income Supplement
List of figures
- Figure 1: Addiction and substance use as a reason for recent housing loss
- Figure 2: Additional reasons for housing loss
- Figure 3: Geographic distribution of respondents reporting ASU
- Figure 4: Community size by respondents reporting ASU
- Figure 5: Gender distribution of respondents reporting ASU
- Figure 6: Distribution of age group for respondents reporting ASU
- Figure 7: Types of families
- Figure 8: Newcomer status of respondents reporting ASU
- Figure 9: Indigenous identity of respondents reporting ASU
- Figure 10: Veteran status
- Figure 11: Reported location on day of the count
- Figure 12: Comparison of locations for each gender
- Figure 13: Age of first homelessness experience by age group
- Figure 14: Time since first homelessness experience
- Figure 15: Chronic homelessness among respondents reporting ASU
- Figure 16: Episodic homelessness among respondents reporting ASU
- Figure 17: Reported sources of income
- Figure 18: Age distribution and ASU (2016 and 2018)
- Figure 19: Gender composition of respondents reporting ASU from 2016 and 2018
Acknowledgements
Employment and Social Development Canada gratefully acknowledges the contribution of the communities, the National Point-in-Time Count working group and experts in Canada that helped to implement the 2016 coordinated Point-in-Time count and Everyone Counts 2018. We would also like to acknowledge the local teams, that relied on dedicated people working with homelessness serving organizations, municipal staff, emergency services and volunteers who took the time to have converse with people experiencing homelessness, to listen to their stories and understand their needs.
Author and principal investigators
- Sajidul Quayum, Analyst
- Dr. Patrick Hunter, Analyst
- Dr. Jacqueline Rivier, Analyst
- Dr. Ian Cooper, Manager
- Nancy Baker, Director
Report highlights
In 2018, Everyone Counts, the second nationally coordinated Point-in-Time surveyed 19,536 people across 61 communities about their experience of homelessness. This report analyzes responses from those who identified addiction or substance use as a reason for their recent housing loss. Key findings from the report include:
- addiction or substance use was the most commonly cited reason for housing loss. More than a quarter (25.1%) of survey respondents indicated that addiction or substance use was a reason for their most recent housing loss
- the proportion of male respondents reporting addiction or substance use as a reason for housing loss (27.6%) was higher than female (21.0%) and gender diverse respondents (22.7%)
- the proportion of individuals who reported addiction or substance use increases with time spent homeless, from 19.0% at 0 to 2 months to 28.2% for those who reported over 6 months of homelessness in the past year
- the proportion of respondents who reported addiction or substance use was similar between those who identified as Indigenous (First Nations, Métis, Inuit or Indigenous Ancestry) (27.7%) and respondents who are non-Indigenous (27.2%). However, a higher proportion of Indigenous female respondents reported addiction or substance use a reason for housing loss (27.9%) compared to non-Indigenous female respondents (21.4%)
- in communities that conducted 2016 and 2018 Point-in-Time surveys, the prevalence of people who identified addiction or substance use as a reason for housing loss increased from 20.9% to 26.0%. Increases were observed for each age group, in particular for youth and adults
Introduction
Substance use is estimated to affect more than one-fifth of the Canadian population and has been found to be more prevalent among homeless individualsFootnote 1. Negative consequences associated with substance use, such as poor mental and physical health, can be amplified when combined with homelessness or risk of homelessnessFootnote 2.
Launched in April 2019, Reaching Home: Canada’s Homelessness Strategy is a community-based program aimed at preventing and reducing homelessness across Canada. The program supports initiatives such as the Nationally Coordinated Point-in-Time (PiT) count, which includes a survey of people experiencing homelessness inside and outside of shelters. Using data from the 2016 and 2018 Nationally Coordinated PiT CountsFootnote 3, this report contributes to the understanding of homelessness and substance use in Canada. In particular, it analyzes responses from those who indicated addiction or substance use as a reason for housing loss. Understanding the relationship between substance use and homelessness can help inform policy and program development, and targeted prevention and housing intervention strategies for those in need.
Methods
Data source and sample
This report analyzes survey data from the Nationally Coordinated PiT Counts of Homelessness in Canadian Communities. The first nationally coordinated PiT count was conducted in 32 communities in March and April 2016. The second count occurred in 2018 during the same 2 month period with 61 participatingFootnote 4 communities. PiT counts provide a 1-day snapshot of homelessness in a community, including people experiencing homelessness in shelters, unsheltered locations, and transitional housing. They can also include people experiencing homelessness who are in health or correctional facilities or who are staying with others because they have no access to a permanent residence. Unless indicated otherwise, the data presented in this report is from the 2018 PiT count. Additional data is provided from the 2016 PiT count for comparison purposes.
For the 2018 PiT count, participating communities adopted the guidelines and methodology for the PiT count based on a guideFootnote 5 developed by ESDCFootnote 6 with feedback from communities that participated in the 2016 Coordinated PiT Count, as well as the National PiT Count Working Group. The nationally coordinated PiT counts include a survey with 14 standardized questions. One of the questions is a multi-response question about the reasons for the respondent’s most recent housing loss: “What happened that caused you to lose your housing most recently?” Respondents were asked to identify all of the factors from a list of 12 response options that contributed to their housing loss. One of these factors is “addiction or substance use” (referred to in this report as ASU). In the 2018 PiT Count, 13,432 people responded to this question, of which 3,377 identified ASU as one of the reasons for their most recent housing loss. The remaining 10,055 who did not attribute ASU to their most recent housing loss are used for comparison throughout the report.
Limitations
It is important to note that the question used to establish the sample size for this report does not directly ask about substance use. As such, information on substance type or severity of substance use are not included in the analysis. The group under examination in this report are the 3,377 respondents who self-reported addiction or substance use as a reason for housing loss at the time of the survey. This does not imply that ASU did not contribute to housing loss at an earlier point(s) in time for the remaining 10,005 survey respondents. This latter group may also include substance users who felt that they lost their housing as a result of factors unrelated to addiction or substance use, such as eviction or conflict with a landlord. Moreover, the respondent may not have cited ASU as a reason for their housing loss due to the stigma associated with it, which can lead to substance use being underreportedFootnote 7.
Results from the Point-in-Time counts for addiction or substance use
Loss of housing attributed to addiction or substance use
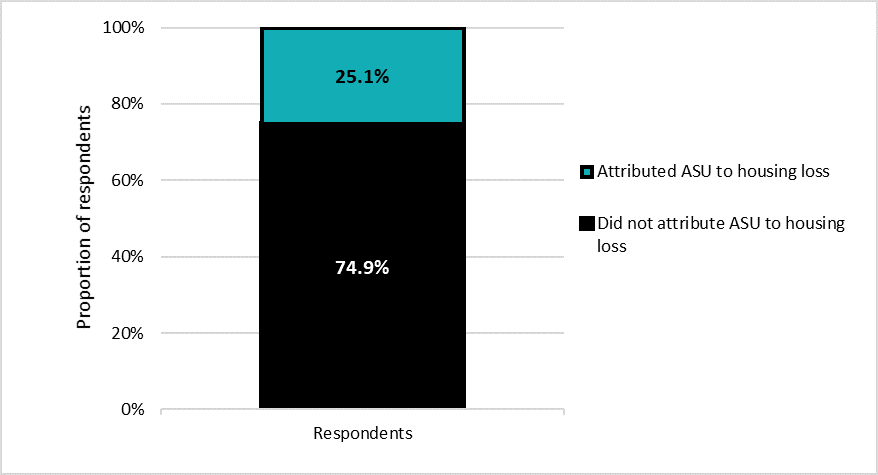
Out of the 13,432 respondents to the question ‘What happened that caused you to lose your housing most recently’, 3,377 (25.1%) indicated ASU as a reason for housing lossFootnote 8, while 10,055 (74.9%) did not (Figure 1). ‘Addiction or substance use’ was the most frequently reported factor, followed by ‘unable to pay rent or mortgage’ (19.1%) and ‘conflict with spouse/partner (14.5%).
Source: Everyone Counts 2018
Figure 1 – Text version
| ASU and housing loss | Proportion of respondents |
|---|---|
| Attributed ASU to housing loss | 25.1% |
| Did not attribute ASU to housing loss | 74.9% |
Additional reasons for housing loss
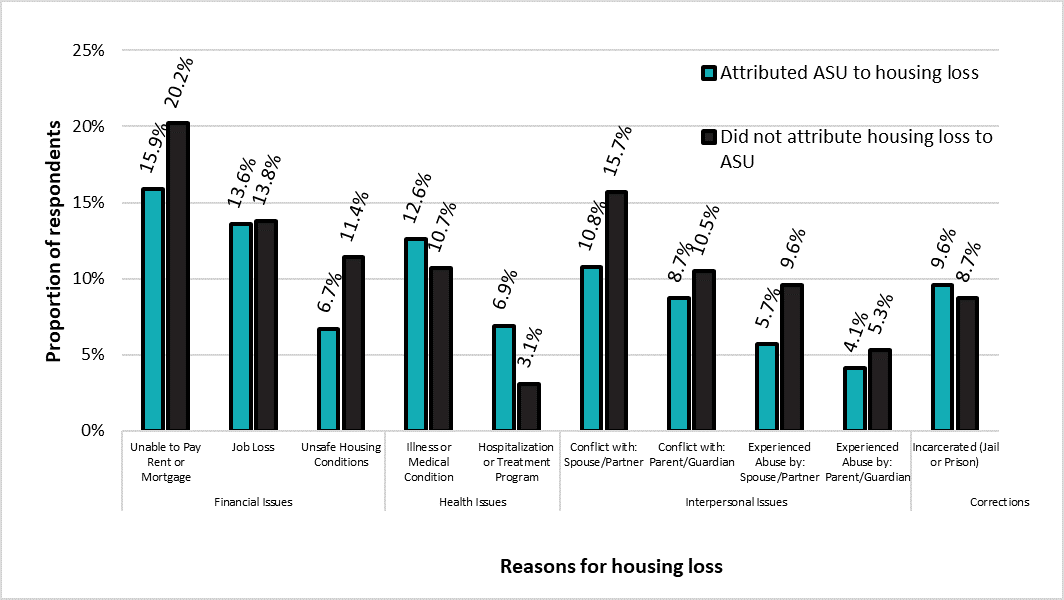
For those who reported ASU, the next most frequently reported reason for housing loss was ‘unable to pay rent or mortgage’. Compared to non-ASU respondents, those who reported ASU were more likely to report health issues as factors that contributed to housing loss. ASU respondents were more likely to report ‘illness or medical condition’ (12.6%) than non-ASU respondents (10.7%), and were more than twice as likely to indicate ‘hospitalization or treatment program’ (6.9%) compared to non-ASU respondents (3.1%). Further, ASU respondents were also more likely to report ‘incarceration’ (9.6%) compared to non-ASU respondents (8.7%) as a contributing factor for their housing loss.
For non-ASU respondents, ‘unable to pay rent or mortgage’ and ‘conflict with spouse/partner’ were the most frequently reported reasons for housing loss. Respondents who did not report ASU were generally more likely to report financial issues such as ‘unable to pay rent or mortgage’ (20.2%) compared to respondents who attributed ASU to their recent housing loss (15.9%), and were more likely to report ‘unsafe housing conditions’ (11.4%) compared to ASU respondents (6.7%). Non-ASU respondents were also more likely to report interpersonal issues such as ‘conflict with: spouse/partner’ (15.7%) compared to those that did report ASU (10.8%).
Source: Everyone Counts 2018
Figure 2 – Text version
| Reason for housing loss | Did not attribute housing loss to ASU | Attribute housing loss to ASU |
|---|---|---|
| Unable to pay rent or mortgage | 20.2% | 15.9% |
| Job loss | 13.8% | 13.6% |
| Unsafe housing conditions | 11.4% | 6.7% |
| Reason for housing loss | Did not attribute housing loss to ASU | Attribute housing loss to ASU |
|---|---|---|
| Illness or medical condition | 10.7% | 12.6% |
| Hospitalization or treatment program | 3.1% | 6.9% |
| Reason for housing loss | Did not attribute housing loss to ASU | Attribute housing loss to ASU |
|---|---|---|
| Conflict with spouse or partner | 15.7% | 10.8% |
| Conflict with parent or guardian | 10.5% | 8.7% |
| Experienced abuse by spouse or partner | 9.6% | 5.7% |
| Experienced abuse by parent or guardian | 5.3% | 4.1% |
| Reason for housing loss | Did not attribute housing loss to ASU | Attribute housing loss to ASU |
|---|---|---|
| Incarcerated (for example jail or prison) | 8.7% | 9.6% |
Regional variation
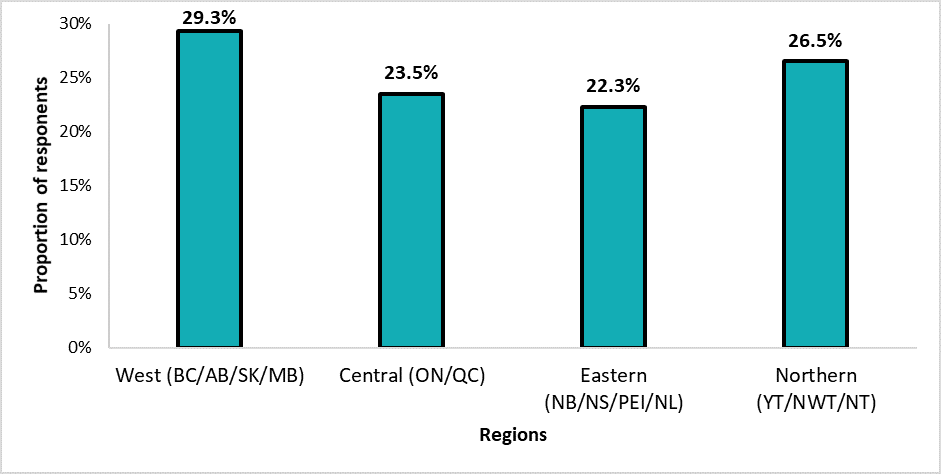
There was some geographic variation in reporting of ASU as a reason for housing loss. Respondents in Western provinces (29.3%) and Northern territories (26.5%) were more likely to report ASU compared to Central (23.5%) and Atlantic provinces (22.3%) (Figure 3).
Source: Everyone Counts 2018
Figure 3 – Text version
| Region | Proportion of respondents attributing recent housing loss to ASU |
|---|---|
| West (BC, AB, SK, MB) | 29.3% |
| Central (ON, QC) | 23.5% |
| Eastern (NB, NS, PEI, NL) | 22.3% |
| Northern (YT, NWT, NT) | 26.5% |
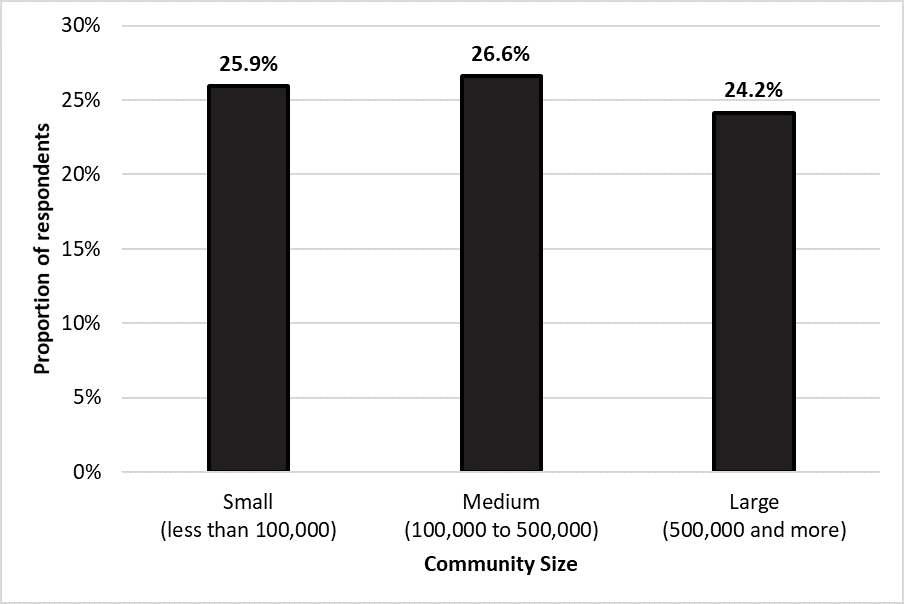
There were little observed differences in the prevalence of ASU across small, medium and large communities (Figure 4). Respondents in mid-sized communities, with populations between 100,000 and 500,000, were most likely to identify ASU as a factor for housing loss (26.6%). Conversely, respondents in large communities with populations over 500,000 were least likely to identify ASU as a reason for housing loss (24.2%).
Source: Everyone Counts 2018
Figure 4 – Text version
| Community size | Proportion of respondents attributing recent housing loss to ASU |
|---|---|
| Small (less than 100,000) | 25.9% |
| Medium (100,000 to 500,000) | 26.6% |
| Large (500,000 and more) | 24.2% |
Demographic characteristics
Gender, age and family status
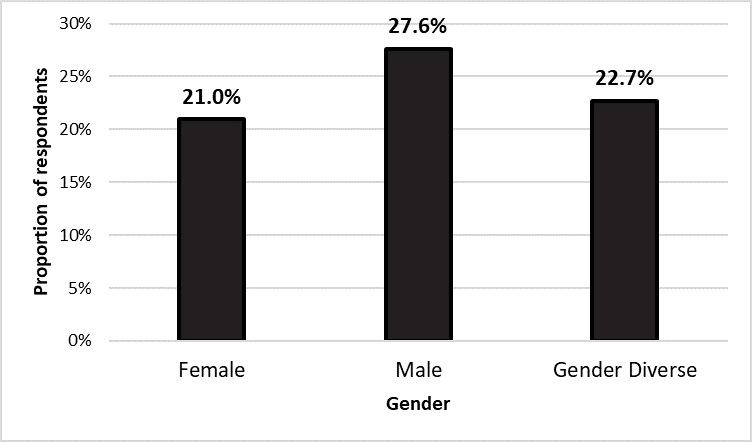
Males were most likely to report ASU as a reason for housing loss (27.6%), compared to female (21.0%) and gender diverse (22.7%) respondents (Figure 5).
Source: Everyone Counts 2018
Figure 5 – Text version
| Gender | Proportion of respondents attributing recent housing loss to ASU |
|---|---|
| Female | 21.0% |
| Male | 27.6% |
| Gender diverse | 22.7% |
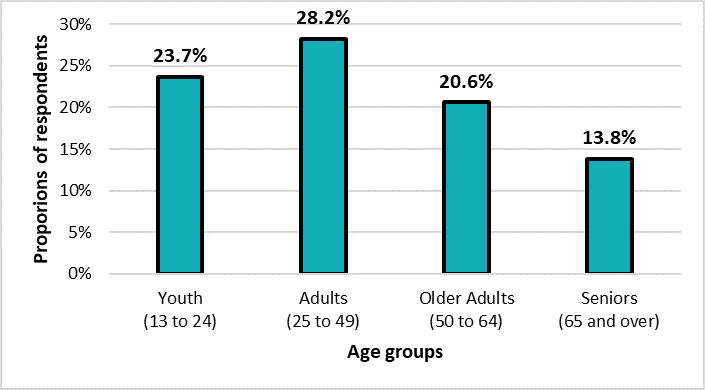
Comparing the proportion of respondents reporting ASU across age groups, the highest rates were reported by adults (28.2%), followed by youth (23.7%), older adults (20.6%) and seniors (13.8%) (Figure 6).
Source: Everyone Counts 2018
Figure 6 – Text version
| Age Group | Proportion of respondents attribution recent housing loss to ASU |
|---|---|
| Youth (13 to 24) | 23.7% |
| Adults (25 to 49) | 28.2% |
| Older adults (50 to 64) | 20.6% |
| Seniors (65 and over) | 13.8% |
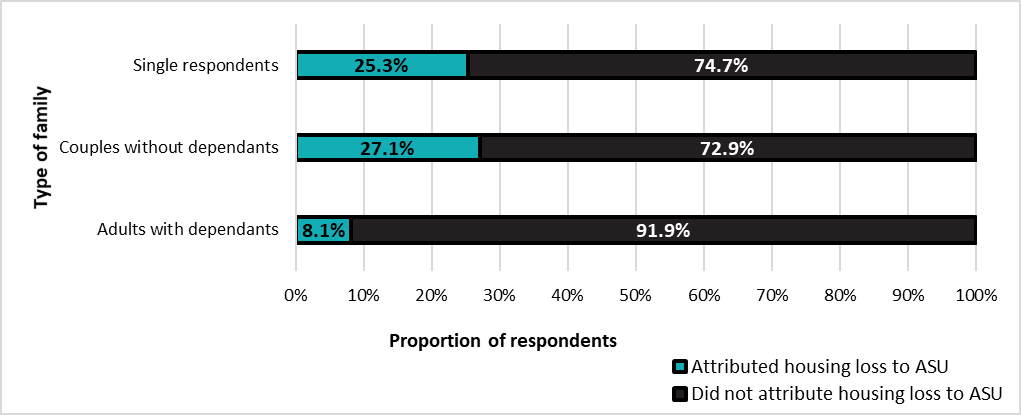
The reporting of ASU as a reason for housing loss was significantly lower among adults with dependents (8.1%) compared to single respondents (25.3%) and couples without dependents (27.1%) (Figure 7). Among families, the likelihood of reporting ASU as a reason for housing loss declined as family size increased. For instance, single parent families with 1 dependent (family size of 2), were more likely to report ASU as a reason for housing loss (9.4%) compared to those with 3 or more dependents (4.3%).
Source: Everyone Counts 2018
Figure 7 – Text version
| Family type | Adults with dependants | Couples without dependants | Single respondants |
|---|---|---|---|
| Attributed housing loss to ASU | 8.1% | 27.1% | 25.3% |
| Did not attribute housing loss to ASU | 91.9% | 72.9% | 74.7% |
Newcomers to Canada
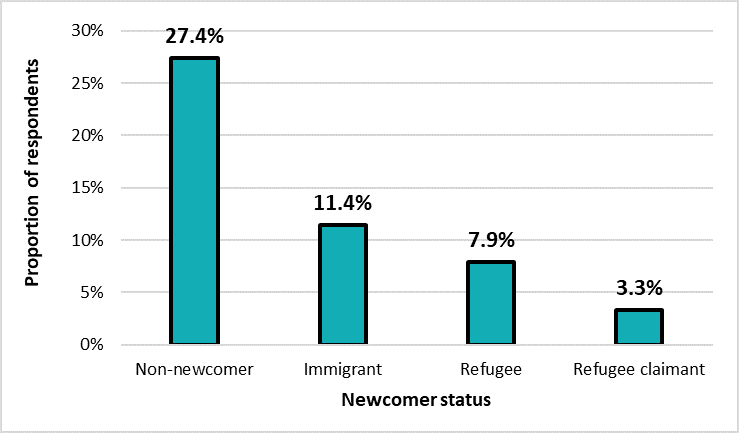
Respondents who came to Canada as an immigrant (11.4%), refugee (7.9%), or refugee claimant (3.3%) were less likely to report ASU as a contributing factor for housing loss than those who identified as non-newcomersFootnote 9 (27.4%) (Figure 8). Among all respondents who identified as a newcomer, the longer they had been in Canada, the more likely there were to report substance use as a contributing factor for housing loss. Those who had been in Canada for 5 or more years (12.7%) reported substance use as a reason for housing loss more frequently than those in Canada for 1 to 5 years (2.9%), and those who had been in Canada for less than 12 months (0.6%).
Source: Everyone Counts 2018
Figure 8 – Text version
| Status | Non-newcomer | Immigrant | Refugee | Refugee claimant |
|---|---|---|---|---|
| Proportion of respondents attributing recent housing loss to ASU | 27.4% | 11.4% | 7.9% | 3.3% |
Indigenous identity
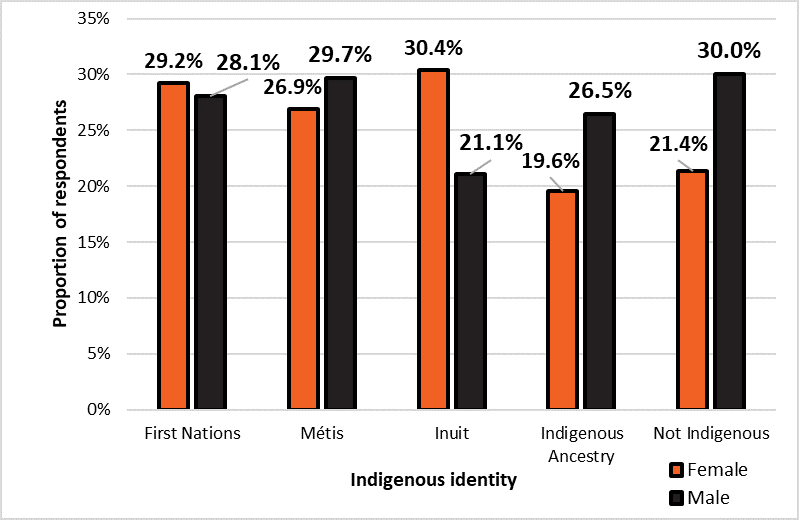
The proportion of IndigenousFootnote 10 respondents who reported ASU use as a reason for housing loss (27.7%) was similar to non-Indigenous respondents (27.2%). Among those who self reported as Indigenous, a slightly higher proportion of First Nations (28.5%) and Métis (28.4%) respondents reported ASU use as a reason for housing loss than Inuit (24.4%) and those with Indigenous ancestry (24.1%).
A higher proportion of women who identified as Indigenous (27.9%) reported ASU as a reason for housing loss compared to non-Indigenous women (21.4%). Conversely, the proportion of male respondents who reported ASU as a reason for housing loss was lower for Indigenous males (27.8%) than non-Indigenous males (30.0%). While men were more likely than women to report substance use among non-Indigenous respondents, both female and male respondents who identified as Indigenous were comparably likely to report ASU as a reason for housing loss.
Source: Everyone Counts 2018
Figure 9 – Text version
| Indigenous Identity | First Nations | Métis | Inuit | Indigenous ancestry | Not Indigenous |
|---|---|---|---|---|---|
| Female | 29.1% | 27.7% | 30.4% | 19.6% | 21.4% |
| Male | 28.3% | 28.8% | 21.1% | 26.5% | 30.0% |
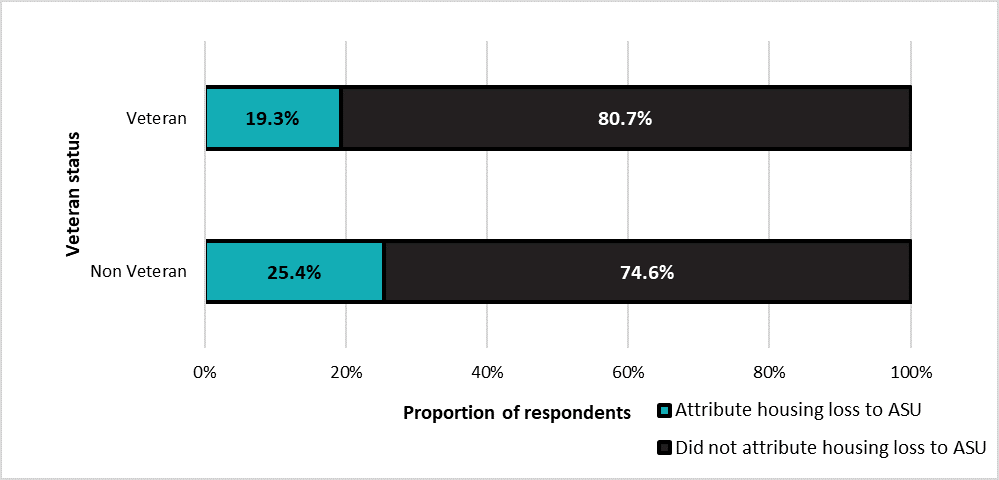
Veteran status
Respondents who identified as either a military veteran or a RCMP veteran represented 3.5% of all those who reported ASU as a reason for housing loss. Veterans (19.0%) were less likely than non-veterans (25.4%) to attribute their housing loss to ASU (Figure 10). This is consistent when looking across age groups, except for seniors, whose rates for veterans (15.4%) were comparable to non-veterans (13.7%). However, the number of veterans reporting substance use, particularly among seniors or women, is too low to reach meaningful conclusions.
Source: Everyone Counts 2018
Figure 10 – Text version
| Status | Non Veteran | Veteran |
|---|---|---|
| Did not attribute housing loss to ASU | 74.6% | 80.7% |
| Attribute housing loss to ASU | 25.4% | 19.3% |
Experience of homelessness
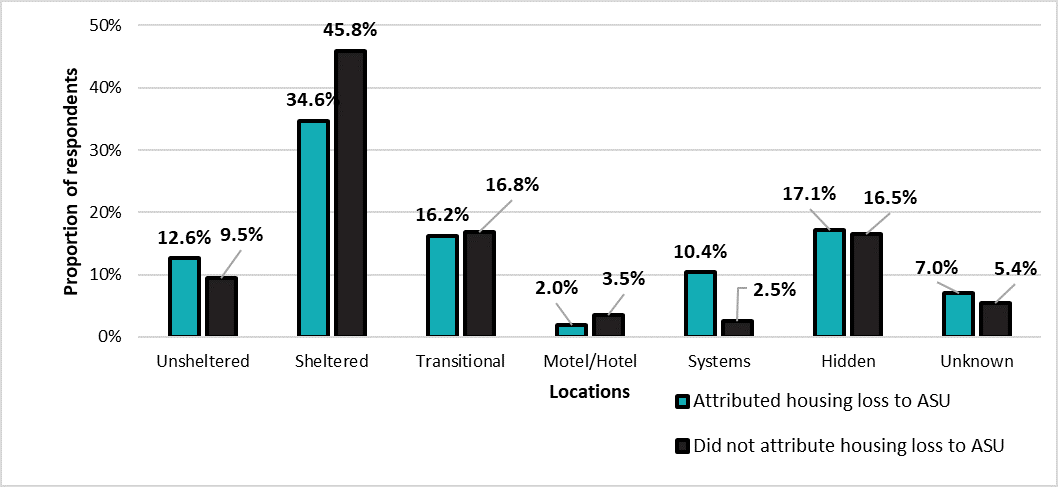
Location
ASU and non-ASU respondents were both most likely to report being in sheltered locations on the day of the count (Figure 11). However, respondents who did not report ASU as a reason for their recent housing loss were more likely to report being sheltered (45.8%) compared to those that did report ASU (34.6%). Respondents who attributed ASU as a reason for housing loss were more likely to report staying in systems (10.4%) or unsheltered locations (12.6%) compared to their non-ASU counterparts (2.5% and 9.5%, respectively). Systems refer to facilities that are regulated by either federal, provincial or municipal bodies such as hospitals, treatment centres, prisons, jails and detention centres.
Source: Everyone Counts 2018
Figure 11 – Text version
| Locations | Unsheltered | Sheltered | Transitional | Motel or hotel | Systems | Hidden | Unknown |
|---|---|---|---|---|---|---|---|
| Attributed housing loss to ASU | 9.5% | 45.8% | 16.8% | 3.5% | 2.5% | 16.5% | 5.4% |
| Did not attribute housing loss to ASU | 12.6% | 34.6% | 16.2% | 2.0% | 10.4% | 17.1% | 7.0% |
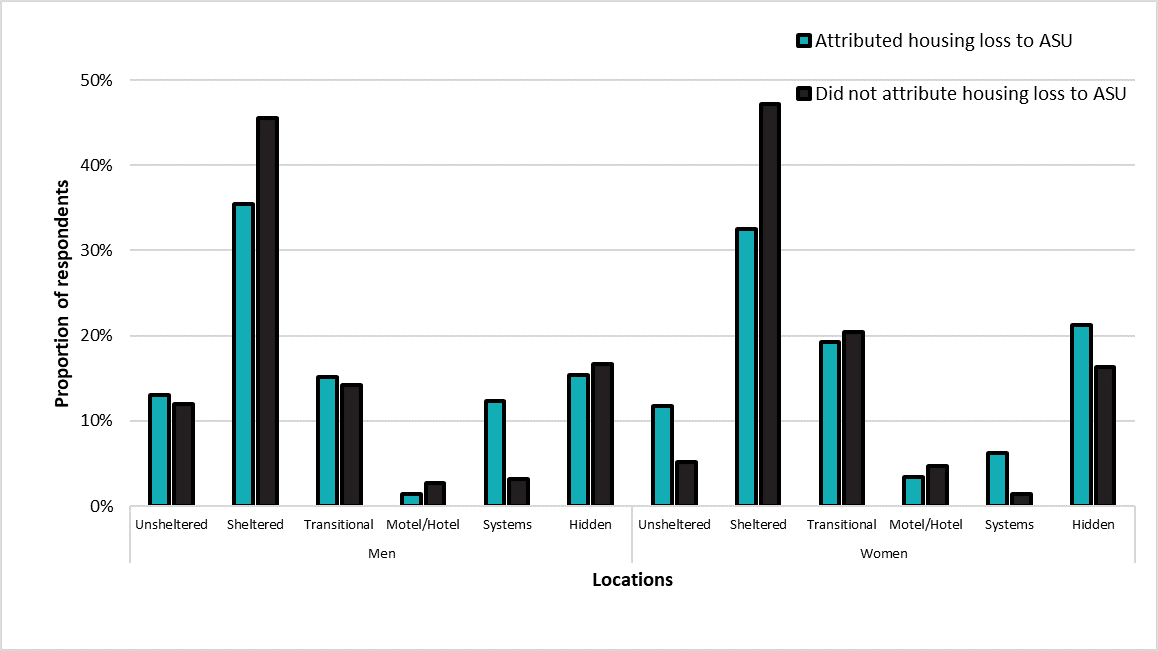
Location of those who reported ASU varied by gender (Figure 12). Male ASU respondents (12.3%) were nearly twice as likely to be in systems compared to female respondents (6.2%). In contrast, male ASU respondents (15.1%) were less likely to report being in transitional locations (15.1%) or experiencing hidden homelessnessFootnote 11 (15.4%) compared to female ASU respondents (19.2% and 21.2%, respectively).
Female ASU respondents (12.5%) were more than twice as likely to stay in unsheltered locations compared to non-ASU female respondents (5.4%). Moreover, women who reported ASU (21.2%) were more likely to be experiencing hidden homelessness compared to those who did not (16.3%). Both men and women who indicated ASU as a reason for housing loss were more likely to be staying in systems and less likely to be staying in sheltered locations compared to their non-ASU counterparts.
Source: Everyone Counts 2018
Figure 12 – Text version
| Status | Unsheltered | Sheltered | Transitional | Motel or hotel | Systems | Hidden | Unknown |
|---|---|---|---|---|---|---|---|
| Did not attribute housing loss to ASU | 12.00% | 45.50% | 14.20% | 2.70% | 3.20% | 16.70% | 5.70% |
| Attributed housing loss to ASU | 13.00% | 35.40% | 15.10% | 1.40% | 12.30% | 15.40% | 7.50% |
| Status | Unsheltered | Sheltered | Transitional | Motel or hotel | Systems | Hidden | Unknown |
|---|---|---|---|---|---|---|---|
| Did not attribute housing loss to ASU | 5.10% | 47.20% | 20.40% | 4.80% | 1.40% | 16.30% | 4.80% |
| Attributed housing loss to ASU | 11.80% | 32.50% | 19.20% | 3.40% | 6.20% | 21.20% | 5.70% |
First homelessness experience
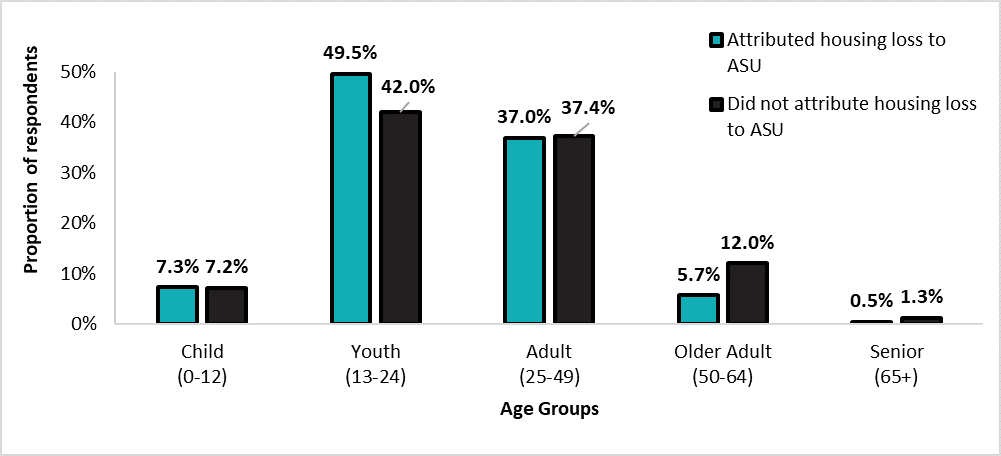
Almost half of those who reported ASU as a reason for their most recent housing loss had their first experienced homelessness in their youth (49.5%) compared to 42.0% of those who did not report ASU (Figure 13). The proportion of respondents to first experience homelessness as a child (aged between 0 and 12 years old) was similar for those who did and did not report substance use (7.3% and 7.2%, respectively). Respondents who first experienced homelessness later in life were less likely to report ASU as a contributing factor to their housing loss (13.8% of older adults and 11.3% of seniors). Of those respondents who reported ASU as a reason for housing loss, most identified that they first experienced homelessness as a youth (28.3%), followed by child (25.2%) and adult (24.9%). Comparatively fewer identified older adult (13.8%) and senior (11.3%) as first age of homelessness.
Source: Everyone Counts 2018
Figure 13 – Text version
| Age groups | Child (0 to 12) |
Youth (13 to 24) |
Adult (25 to 49) |
Older adult (50 to 64) |
Senior (65 and over) |
|---|---|---|---|---|---|
| Did not attribute housing loss to ASU | 7.2% | 42.0% | 37.4% | 12.0% | 1.3% |
| Attributed housing loss to ASU | 7.3% | 49.5% | 37.0% | 5.7% | 0.5% |
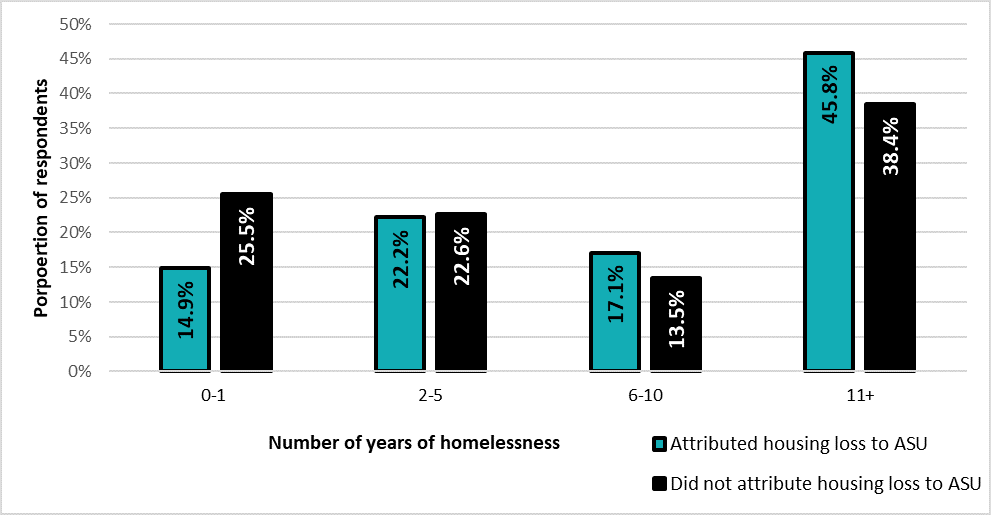
Respondents who indicated ASU as a reason for housing loss were more likely to report a longer duration since their first experience of homelessness (Figure 14). The median time since first homelessness experience was higher for those who reported ASU (9 years) compared to those that did not (6 years). Almost half (45.8%) first experienced homeless 11 or more years prior to their current episode of homelessness, and 17.1% first experienced homelessness 6 to 10 years ago. This compares to 38.4% and 13.5% of those did not report ASU, respectively. Those who did not report ASU were more likely to have first experienced homelessness less than a year ago (25.5%) compared to 14.9% for respondents who reported ASU as a reason for their housing loss.
Source: Everyone Counts 2018
Figure 14 – Text version
| Number of years | 0 to 1 year | 2 to 5 years | 6 to 10 years | 11 and more years |
|---|---|---|---|---|
| Did not attribute housing loss to ASU | 25.5% | 22.6% | 13.5% | 38.4% |
| Attributed housing loss to ASU | 14.9% | 22.2% | 17.1% | 45.8% |
Chronic and episodic homelessness
In the 2018 PiT count, respondents who reported 6 or more months of homelessness over the past year were considered to be experiencing “chronic homelessness”, and respondents who reported having at least 3 separate episodes of homelessness in the past year were considered to be experiencing “episodic homelessness”. Survey respondents who indicated ASU as a reason for housing loss were more likely to be experiencing chronic homelessness (67.7% compared to 58.3% for those not reporting ASU) and episodic homelessness (23.6% compared to 18.6% for those not reporting ASU).
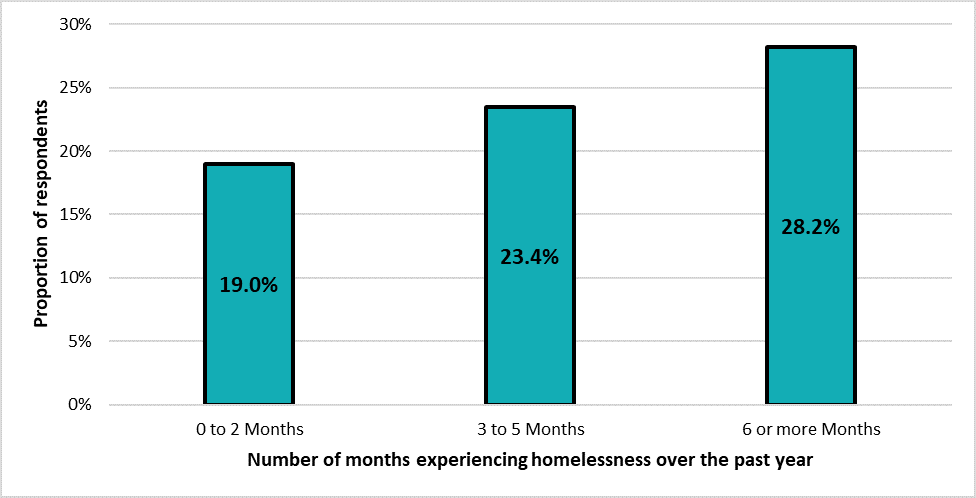
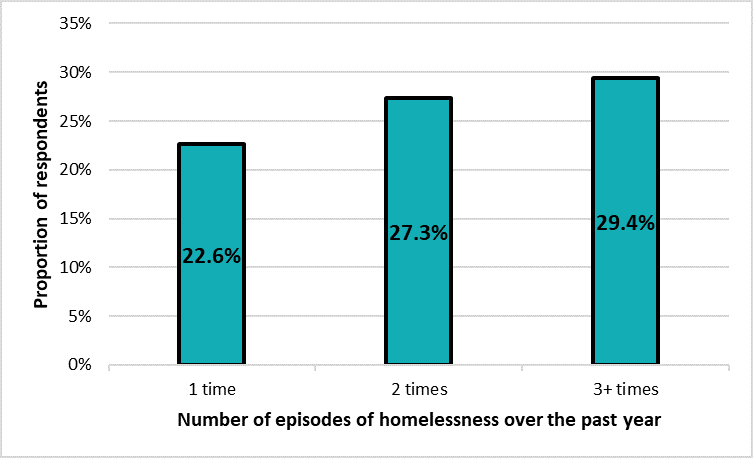
The proportion of individuals reporting ASU as a reason for housing loss increased with time spent homeless over the last year, from 19.0% at 0-2 months to 28.2% for those who reported over 6 months of homelessness in the past year (Figure 15). Similarly, the proportion of respondents reporting ASU as a reason for housing loss increased as the number of homeless episodes increased, from 22.6% for one episode, to 29.4% for 3 or more episodes (Figure 16).
Source: Everyone Counts 2018
Figure 15 – Text version
| Number of months experiencing homelessness over the past year | 0 to 2 months | 3 to 5 months | 6 or more months |
|---|---|---|---|
| Proportion of repondents attributing recent housing loss to ASU | 19.0% | 23.4% | 28.2% |
Source: Everyone Counts 2018
Figure 16 – Text version
| Number of episodes | 1 time | 2 times | 3 times or more |
|---|---|---|---|
| Proportion of repondents attributing recent housing loss to ASU | 22.6% | 27.3% | 29.4% |
Sources of income
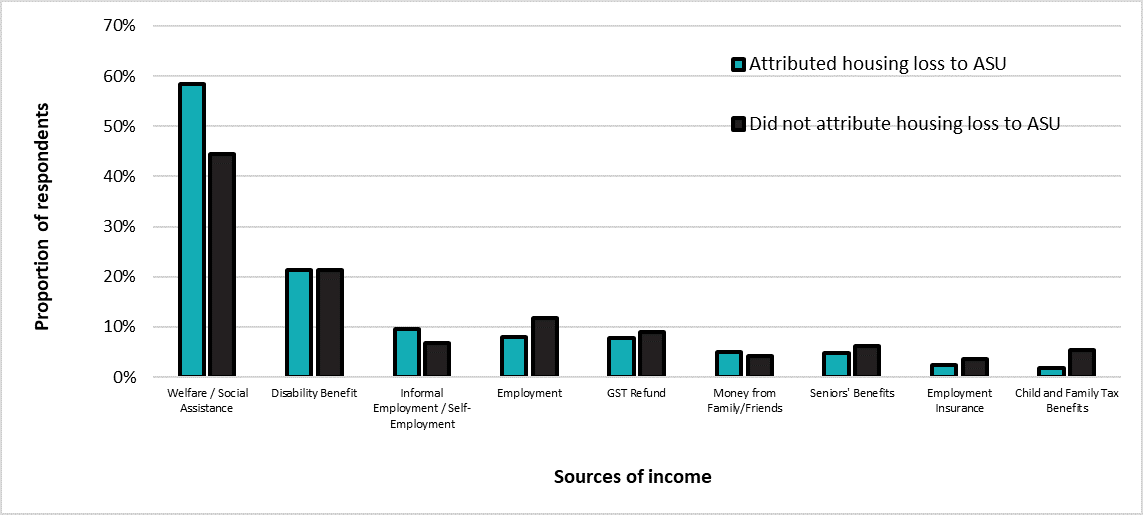
For this section, respondents indicated all the sources of income they were receiving from the response options in question 15 of the PiT count survey (Annex B). Based on the data collected, welfare or social assistance was the most reported source of income for all survey respondents (Figure 17). However, those reporting ASU as a reason for housing loss (58.3%) were more likely than their non-ASU counterparts (44.4%) to identify welfare or social assistance as a source of income. The second most prevalent income source among all respondents was Disability benefits, for which there was no difference between ASU and Non-ASU respondents.
There were some differences in reported employment income between the two groups. Respondents who reported ASU (9.5%) were more likely to report informal or self-employment than their non-ASU counterparts (6.8%). In contrast, respondents who reported ASU (8.0%) were less likely to report formal employment income than those that did not (11.7%).
Source: Everyone Counts 2018
Figure 17 – Text version
| Source of income | Did not attribute housing loss to ASU | Attributed housing loss to ASU |
|---|---|---|
| Welfare, social assistance | 44.4% | 21.3% |
| Disability benefit | 85.3% | 21.3% |
| Informal employment, self-employment | 6.8% | 9.5% |
| Employment | 11.7% | 8.0% |
| GST Refund | 8.9% | 7.9% |
| Money from Family/Friends | 4.3% | 4.9% |
| Seniors' Benefits | 6.3% | 4.8% |
| Employment Insurance | 3.5% | 2.4% |
| Child and Family Tax Benefits | 5.4% | 1.8% |
Comparisons between the 2016 and 2018 Point-in-Time counts
An advantage of conducting PiT counts periodically is that it provides a means to compare changes over time and monitor evolving trends among people experiencing homelessness. Of the 32 communities that conducted the nationally coordinated PiT count in 2016, 31 also participated in 2018, facilitating a comparison between years.
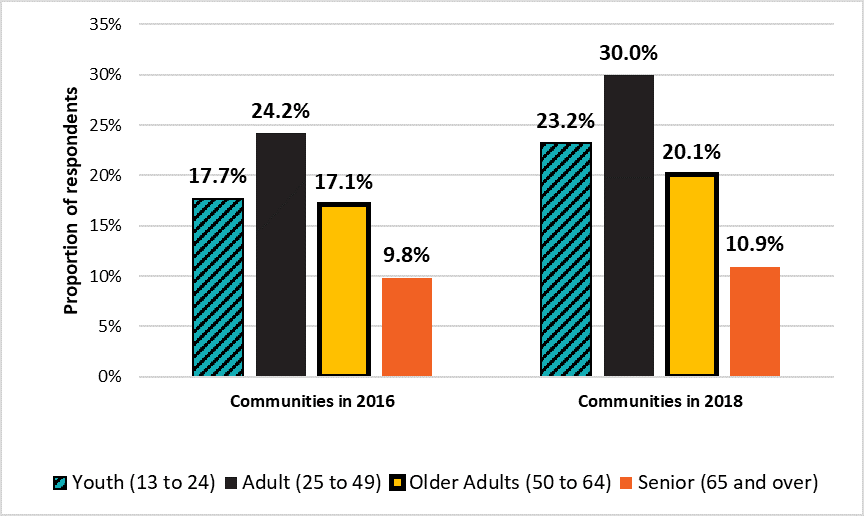
Comparing results for the 31 communities that participated in the 2016 and 2018 PiT counts, the proportion of respondents who reported ASU as a reason for housing loss increased from 20.9% in 2016 to 26.0% in 2018. This increase was apparent across all age groups, with marked growth in the youth (aged 13 to 24) and adult (aged 25 to 29) age groups (Figure 18). In both surveys, ASU as a reason for recent housing loss was more common in youth (aged 13 to 24) and adult (aged 25 to 49) age groups, than for older adults (aged 50 to 64) and seniors (aged 65 and over).
Source: Everyone Counts 2018
Figure 18 – Text version
| Age groups | Youth (13 to 24) |
Adult (25 to 49) |
Older Adults (50 to 64) |
Senior (65 and over) |
|---|---|---|---|---|
| Communities in 2016 | 17.7% | 24.2% | 17.1% | 9.8% |
| Communities in 2018 | 23.2% | 30.0% | 20.1% | 10.9% |
Note: based on survey data from Everyone Counts 2018 and the 2016 Coordinated PiT Count of homelessness in Canadian Communities.
Figure 19 – Text version
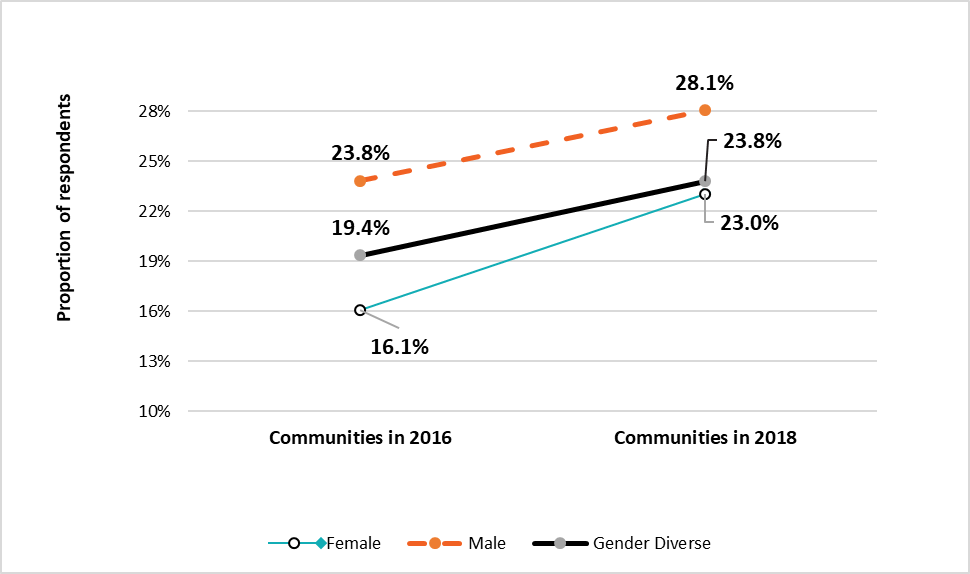
| Gender | Female | Male | Gender diverse |
|---|---|---|---|
| Communities in 2016 | 16.1% | 23.8% | 19.4% |
| Communities in 2018 | 23.0% | 28.1% | 23.8% |
Summary
The nationally coordinated Point-in-Time counts provide an opportunity to study homelessness in communities across the country and contribute to the development of a national picture of homelessness in Canada. By looking at respondents who identified ASU as a reason for their most recent housing loss, this report provides insight into the impact of addiction and substance use on homelessness in Canadian communities.
Based on data from the 2018 PiT count, ASU was the most commonly reported reason for housing loss, with 25.1% of all respondents identifying ASU as a reason for housing loss. As a reason for recent housing loss, ASU was most common among adult males and individuals without dependents. Conversely, veterans and newcomers to Canada were less likely to report ASU as contributing to their housing loss. The proportion of respondents who reported ASU and identified as Indigenous (27.7%) and non-Indigenous (27.2%) respondents were very similar. However, a higher proportion of women who identified as Indigenous (27.9%) reported ASU as a reason for housing loss compared to non-Indigenous women (21.4%).
Individuals who identified ASU were more likely to be staying in health or corrections systems or unsheltered locations than those who did not report ASU as a reason for housing loss. Also, those who reported ASU were more likely to have first experienced homelessness in their youth, to have had longer durations since their first experience of homelessness, and to have experienced chronic or episodic homelessness over the past year.
The findings also demonstrate the variability in sources of income between respondents who reported substance use and those that did not. A higher proportion of respondents who attributed their recent housing loss to ASU reported welfare or social assistance as well as informal or self-employment as sources of income compared to non-ASU respondents.
This report sheds light on the characteristics and homelessness experience of those who attribute their loss of housing, at least in part, to addiction or substance use. The findings in this report can be used to support program development and implementation of activities and services for those experiencing homelessness in Canada. Moving forward, this information can be supplemented with additional data from the 2020 nationally coordinated PiT count.
Glossary
- Adult
- Person between the ages of 25 and 49.
- Canadian-born
- Person who was born in Canada.
- Chronic
- Refers to individuals who have experienced 6 or more months of homelessness over the last year.
- Episodic
- Refers to individuals who have at least 3 separate episodes of homelessness in the past year.
- Family
- People who report being in the company of 1 or more family members during their episode of homelessness.
- Homelessness
- The living situation of an individual or family who does not have stable, permanent, appropriate housing, or the immediate prospect, means and ability of acquiring a home.
- Hidden homeless
- Refers to people experiencing homelessness that are staying with others (for example, couch surfing) because they are unable to secure a place of their own.
- Immigrant
- A landed immigrant/permanent resident is a person who has been granted the right to live in Canada permanently by immigration authorities. This is self reported at time of shelter entry.
- Indigenous homelessness
Refers to Indigenous Peoples who are in the state of having no home due to colonization, trauma and/or whose social, cultural, economic, and political conditions place them in poverty.
Having no home includes:
- those who alternate between shelter and unsheltered
- living on the street
- couch surfing
- using emergency shelters
- living in unaffordable, inadequate, substandard and unsafe accommodations, or living without the security of tenure
- anyone regardless of age, released from facilities, such as:
- hospitals
- mental health and addiction treatment centers
- prisons
- transition houses
- fleeing unsafe homes as a result of abuse in all its definitions, and
- any youth transitioning from all forms of care
For more information regarding homelessness in an Indigenous context, refer to the definition of Indigenous Homelessness in Canada.
- Indigenous peoples
- A person who self reports as being First Nations, Métis, Inuit, status or non status person, regardless of residency or membership status.
- Older adult
- Person between the ages of 50 and 64.
- Partner
- Person who is a member of a couple.
- Refugee
- Person who has been offered refugee protection in Canada who fear persecution and who are unwilling or unable to return to their home country. This is self reported at time of shelter entry.
- Refugee claimant
- A person who has claimed refugee protection in Canada. This is self reported at time of shelter entry.
- Single adult
- Person who is not part of a family with a partner and/or children during an episode of homelessness.
- Senior
- Person aged 65 and older.
- Systems
Facilities that are regulated by either federal, provincial or municipal bodies such as:
- hospitals
- treatment centres
- prisons
- jails, and
- detention centres
- Transitional housing
- Facilities that provide temporary shelter, but can be differentiated from emergency shelters by the longer length of stay and greater intensity of support services offered to clients. Transitional housing is an intermediate step between emergency shelter and permanent housing. Stays are typically between 3 months and 3 years.
- Veteran
- A former member of the Canadian Armed Forces. This is self reported at time of shelter entry.
- Youth
- Person between the ages of 13 and 24 who identified to be unaccompanied by a parent or guardian during their episode of homelessness.
Annexe A: Participating Reaching Home designated communities
- Barrie (Simcoe)
- Bathurst
- Belleville
- Brandon
- Brantford
- Calgary
- Charlottetown
- Drummondville
- Dufferin
- Durham (Oshawa)
- Edmonton
- Fredericton
- Gatineau / Outaouais
- Grande Prairie
- Guelph
- Halifax
- Halton Region
- Hamilton
- Iqaluit
- Kamloops
- Kelowna
- Kingston
- Lethbridge
- London
- Medicine Hat
- Metro Vancouver (Conducted in 2017)
- Moncton
- Montréal
- Nanaimo
- Nelson
- Nipissing / North Bay
- Ottawa
- Peel Region
- Peterborough
- Prince Albert
- Prince George
- Québec
- Red Deer
- Regina
- Saguenay/Lac St-Jean
- Saint John
- Saskatoon
- Sault Ste. Marie
- Sherbrooke
- St. Catharines / Niagara / Thorold
- St. John's
- Sudbury
- Summerside
- Sydney / Cape Breton
- Thompson
- Thunder Bay
- Toronto
- Trois-Rivières
- Victoria (Capital Regional District)
- Waterloo Region
- Whitehorse
- Windsor
- Winnipeg
- Wood Buffalo
- Yellowknife
- York
Find additional information on Reaching Home designated communities
Annexe B: 2018 Everyone counts survey
Indicate overnight location:
- Decline to answer
- Own apartment, house
- Someone else’s place
- Motel, hotel
- Hospital, jail, prison, remand centre
- Emergency shelter, domestic violence shelter
- Transitional shelter, housing
- Public space (for example, sidewalk, park, forest, bus shelter)
- Vehicle (car, van, RV truck)
- Makeshift shelter, tent or shack
- Abandoned, vacant building
- Other unsheltered location
- Respondent doesn’t know (likely homeless)
- What family members stayed with you last night? [Indicate survey numbers for adults. Check all that apply]
- None
- Partner
- Other adult
- Decline to answer
- Child(ren)/dependent(s)
- How old were you the first time you became homeless?
- Age
- Don’t know
- Decline to answer
- In total, how much time have you been homeless over the past year? (Best estimate)
- Length (days, weeks, months)
- Don’t know
- Decline to answer
- In total, how many different times have you experienced homelessness over the past year? (Best estimate)
- Number of times (Includes this time)
- Don’t know
- Decline to answer
- Have you stayed in an emergency shelter in the past year?
- Yes
- No
- Don’t know
- Decline to answer
- How long have you been in (community name)?
- Length (days, weeks, months, years)
- Always been here
- Don’t know
- Decline to answer
- Where did you live before you came here?
- Community, province or country
- Decline to answer
- Do you identify as Indigenous or do you have Indigenous ancestry? This includes First Nations, Métis, Inuit, with or without status. (If yes, please follow-up to specify)
- Yes
- No
- Don’t know
- Decline to answer
If yes:
- First nations
- Inuit
- Métis
- Non-status / have indigenous ancestry
- Did you come to Canada as an immigrant or refugee?
- Yes, immigrant
- Yes, refugee
- No
- Don’t know
- Decline to answer
If yes, how long have you been in Canada?
- Length: (in days, weeks, months, years)
- Or date: (in day, month, year)
- Don’t know
- Decline to answer
- Have you ever had any service in the Canadian Military or RCMP?
(Military includes Canadian Navy, Army, or Air Force)
- Yes, military
- Yes, RCMP
- No
- Don’t know
- Decline to answer
- How old are you? Or What year were you born? (If unsure, ask for best estimate)
- Age or year born
- Don’t know
- Decline to answer
- What gender do you identify with?
- Male / man
- Female / woman
- Two-spirit
- Trans female / trans woman
- Trans male / trans man
- Genderqueer/gender non-conforming
- Not listed (specify)
- Don’t know
- Decline to answer
- How do you describe your sexual orientation, for example straight, gay, lesbian?
- Straight/heterosexual
- Gay
- Lesbian
- Bisexual
- Two-spirit
- Questioning
- Queer
- Not listed (specify)
- Don’t know
- Decline to answer
- What happened that caused you to lose your housing most recently?
(Check all that apply. “Housing” does not include temporary arrangements (for example, couch surfing) or shelter stays.)
- Illness or medical condition
- Addiction or substance use
- Job loss
- Unable to pay rent or mortgage
- Unsafe housing conditions
- Experienced abuse by: parent or guardian
- Experienced abuse by: spouse or partner
- Conflict with: parent or guardian
- Conflict with: spouse or partner
- Incarcerated (jail or prison)
- Hospitalization or treatment program
- Other reason
- Don’t know
- Decline to answer
- Where do you get your money from? (May provide examples. Check all that apply)
- Employment
- Informal/self-employment (for example, bottle returns, panhandling)
- Employment insurance
- Welfare/social assistance
- Disability benefit
- Seniors benefits (for example, CPP, OAS, GIS)
- Child and family tax benefits
- Money from family/friends
- Other source
- No income
- Decline to answer
For the next questions, “homelessness” means any time when you have been without a secure place to live, including sleeping in shelters, on the streets, or living temporarily with others.
Annexe C: Reaching Home program resources
References
Employment and Social Development Canada. (2019). Everyone Counts 2018: Highlights: Preliminary results from the second nationally coordinated Point-in-Time count of homelessness in Canadian communities. Retrieved from:
https://www.canada.ca/en/employment-social-development/programs/homelessness/reports/highlights-2018-point-in-time-count.html
Employment and Social Development Canada. (2017a). Highlights: 2016 Coordinated Point-in-Time Count of Homelessness in Canadian Communities. Retrieved from:
https://www.canada.ca/en/employment-social-development/programs/homelessness/reports/highlights-2016-point-in-time-count.html
Employment and Social Development Canada. (2017b). Everyone Counts – Guide to Point-in-Time Counts in Canada – 2nd Edition. Retrieved from:
https://www.canada.ca/en/employment-social-development/programs/homelessness/reports/guide-point-in-time-counts.html#TOC1
Grinman, M., Chiu, S., Redelmeier, D., Levinson, W., Kiss, A., Tolomiczenko, Cowan, L., & Hwang, S. 2010. Drug Problems among homeless individuals in Toronto, Canada: prevalence, drugs of choice, and relation to health status. BMC Public Health, 10:94.
Health Canada. (2013). Canadian Alcohol and Drug Use Monitoring Survey 2012 (CADUMS): Retrieved from:
https://www.canada.ca/en/health-canada/services/health-concerns/drug-prevention-treatment/drug-alcohol-use-statistics/canadian-alcohol-drug-use-monitoring-survey-summary-results-2012.html
Khandor, E., Mason, K., Cowan, L., & Hwang S.W. 2009. The Street Health Report 2007 Bulletin #4: Homelessness, Mental Health & Substance Use. Toronto: Street Health.
Thompson, R., Wall, W., Greenstein, E., Grant, B., & Hasin, D. 2013. Substance-use disorders and poverty as prospective predictors of first-time homelessness in the United States. Research and Practice. 103(S2), S282-S288.
Vega, W., Aguilar-Gaxiola, S., Andrade, L., Bijl, R., Borges, G., Caraveo-Anduaga, J., DeWit D., Heeringa, S., Kessler, R., Kolody, B., Merikangas, K., Molnar, B., Walters, E., Warner, L., Wittchen, H. 2002. Prevalence and age of onset for drug use in seven international sites: results from the international consortium of psychiatric epidemiology. Drug and Alcohol Dependence, 68(3):285-297.
Report a problem on this page
- Date modified: