Office of Infrastructure of Canada
Quarterly Financial Report for the quarter ended September 30, 2016
Statement outlining results, risks and significant changes in operations, personnel and programs
Introduction
This quarterly report has been prepared by management as required by Section 65.1 of the Financial Administration Act and in the form and manner prescribed by the Treasury Board. This quarterly report should be read in conjunction with the Main Estimates and Supplementary Estimates (A), as well as Budget 2016.
Infrastructure Canada's (INFC) raison d'être is to lead the Government of Canada's efforts in addressing Canada's public infrastructure challenges. Strong, modern, world-class public infrastructure is a key factor in achieving the Government of Canada's priorities of a stronger economy, a cleaner environment and more prosperous, safer communities.
Further information on INFC's mandate, responsibilities, and programs can be found in INFC's 2016-17 Main Estimates.
Basis of Presentation
This quarterly report has been prepared by management using an expenditure basis of accounting. The accompanying Statement of Authorities includes INFC's spending authorities granted by Parliament and those used by INFC consistent with the Main Estimates and Supplementary Estimates for the 2016-17 fiscal year (FY). This quarterly report has been prepared using a special purpose financial reporting framework designed to meet financial information needs with respect to the use of spending authorities.
The authority of Parliament is required before monies can be spent by the government. Approvals are given in the form of annually approved limits through Appropriation Acts or through legislation in the form of statutory spending authority for specific purposes.
Infrastructure Canada uses the full accrual method of accounting to prepare and present its annual departmental financial statements that are part of the departmental performance reporting process. However, the spending authorities voted by Parliament remain on an expenditure basis.
Note that this report differs from the 2016-17 Main Estimates with respect to total departmental funding, reflecting the following adjustments since the Main Estimates were tabled: current year Supplementary Estimates (A) funding received, which included Operating and Contribution funding linked to new and existing programs as outlined in Budget 2016.
INFC works in collaboration with other federal departments and agencies to deliver some of its transfer payment programs (collectively known as federal delivery partners). For certain programs, funding flows as advances to a federal delivery partner, who in turn manages claims from ultimate recipients on behalf of INFC. The timing of advances generally coincides with when federal delivery partners receive claims from ultimate recipients.
The federal delivery partners for certain sunsetting programs are:
- Atlantic Canada Opportunities Agency;
- Economic Development Agency of Canada for the Regions of Quebec;
- Federal Economic Development Agency for Southern Ontario;
- Western Economic Diversification Canada; and
- Transport Canada.
It should be noted that this quarterly report has not been subject to an external audit or review.
Highlights of Fiscal Quarter and Fiscal Year to Date Results
This section highlights the significant items that contributed to the change in resources available for use from 2015-16 to 2016-17 and in actual expenditures from September 30, 2015 to September 30, 2016.
Authorities
Graph 1: Comparison of Authorities Available as of September 30, 2016 and September 30, 2015
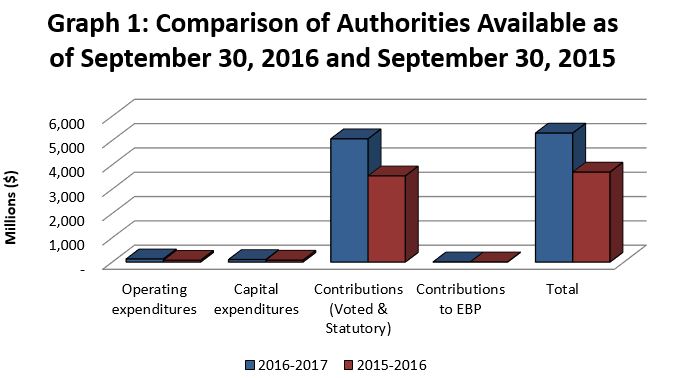
As shown in the Statement of Authorities, INFC's total authorities available for 2016-17 are $5.3 billion as of the end of Quarter 2 (Q2) and represent a $1.6 billion increase compared to the same quarter in the prior year. This increase is summarized in the table below:
| Total authorities as of September 30, 2016 |
Increase/(Decrease) versus Prior Year-to-date (000's) |
% Change versus prior year |
|---|---|---|
Contributions (Voted and Statutory) |
1,525,221 |
43% |
Operating Expenditures |
54,191 |
74% |
Capital Expenditures |
23,934 |
31% |
Contributions to Employee Benefit Plan |
1,213 |
22% |
Minister's Salary and Car Allowance |
2 |
2% |
The source of the year-over-year change is summarized as follows:
- Contributions (both Voted and Statutory) – the increase is due to an increase in authority levels as outlined in Budget 2016.
- Operating – the increase is due to increased authorities related to the New Champlain Bridge Corridor Project for 2016-17 compared to 2015-16, as well as an increase related to new and existing programs as outlined in Budget 2016.
- Capital – the increase is primarily related to authority levels for the New Champlain Bridge Corridor and the Gordie Howe International Bridge projects.
- Statutory Contributions to Employee Benefit Plan (EBP) – the increase is related to an increase in the number of employees.
Expenditure Analysis
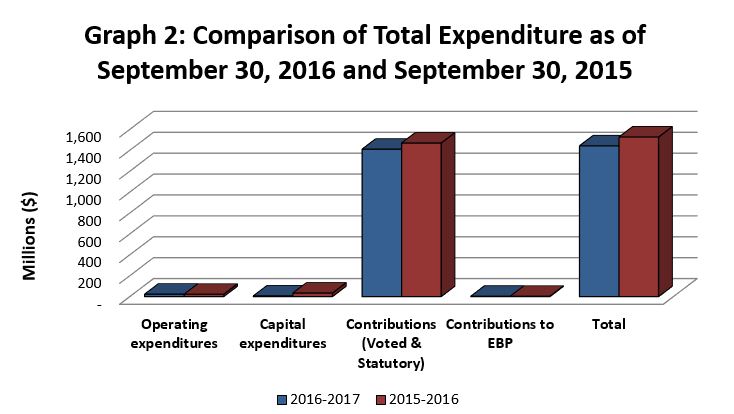
Expenditures at the end of Q2 were $1.442 billion, compared to $1.527 billion reported in the same period of 2015-16, representing a decrease of 6% between the two years. The source of the relative decrease is demonstrated in the tables, graphs and analysis below.
Graph 2: Comparison of Total Expenditure as of September 30, 2016 and September 30, 2015
| Year-to-date expenditures | Increase/(Decrease) Versus Prior Year-to-date (000's) |
% Change versus prior year |
|---|---|---|
Operating Expenditures |
964 |
4% |
Contributions to Employee Benefit Plan |
153 |
5% |
Minister's Salary and Car Allowance |
21 |
- |
Capital Expenditures |
(27,029) |
(81%) |
Contributions (Voted and Statutory) |
(58,928) |
(4%) |
Operating Expenditures
Further details are provided later in this report, by standard object.
Contributions to Employee Benefit Plan
At the end of Q2 INFC contributed more to Employee Benefit Plans due to an increase in the number of employees compared to the same period last year.
Minister's Salary and Car Allowance
The increase is due to the fact there were no expenditures for the Minister's salary and car allowance at the end of Q2 in 2015-16.
Capital
The reduction in capital expenditures is primarily due to land acquisition for the New Champlain Bridge Corridor Project that occurred during 2015-16.
Transfer Payments – Contributions
Year-to-date Contributions (Voted and Statutory) expenditures as of the end of Q2 have decreased in comparison to last year.
Graph 3: Comparison of Authorities used for Contributions (Voted and Statutory) as of September 30, 2016 and September 30, 2015
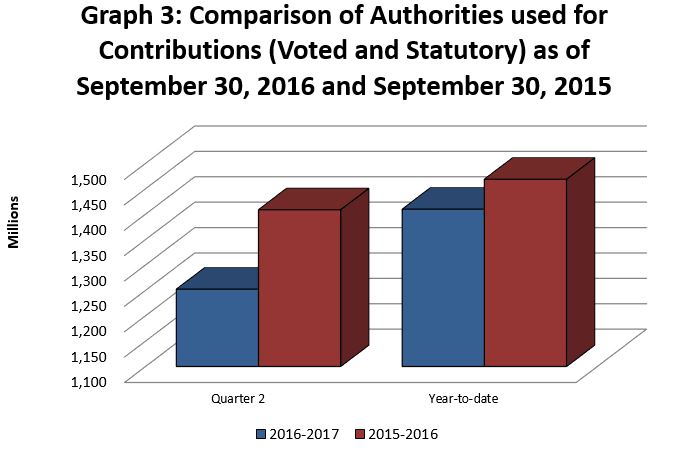
Significant changes in year-to-date contribution expenditures between September 2016 and September 2015 were as follows:
Program Fund |
Increase/(Decrease) |
% Change versus prior year |
|---|---|---|
Gas Tax Fund |
56,831 |
5% |
New Building Canada Fund |
26,405 |
- |
Inuvik to Tuktoyaktuk Highway Fund |
10,850 |
38% |
New Building Canada Fund |
7,576 |
- |
Green Infrastructure Fund |
4,080 |
278% |
Building Canada Fund – Communities Component (BCF-CC) |
(7,028) |
(30%) |
Canada Strategic Infrastructure Fund (CSIF) |
(17,031) |
(44%) |
Building Canada Fund – Major Infrastructure Component (BCF-MIC) |
(135,011) |
(34%) |
The source of the year-over-year change is summarized as follows:
- Gas Tax Fund - the increase is due to the indexation of the Gas Tax Fund.
- NBCF-PTIC-NRP, and NBCF-PTIC-SCF - the increases relate to a relative increase in claims as more projects are approved and begin construction.
- Inuvik to Tuktoyaktuk Highway Fund - the increase is due to overall claims being higher compared to the same period last year.
- Green Infrastructure Fund - the increase is due to overall claims being higher compared to the same period last year.
- BCF-CC and CSIF - these are older programs where overall claims are diminishing as projects are completed.
- BCF-MIC - the primary reason for the reduction is the timing of advances provided to federal delivery partners. Fewer advances have been made to federal delivery partners by the end of Q2 compared to last year
Departmental Budgetary Expenditures by Standard Object
The planned Departmental Budgetary Expenditures by Standard Object are set out in the table at the end of this report. Aggregate year-to-date expenditures in 2016-17 decreased by $84.8 million, compared with the same quarter last year. The largest single factor was a reduction in Transfer Payments as explained above.
A breakdown of variances in year-to-date spending by standard object is below:
Changes to Expenditures by Standard Object |
Increase/(Decrease) versus Prior Year-to-date |
% Change versus prior year |
|---|---|---|
Personnel |
477 |
3% |
Repair and Maintenance |
431 |
108% |
Other Subsidies and Payments |
234 |
325% |
Acquisition of Machinery and Equipment |
112 |
94% |
Rentals |
87 |
16% |
Information |
73 |
46% |
Utilities, materials and supplies |
16 |
47% |
Transportation and Communications |
2 |
1% |
Professional Services and Special Services |
(8,298) |
(47%) |
Acquisition of land, buildings and works |
(19,025) |
(95%) |
Transfer Payments |
(58,928) |
(4%) |
The source of the year-over-year change is summarized as follows:
- Repair and Maintenance the increase is related primarily to repair of engineering works: highways, roads and streets associated with the New Champlain Bridge Corridor Project.
- Other Subsidies and Payments the increase is related to payment in lieu of taxes for properties acquired for the New Champlain Bridge Corridor Project.
- Acquisition of Machinery and Equipment the increase is related to the acquisition of informatics equipment.
- Professional and Special Services the reduction is primarily associated with legal services costs, which were higher last year as the New Champlain Bridge Corridor Project agreement was being prepared.
- Acquisition of land, buildings and works the reduction is primarily associated to land that was acquired last year for the New Champlain Bridge Corridor Project.
- Transfer payment details were previously discussed.
Overall, Infrastructure Canada has spent 27.2% of its current Total Authorities as of September 30, 2016, compared with 41.5% at the end of Q2 of the previous fiscal year.
Risks and Uncertainties
There are challenges from several sources impacting the ability of the Department to deliver on current programs, the New Building Canada Fund (NBCF), and the new programs under Budget 2016. Particularly:
- Limited staff to support the increasing workload, with enduring high turnover rates and potential loss of corporate knowledge, specialized skills and experience for key positions;
- Increased departmental role related to additional horizontal performance and reporting responsibilities across different federal government departments; and
- Infrastructure programs are contingent on the execution by provincial, territorial and municipal partners for timely delivery, cost-sharing and joint project management.
These factors could lead to delays in submissions, approvals and provision of timely infrastructure funding, creating the possibility that the pattern of funding approved may not reflect the actual pattern of work. INFC has streamlined NBCF programs (e.g., expanded funding categories, removal of P3 screen) and continues to review and approve NBCF project proposals and is working diligently with its stakeholders on the negotiation of contribution agreements to accelerate the delivery of the NBCF. The Department is also ensuring that it has in place strategies, plans and resources to implement the Investing in Canada Plan.
Factors such as the lack of quality data on infrastructure, limited capacity, and new programs' complexity in terms of horizontal coordination among several federal departments, lead to challenges for INFC to being able to report adequately on its policies' and infrastructure investments' outcomes. This, in turn, may negatively impact its ability to tell Canadians a compelling performance story, to respond to central agencies' new reporting requirements and expectations, as well as to properly evaluate its programs and ensure continuous improvements. INFC continues to engage and work with federal partners, other levels of government and stakeholders to improve the quality of infrastructure data, to achieve consensus on policy outcomes, as well as to build reporting capacity. Through the implementation of Phase 1 of the new infrastructure plan, INFC has secured funding for a data development initiative with Statistics Canada and two new programs, namely the Asset Management Fund and the Capacity Building for Climate Change Challenges, will support improved asset management practices and related data collection.
The integrity of the Champlain Bridge could be compromised earlier than expected, leading to its complete or partial closing before the planned new bridge is in service. This could result in significant overtime, pressure on capacity, securing approvals to move money to earlier years in the fiscal framework and re-shifting some priorities. To address these risks, the Department is relying on the Jacques Cartier and Champlain Bridges Incorporated's (JCCBI) extensive project plan that covers the repair, maintenance and operation of its structures. JCCBI was allocated funding for 2014-2019 through Budget 2014 and other sources to support its comprehensive project plan that covers the repairs, maintenance and operation of all structures under its responsibility, including the Champlain Bridge. Further, there are working groups and interdepartmental teams who will be regularly monitoring the project to ensure that the private partner conducts the work as agreed under the terms of the Project Agreement, in order to ensure the earliest opening date possible for the New Champlain Bridge Corridor.
The Gordie Howe International Bridge Project will create a new international crossing between Windsor, Ontario and Detroit, Michigan. The procurement and delivery of the new international crossing will be managed by the Windsor-Detroit Bridge Authority (WDBA), a federal Crown corporation, and a private sector partner will be responsible for its design, construction, operation and maintenance. A project of this scope has many complexities, and INFC is working diligently with the WDBA to support ongoing management and mitigation of project risks.
The number of current and future large scale whole-of-government initiatives (i.e. projects like data centre consolidation, new pay system, financial management transformation, the shared travel system, migration of web sites to Canada.ca, and preparation for moving to GCDocs document management) may impact the Department's ability to react quickly and nimbly to increased internal business pressures that require timely support services and solutions, and ongoing service availability. The focus of the risk responses is to ensure departmental readiness for new infrastructure programs and the continued delivery of timely IMIT, HR, Finance and other enabling services. INFC will also be working with Shared Services Canada and Public Services and Procurement Canada to ensure they are aware of the Department's top priorities.
Significant Changes in Relation to Operations, Personnel and Programs
There have been no significant changes in relation to operations, personnel and programs at Infrastructure Canada during Q2.
Approval by Senior Officials
Approved by:
Original signed by:
Jean-François Tremblay,
Deputy Head
Darlene Boileau,
Chief Financial Officer
Signed at Ottawa, Canada, November 17, 2016
Quarterly Financial Report
For the quarter ended September 30, 2016
Statement of Authorities (unaudited)
Fiscal year 2016-2017
| Total available for use for the year ending March 31, 2017 |
Used during the quarter ended September 30, 2016 |
Year to date used at quarter-end |
|
|---|---|---|---|
Vote 1 – Operating expenditures |
127,721 |
11,860 |
22,871 |
Vote 5 – Capital expenditures |
101,575 |
5,331 |
6,304 |
Vote 10 – Contributions |
2,996,452 |
216,233 |
373,841 |
Budgetary Statutory Authorities |
|
|
|
(S) – Contributions to employee benefit plans |
6,781 |
1,468 |
2,937 |
(S) – Gas Tax Fund |
2,071,933 |
1,035,967 |
1,035,967 |
(S) – Minister salary and car allowance |
84 |
14 |
21 |
Total Budgetary authorities |
5,304,546 |
1,270,873 |
1,441,941 |
Non-budgetary authorities |
- |
- |
- |
Total authorities |
5,304,546 |
1,270,873 |
1,441,941 |
Statement of Authorities (unaudited) (continued)
Fiscal year 2015-2016
| Total available for use for the year ending March 31, 2016 |
Used during the quarter ended September 30, 2015 |
Year-to-date used at quarter-end |
|
|---|---|---|---|
Vote 1 – Operating expenditures |
73,530 |
11,552 |
21,907 |
Vote 5 – Capital expenditures |
77,641 |
33,333 |
33,333 |
Vote 10 – Contributions |
1,569,895 |
429,556 |
489,601 |
Budgetary Statutory Authorities |
|||
(S) – Contributions to employee benefit plans |
5,568 |
1,392 |
2,784 |
(S) – Gas Tax Fund |
1,973,269 |
979,135 |
979,135 |
(S) – Minister salary and car allowance |
82 |
- |
- |
Total Budgetary authorities |
3,699,985 |
1,454,968 |
1,526,760 |
Non-budgetary authorities |
- |
- |
- |
Total authorities |
3,699,985 |
1,454,968 |
1,526,760 |
Download
If the following document is not accessible to you, please contact info@INFC.gc.ca for assistance.
- Statement of Authorities (Size: 16.68 KB) (PDF version)
Help on accessing alternative formats, such as PDF, PPT and ZIP files, can be obtained in the alternate format help section.
Quarterly Financial Report
For the quarter ended September 30, 2016
Departmental budgetary expenditures by Standard Object (unaudited)
Fiscal year 2016-2017
| Planned expenditures for the year ending March 31, 2017 |
Expended during the quarter ended September 30, 2016 |
Year to date used at quarter-end |
|
|---|---|---|---|
Expenditures: |
|||
Personnel |
45,553 |
9,720 |
19,143 |
Transportation and communications |
911 |
132 |
237 |
Information |
470 |
145 |
232 |
Professional and special services |
135,637 |
6,506 |
9,458 |
Rentals |
2,944 |
237 |
627 |
Repair and maintenance |
1,057 |
557 |
827 |
Utilities, materials and supplies |
267 |
28 |
50 |
Acquisition of land, buildings and works |
47,824 |
980 |
1,022 |
Acquisition of machinery and equipment |
1,274 |
58 |
231 |
Transfer payments |
5,068,385 |
1,252,200 |
1,409,808 |
Public debt charges |
- |
- |
- |
Other subsidies and payments |
224 |
310 |
306 |
Total net budgetary expenditures |
5,304,546 |
1,270,873 |
1,441,941 |
Departmental budgetary expenditures by Standard Object (unaudited) (continued)
Fiscal year 2015-2016
| Planned expenditures for the year ending March 31, 2016 |
Expended during the quarter ended September 30, 2015 |
Year-to-date used at quarter-end |
|
|---|---|---|---|
Expenditures: |
|||
Personnel |
38,791 |
9,410 |
18,666 |
Transportation and communications |
737 |
137 |
235 |
Information |
453 |
73 |
159 |
Professional and special services |
42,689 |
15,737 |
17,756 |
Rentals |
2,596 |
309 |
540 |
Repair and maintenance |
1,975 |
396 |
396 |
Utilities, materials and supplies |
477 |
17 |
34 |
Acquisition of land, buildings and works |
68,589 |
20,045 |
20,047 |
Acquisition of machinery and equipment |
469 |
104 |
119 |
Transfer payments |
3,543,164 |
1,408,691 |
1,468,736 |
Public debt charges |
- |
- |
- |
Other subsidies and payments |
45 |
49 |
72 |
Total net budgetary expenditures |
3,677,618 |
1,454,968 |
1,526,760 |
Download
If the following document is not accessible to you, please contact info@INFC.gc.ca for assistance.
- Departmental budgetary expenditures by Standard Object (Size: 16.66 KB) (PDF version)
Help on accessing alternative formats, such as PDF, PPT and ZIP files, can be obtained in the alternate format help section.
- Date modified: