2016–17 Departmental Results Report
Analysis of trends in spending and human resources
Actual expenditures
2016–17 |
2016–17 |
2016–17 |
2016–17 |
Difference |
|---|---|---|---|---|
3,869,509,257Footnote 19 |
3,322,632,827 |
5,349,161,397Footnote 20 |
3,207,766,272 |
(114,866,555) |
2016–17 |
2016–17 |
2016–17 Difference |
|---|---|---|
380 |
385 |
5 |
Departmental Spending Trend
In 2016-17 Infrastructure Canada's total spending is over $3.2 billion. Departmental spending has been increasing slowly for the past three years, and in 2016-17, the Department started to implement the new programs under the Investing in Canada Plan Phase 1. The approval process for new programs under the Investing in Canada Plan Phase 2 also started in 2016-17, obtaining approval in June 2017. The implementation of these new programs is starting in 2017-18, with funding being obtained through 2017-18 Supplementary Estimates processes.
After peaking in 2011-12 to over $4.5 billion in spending, the departmental spending had continued to rise until 2013-14 at over $3.5 billion, but it started to decline in 2014-15. Even though the new programs under the New Building Canada Fund were approved and implementation had started in 2014-15, departmental spending reached a record low in six years, as many of the existing programs were approaching completion.
In 2016-17, the Department introduced the transfer of funding from older federal infrastructure programs (Voted spending) through the Gas Tax Fund to ensure that funds were directed towards municipal infrastructure priorities in the near term. This was funding that had not been prioritized for projects by provinces and territories by March 31, 2016.
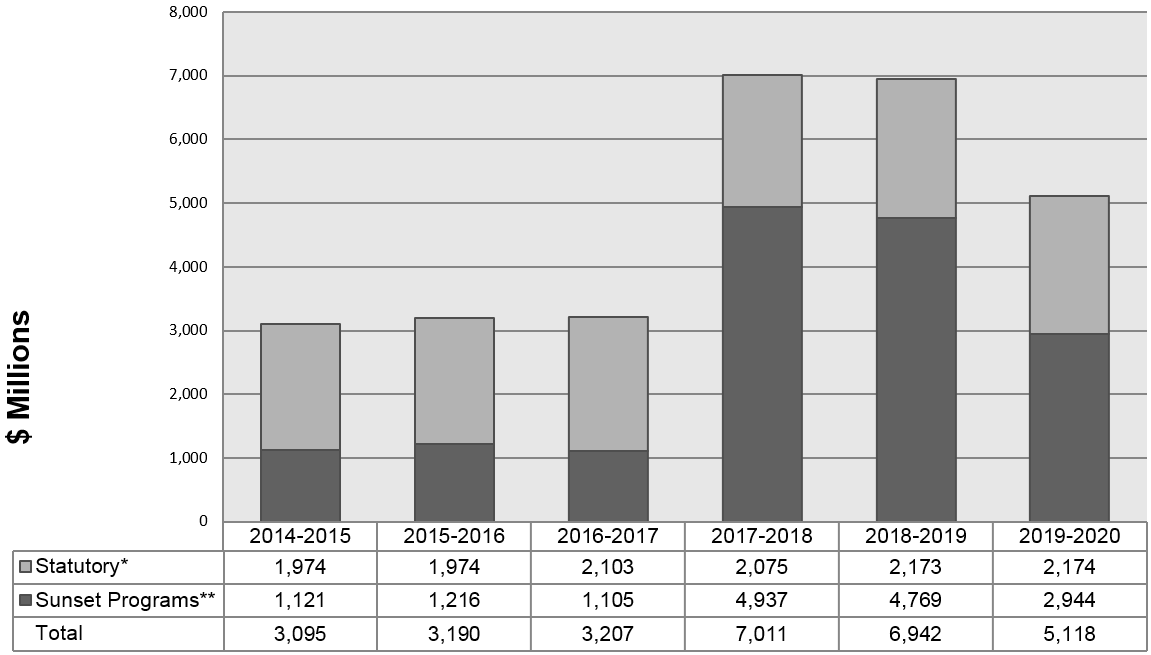
*Statutory spending includes some operating expenses, and the federal Gas Tax Fund program which became permanent in 2014-15. In 2016-17, $30,155,357 in Voted spending flowed to provinces and territories through the federal Gas Tax Fund, as legacy funding was transferred from sunsetting programs to the federal Gas Tax Fund. The transfer of legacy funding (Voted spending) through the federal Gas Tax Fund ensures that funds are directed towards municipal infrastructure priorities in the near term.
**Sunset Programs are time-limited programs that do not have an ongoing funding nor policy authority.
Text description of graph 1
Infrastructure Canada provides funding for large and complex public infrastructure projects, and in 2016-17 there were large variances for Program 1.3 Investments in National Infrastructure Priorities and Program 1.4 Large-Scale Infrastructure Investments. For these programs as well as for Program 1.6 New Bridge for the St. Lawrence Corridor Project, after construction has started, a number of factors beyond the control of funding recipients can result in lower spending than anticipated. These factors range from lower than anticipated project costs, to project delays as a result of inclement weather, and technical and other construction-related complexities. It is also important to note that federal funding does not actually flow to recipients until they have submitted their claims for actual costs incurred.
Over the years, Infrastructure Canada's annual spending lapse has been relatively high. In 2016-17, the Department lapsed over $2.14 billion in spending authorities. However, lapsed authorities are re-profiled to the future and the funding remains committed to the infrastructure programs. The re-profiling of funds is necessary as projects are not completed on a yearly appropriated schedule and partners do not submit their claims in a given fiscal year as expected, which leads to federal funding not always flowing as planned.
Programs and Internal Services |
2016-17 Main Estimates |
2016-17 Planned Spending |
2017-18 Planned Spending |
2018-19 Planned Spending |
2016-17 Total Authorities Available for Use |
2016-17 Actual Spending (Authorities Used) |
2015-16 Actual Spending (Authorities Used) |
2014-15 Actual Spending (Authorities Used) |
|---|---|---|---|---|---|---|---|---|
Funding for Provincial-Territorial Priorities |
97,380,082 |
97,380,082 |
56,608,537 |
27,826,737 |
97,327,297Footnote 21 |
3,064,280Footnote 22 |
50,036,481 |
25,078,120 |
Permanent and Flexible Public Infrastructure Funding |
2,074,601,337 |
2,074,601,337 |
2,074,765,524 |
2,173,390,051 |
2,103,972,917Footnote 23 |
2,102,832,309Footnote 24 |
1,974,079,201 |
1,974,387,706 |
Investments in National Infrastructure Priorities |
174,342,089Footnote 25 |
49,588,756 |
3,058,211,074 |
2,627,519,290 |
1,646,617,194Footnote 26 |
164,694,236 |
84,854,656 |
139,119,440 |
Large-Scale Infrastructure Investments |
1,269,427,535Footnote 27 |
751,990,832 |
1,026,254,190 |
1,130,874,062 |
1,151,636,243Footnote 28 |
703,602,026 |
887,432,688 |
787,479,954 |
Infrastructure Investments in Small Communities and Rural Areas |
131,922,508 |
227,236,114Footnote 29 |
162,625,742 |
199,623,092 |
167,041,506Footnote 30 |
157,116,165 |
88,141,483 |
92,993,364 |
New Bridge for the St. Lawrence Corridor Project |
91,859,300 |
91,859,300 |
590,744,529 |
740,219,869 |
134,274,879Footnote 31 |
28,165,895Footnote 32 |
66,281,311 |
40,687,967 |
Subtotal |
3,839,532,851 |
3,292,656,421 |
6,969,209,596 |
6,899,453,101 |
5,300,870,036 |
3,159,474,911 |
3,150,825,820 |
3,059,746,551 |
Internal Services |
29,976,406 |
29,976,406 |
42,454,205 |
43,012,828 |
48,291,361 |
48,291,361 |
39,615,936 |
36,135,562 |
Total |
3,869,509,257 |
3,322,632,827 |
7,011,663,801 |
6,942,465,929 |
5,349,161,397 |
3,207,766,272 |
3,190,441,756 |
3,095,882,113 |
Actual human resources
Programs and Internal Services |
2014–15 |
2015–16 |
2016–17 |
2016–17 Actual |
2017–18 Planned |
2018–19 Planned |
|---|---|---|---|---|---|---|
Funding for Provincial-Territorial Priorities |
2 |
3 |
1 |
3 |
1 |
1 |
Permanent and Flexible Infrastructure Funding |
18 |
22 |
23 |
15 |
22 |
23 |
Investments in National Infrastructure |
24 |
27 |
24 |
34 |
46 |
51 |
Large-Scale Infrastructure Investments |
57 |
68 |
72 |
75 |
84 |
81 |
Infrastructure Investments in Small Communities and Rural Areas |
25 |
32 |
16 |
17 |
15 |
15 |
New Bridge for the St. Lawrence Corridor Project |
37 |
44 |
74 |
47 |
89 |
89 |
Subtotal |
163 |
196 |
210 |
191 |
257 |
260 |
Internal Services |
170 |
161 |
170 |
194 |
158 |
155 |
Total |
333 |
357 |
380 |
385 |
415 |
415 |
Expenditures by vote
For information on the Infrastructure Canada's organizational voted and statutory expenditures, please consult the Public Accounts of Canada 2017.ii
Alignment of spending with the whole-of-government framework
Program |
Spending area |
Government of Canada activity |
2016–17 Actual spending |
|---|---|---|---|
Funding for Provincial-Territorial Priorities |
Economic Affairs |
Strong Economic Growth |
3,064,280 |
Permanent and Flexible Public Infrastructure Funding |
Economic Affairs |
Strong Economic Growth |
2,102,832,309 |
Investments in National Infrastructure Priorities |
Economic Affairs |
Strong Economic Growth |
164,694,236 |
Large-Scale Infrastructure Priorities |
Economic Affairs |
Strong Economic Growth |
703,602,026 |
Infrastructure Investments in Small Communities and Rural Areas |
Economic Affairs |
Strong Economic Growth |
157,116,165 |
New Bridge for the St. Lawrence Corridor Project |
Economic Affairs |
Strong Economic Growth |
28,165,895 |
Spending area |
Total planned spending |
Total actual spending |
|---|---|---|
Economic affairs |
3,292,656,421 |
3,159,474,911 |
Financial statements and financial statements highlights
Financial statements
Infrastructure Canada's financial statements (unaudited) for the year ended March 31, 2017, are available on the Departmental website.
Financial statements highlights
Financial information |
2016–17 |
2016–17 |
2015–16 |
Difference (2016–17 actual minus 2016–17 planned) |
Difference (2016–17 actual minus 2015–16 actual) |
|---|---|---|---|---|---|
Total expenses |
3,322,632,000 |
3,193,051,000 |
3,142,678,000 |
(129,581,000) |
50,373,000 |
Total revenues |
- |
- |
- |
- |
- |
Net cost of operations before government funding and transfers |
3,322,632,000 |
3,193,051,000 |
3,142,678,000 |
(129,581,000) |
50,373,000 |
Financial Information |
2016–17 |
2015–16 |
Difference |
|---|---|---|---|
Total net liabilities |
1,371,502,000 |
767,084,000 |
604,418,000 |
Total net financial assets |
147,458,000 |
188,880,000 |
(41,422,000) |
Departmental net debt |
1,224,045,000 |
578,204,000 |
645,841,000 |
Total non-financial assets |
1,371,707,000 |
641,447,000 |
730,260,000 |
Departmental net financial position |
147,662,000 |
63,243,000 |
84,419,000 |
Footnotes
- Footnote 19
-
The 2016-17 Main Estimates was higher than the 2016-17 Planned spending as it included $546,876,430 in funding that Infrastructure Canada had determined it would not spend in 2016-17.
- Footnote 20
-
The 2016-17 Total authorities available for use were increased in 2016-17 as additional funding was obtained through 2016-17 Supplementary Estimates, including new programs under the initial phase of the Investing in Canada plan.
- Footnote 21
-
The 2016-17 Total authorities available for use under this Program was lower than the 2016-17 Main Estimates as the operating amount was readjusted for 2016-17.
- Footnote 22
-
The 2016-17 Actual spending under this Program was lower than anticipated, as the Department received fewer claims for completed projects than expected.
- Footnote 23
-
The 2016-17 Total authorities available for use under this Program were higher than the 2016-17 Main Estimates as funding authorities were transferred from older federal infrastructure programs to flow through the federal Gas Tax Fund to provinces and territories in accordance with Budget 2016. This transfer of funding authorities (Voted spending) ensures that funds will be directed towards municipal infrastructure priorities in the near term.
- Footnote 24
-
Funding under this program typically represents statutory spending. However the 2016-17 Actual Spending also includes Voted spending, which is the transfer of funding from older federal infrastructure programs to provinces and territories through the federal Gas Tax Fund. The transfer of Voted spending through the federal Gas Tax Fund ensures that funds will be directed towards municipal infrastructure priorities in the near term.
- Footnote 25
-
As stated in the 2016-17 Report on Plans and Priorities, the 2016-17 Main Estimates was higher than the 2016-17 Planned Spending under this Program as it included funding that Infrastructure Canada had determined it would not spend in the fiscal year. As such, funding from 2016-17 will be re-profiled to future years and remains committed for infrastructure projects. This applies largely to the following transfer payment programs: Public Transit Infrastructure Fund, Clean Water and Wastewater Fund and New Building Canada Fund-National Infrastructure Component.
- Footnote 26
-
The 2016-17 Total authorities available for use under this program were increased as additional funding was obtained for the first phase of the Investing in Canada plan through 2016-17 Supplementary Estimates.
- Footnote 27
-
As stated in the 2016-17 Report on Plans and Priorities, the 2016-17 Main Estimates was higher than the 2016-17 Planned spending under this Program as it included funding that Infrastructure Canada had determined it would not spend in 2016-17. As such, funding from 2016-17 will be re-profiled to future years and remain committed for infrastructure projects in the future. This applies to the following transfer payment programs: New Building Canada Fund-National and Regional Projects and Building Canada Fund-Major Infrastructure Component. This also includes funding for the Department's direct costs to the Gordie Howe International Bridge project.
- Footnote 28
-
The 2016-17 Total authorities available for use under this program were increased, as additional funding was obtained through 2016-17 Supplementary Estimates for two projects under the first phase of the Investing in Canada plan.
- Footnote 29
-
As stated in the 2016-17 Report on Plans and Priorities, the planned spending was higher than the Main Estimates under this program as it included additional funding that Infrastructure Canada had determined it would spend in 2016-17.
- Footnote 30
-
The 2016-17 Total authorities available for use under this Program were higher than the 2016-17 Main Estimates as for the territories, flexibility was provided to transfer funds between the New Building Canada Fund-Provincial-Territorial Infrastructure Component-National Research Priorities and the New Building Canada Fund-Provincial-Territorial Infrastructure Component-Small Communities Fund.
- Footnote 31
-
The 2016-17 Total authorities available for use under this Program was higher than the 2016-17 Main Estimates and 2016-17 Planned spending as additional funding was obtained through 2016-17 Supplementary Estimates.
- Footnote 32
-
The 2016-17 Actual spending under this program was lower than anticipated, and funding will be re-profiled to future years.
- Date modified: