2015-2016 Departmental Performance Report (DPR)
Section II: Expenditure Overview
Actual Expenditures
| 2015-16 Main Estimates |
2015-16 Planned Spending |
2015-16 Total Authorities Available for Use |
2015-16 Actual Spending (authorities used) |
Difference (actual minus planned) |
|---|---|---|---|---|
3,633,262,748 |
3,633,262,748 |
3,762,351,961 |
3,190,441,756 |
(442,820,992) |
| 2015-16 Planned |
2015-16 Actual |
2015-16 Difference (actual minus planned) |
|---|---|---|
370 |
357 |
(13) |
INFC's program design recognizes the provincial, territorial and municipal responsibility for the majority of public infrastructure, and the Department's participation as a funding partner. Accordingly, INFC is not responsible for the management of infrastructure projects, with the exception of the NCBC. In the case of its contribution programs, INFC reimburses eligible expense claims submitted by funding recipients – the project managers. As such, it is important to note that the Department's cash flows lag behind the actual rate of construction of projects. Work begins upon project approval: contracts are put in place, plans are drawn up, materials are ordered and construction starts. While the Department commits funds upon project approval, federal funding does not actually flow to recipients until they have submitted their claims for actual costs incurred. This is a key risk-management approach for the Department, one that ensures that it only pays for work that has already been undertaken. This also means that INFC's performance results are directly affected by project proponents' schedules, which may change. In particular, INFC Programs targeting large-scale projects can experience delays due to factors that are outside the Department's control, such as inclement weather, geological challenges, shortages of labour, and technical or other construction-related complexities that prevent proponents from completing work and submitting associated claims.
The Department works continually with provinces, territories, municipalities and other partners to ensure that forecasts are as accurate as possible and to re-profile funding under all INFC programs to meet the construction needs of its partners.
Budgetary Performance Summary
| Program(s) and Internal Services | 2015-16 Main Estimates |
2015-16 Planned Spending |
2016-17 Planned Spending |
2017-18 Planned Spending |
2015-16 Total Authorities Available for Use |
2015-16 Actual Spending (authorities used) |
2014-15 Actual Spending (authorities used) |
2013-14 Actual Spending (authorities used) |
|---|---|---|---|---|---|---|---|---|
Funding for Provincial-Territorial Priorities |
91,061,247 |
91,061,247 |
97,380,082 |
0 |
90,885,828 |
50,036,481 |
25,078,120 |
191,464,385 |
Permanent and Flexible Public Infrastructure Funding |
1,976,213,928 |
1,976,213,928 |
2,074,601,337 |
2,074,595,243 |
1,975,090,837 |
1,974,079,201 |
1,974,387,706 |
2,107,905,313 |
Investments in National Infrastructure PrioritiesFootnote 6 |
148,607,942 |
148,607,942 |
49,588,756 |
387,828,588 |
146,771,469 |
84,854,656 |
139,119,440 |
See footnote 6 |
Large-Scale Infrastructure InvestmentsFootnote 6b |
1,174,990,518 |
1,174,990,518 |
705,844,608 |
1,026,629,508 |
1,172,413,053 |
887,432,689 |
787,479,954 |
See footnote 6 |
Infrastructure Investments in Small Communities and Rural Areas Footnote 6c |
171,319,905 |
171,319,905 |
227,236,114 |
109,369,164 |
170,100,556 |
88,141,483 |
92,993,364 |
See footnote 6 |
New Bridge for the St. Lawrence Corridor Project |
42,661,977 |
42,661,977 |
91,859,300 |
534,327,337 |
167,474,282 |
66,281,311 |
40,687,967 |
See footnote 6 |
Programs under Former PAA |
0 |
0 |
0 |
0 |
0 |
0 |
0 |
1,179,051,643 |
Sub-Total |
3,604,855,517 |
3,604,855,517 |
3,246,438,197 |
4,132,749,840 |
3,722,736,025 |
3,150,825,820 |
3,059,746,551 |
3,478,421,341 |
Internal Services Sub-TotalFootnote 7 |
28,407,231 |
28,407,231 |
29,976,406 |
28,719,198 |
39,615,936 |
39,615,936Footnote 6d |
36,135,562 |
35,404,150 |
Total |
3,633,262,748 |
3,633,262,748 |
3,276,486,603 |
4,161,469,038 |
3,762,351,961 |
3,190,441,756 |
3,095,882,113 |
3,513,825,491 |
INFC provides significant funding for large, complex projects which can result in variance in Programs 1.3 Investments in National Infrastructure Priorities and 1.4 Large-Scale Infrastructure Investments. It is typical for some of these projects to require a significant amount of upfront planning, design and procurement. For these programs as well as for Program 1.5 Infrastructure Investments in Small Communities and Rural Areas, even once construction has started, a number of factors beyond the control of funding recipients can result in lower spending than forecasted. These factors range from lower-than-anticipated project costs to project delays as a result of inclement weather, and technical and other construction-related complexities. It is also important to note that federal funding does not actually flow to recipients until they have submitted their claims for actual costs incurred.
Departmental Spending Trend
In 2015-16, INFC's actual spending was over $3.19 billion on infrastructure investments under its programs to meet the expected program results and contribute to its Strategic Outcome.
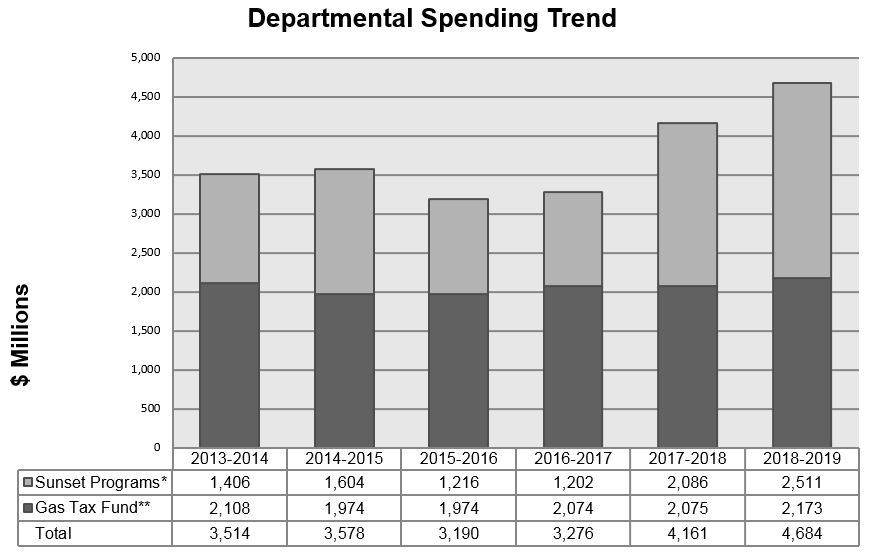
* Sunset Programs are time-limited programs that do not have an ongoing funding nor policy authority.
** Funding under the Gas Tax Fund includes both Voted Spending and Statutory Spending until March 31, 2014. As of April 1, 2014, spending under this program became only Statutory Spending.
See text description of Graph 1
Departmental spending has decreased from almost $3.6 billion in 2014-15, to just over $3.19 billion in 2015-16. In the last few years, infrastructure spending had been on the decline, as sunsetting programs were approaching completion.
Over the next few years, infrastructure spending is projected to increase as new programs get implemented. Budget 2016 announced a new 10-year infrastructure plan for public transit, green infrastructure, and social infrastructure. Infrastructure spending is projected to increase to approximately $3.3 billion in 2016-17 and to $4.2 billion in 2017-18.
Expenditures by Vote
For information on INFC's organizational voted and statutory expenditures, consult the Public Accounts of Canada 2016,xi which is available on the Public Services and Procurement Canada website.xii
Alignment of Spending With the Whole-of-Government Framework
| Strategic Outcome | Program | Spending Area | Government of Canada Outcome | 2015-16 Actual Spending |
|---|---|---|---|---|
Public Infrastructure for a More Prosperous Canada |
Funding for Provincial-Territorial Priorities |
Economic Affairs |
Strong Economic Growth |
50,036,481 |
Permanent and Flexible Public Infrastructure Funding |
Economic Affairs |
Strong Economic Growth |
1,974,079,201 |
|
Investments in National Infrastructure Priorities |
Economic Affairs |
Strong Economic Growth |
84,854,656 |
|
Large-Scale Infrastructure Priorities |
Economic Affairs |
Strong Economic Growth |
887,432,689 |
|
Infrastructure Investments in Small Communities and Rural Areas |
Economic Affairs |
Strong Economic Growth |
88,141,483 |
|
New Bridge for the St. Lawrence Corridor Project |
Economic Affairs |
Strong Economic Growth |
66,281,311 |
| Spending Area | Total Planned Spending | Total Actual Spending |
|---|---|---|
Economic Affairs |
3,604,855,517 |
3,150,825,820 |
Note: The Total Planned Spending number provided in this table does not include expenses made by the Department under its Internal Services.
Financial Statements and Financial Statements Highlights
Financial Statements
INFC's Financial Statements xiv can be found on the Department's website.
Financial Statements Highlights
| Financial Information | 2015-16 Planned Results |
2015-16 Actual |
2014-15 Actual |
Difference (2015-16 actual minus 2015-16 planned) | Difference (2015-16 actual minus 2014-15 actual) |
|---|---|---|---|---|---|
Total expenses |
3,613,455,000 |
3,141,766,000 |
3,035,684,000 |
(471,689,000) |
106,082,000 |
Total revenues |
N/A- |
N/A- |
N/A- |
N/A- |
N/A- |
Net cost of operations before government funding and transfers |
3,613,455,000 |
3,141,766,000 |
3,035,684,000 |
(471,689,000) |
106,082,000 |
Departmental net financial position |
N/A- |
63,243,000 |
16,816,000 |
N/A- |
46,427,000 |
| Financial Information | 2015-16 | 2014-15 | Difference (2015-16 minus 2014-15) |
|---|---|---|---|
Total net liabilities |
767,084,000 |
154,213,000 |
612,871,000 |
Total net financial assets |
188,880,000 |
151,283,000 |
37,597,000 |
Departmental net debt |
578,204,000 |
2,930,000 |
575,274,000 |
Total non-financial assets |
641,447,000 |
19,746,000 |
621,701,000 |
Departmental net financial position |
63,243,000 |
16,816,000 |
46,427,000 |
Footnotes
- Footnote 6
-
There were no expenditures under these programs in 2013-2014, as until March 31, 2014 INFC had a different PAA structure. The Department's current PAA structure came into effect on April 1, 2014.
- Footnote 7
-
The 2015-16 Actual Spending under Internal Services does not include expenses for the GHIB, as the team was transferred from Transport Canada to INFC effective April 1, 2016. Expenditures for the team in 2015-16 will be reported by Transport Canada.
- Date modified: