2012-2013 Departmental Performance Report - Section 2
Section II: Analysis of Programs by Strategic Outcomes
2.1 Strategic Outcomes
Infrastructure Canada's Program Alignment Architecture (PAA) has two Strategic Outcomes (SO) and nine active Programs in support of its mandate. The information presented in this section is organized according to Infrastructure Canada's PAA structure:
1) Provinces, territories and municipalities have federal financial support for their infrastructure priorities.
Programs:
- Provincial-Territorial Infrastructure Base Fund
- Gas Tax Fund
2) Funding for quality, cost-effective public infrastructure that meets the needs of Canadians in a competitive economy, a cleaner environment and liveable communities is provided.
Programs:
- Building Canada Fund-Communities Component
- Building Canada Fund-Major Infrastructure Component
- Green Infrastructure Fund
- Canada Strategic Infrastructure Fund
- Municipal Rural Infrastructure Fund
- Border Infrastructure Fund
- Economic Analysis and Research
Project Spotlight
Metro Transit Fleet
Project location: Halifax, Nova Scotia

New eco-friendly buses for Halifax transit
With the recent addition of 22 new buses to the Metro Transit fleet, Halifax Regional Municipality (HRM) commuters are benefiting from improved transit services. The cleaner, quieter transit fleet means better air quality for residents. By investing in the public transit network, the HRM is not only contributing to its long-term economic growth and prosperity, but offering residents a safer, cleaner and more efficient commute.
Federal contribution: $13,600,000 under the Gas Tax Fund.
2.1.1 Strategic Outcome 1
Provinces, territories and municipalities have federal financial support for their infrastructure priorities.
Under Strategic Outcome 1, the Gas Tax Fund (GTF) and the Provincial-Territorial Infrastructure Base Fund (PT Base) continue to provide stable, predictable funding for jurisdictions and offer them significant flexibility in funding their core infrastructure priorities.
Strategic Outcome 1: Provinces, territories and municipalities have federal financial support for their infrastructure priorities
| Performance Indicator | Targets | Actual Result |
|---|---|---|
| Public investment in infrastructure as a percentage of GDP (G7 and Euro countries) | G7 average | Rank #1 (2010 data) |
Project Spotlight
Black Street Reconstruction
Project location: Whitehorse, Yukon
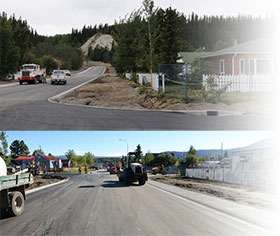
Funding for infrastructure priorities in Yukon's capital
In recent years, parts of Black Street in Whitehorse's downtown core had deteriorated to the point of needing significant repairs. Today, the underground water infrastructure, wastewater and electrical utilities are restored, and the road base is new. An upgraded intersection, new sidewalks and much-needed street lighting have rejuvenated the streetscape. Improving the 'curb appeal' of the neighbourhood is a boon for businesses and residents, while increasing safety for motorists and pedestrians.
Federal contribution: Yukon is receiving $182,910,000 through the Provincial-Territorial Base Fund for initiatives across the territory.
2.1.2 Strategic Outcome 2
Funding for quality, cost-effective public infrastructure that meets the needs of Canadians in a competitive economy, a cleaner environment and liveable communities is provided.
This Strategic Outcome reflects the Department's cost-shared infrastructure investment programs, including contribution programs like the Green Infrastructure Fund and the Building Canada Fund. The Department provides funding to partners for both large- and small-scale projects as well as those with national and regional benefits. Funding is leveraged from partners and invested in the construction, renewal and enhancement of infrastructure in communities across the nation. Performance indicators provided for contribution programs under Strategic Outcome 2 (SO2) are aligned with broader federal policy priorities, illustrating the relationship between benefits realized by Canadians as a result of Infrastructure Canada funded projects and the priorities of the federal government.
Strategic Outcome 2: Funding for quality, cost-effective public infrastructure that meets the needs of Canadians in a competitive economy, a cleaner environment and liveable communities is provided.
| Performance Indicators | Targets | Actual Results |
|---|---|---|
| Average age of core public infrastructure that contributes to a stronger economy is maintained or reduced. | 14.5 years (includes the asset categories: national highway system and connecting bridge assets, international crossings) | 13.9 years (2010 data) |
| Average age of core public infrastructure that promotes liveable communities is maintained or reduced. | 14.7 years (includes the asset categories: cultural, recreational and sports infrastructure, local roads and bridges, water, transit) | 14.3 years (2010 data) |
| Average age of core public infrastructure that contributes to a cleaner environment is maintained or reduced. | 17.1 years (includes the asset category wastewater) | 16.8 years (2010 data) |
Project Spotlight
Autoroute 50 in Quebec
Project location: Quebec
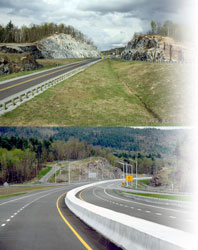
Long-awaited new route enhances Quebec travel
Until November 2012, Autoroute 50 had two distinct sections: one that ran eastward from Hull to Thurso; the other, westward from Mirabel to Notre-Dame-de-Bonsecours (Montebello). Thanks to the completion of 24 kilometres of new highway—including two interchanges, four overpasses, and two bridges—these two sections are now connected. The new highway gives motorists a direct connection from the Outaouais region to Greater Montréal and the rest of Quebec. Reducing commute times and facilitating the transportation of goods and services are among the many benefits this long-awaited project has brought to the region.
Federal contribution: $38,000,000 under the Canada Strategic Infrastructure Fund.
2.2 Programs under Strategic Outcome 1
2.2.1 Program: Provincial-Territorial Infrastructure Base Fund 2012-2013 Main Estimates - $233,392,272
Predictable Funding for Provinces and Territories
Program Description: for section 2.2.1 Program: Provincial-Territorial Infrastructure Base Fund
This program provides $175 million in base funding to each province and territory for core infrastructure priorities. In addition, over $26 million in per capita funding under the Building Canada Fund for the three territories is managed under this fund. The Provincial-Territorial Infrastructure Base Fund was designed to help restore fiscal balance while enhancing Canada's public infrastructure system. It also supports economic competitiveness and productivity, and promotes cleaner air, water and land, and stronger and healthier communities. While payments are made to provinces and territories, ultimate recipients can also include local and regional governments or private sector bodies. In order for federal funding to flow, provinces and territories submit a list of infrastructure initiatives through a capital plan which must be accepted by the Minister of Infrastructure, Communities and Intergovernmental Affairs. Payments are made in advance and cost-sharing provisions apply to a capital plan as a whole, and not individual initiatives. Provinces and territories may pool, bank, or cash-manage these funds to give them flexibility in implementation.
Financial Resources for section 2.2.1 Program: Provincial-Territorial Infrastructure Base Fund
| Total Budgetary Expenditures (Main Estimates 2012-2013) | Planned Spending 2012-2013 | Total Authorities (available for use) 2012-2013 | Actual Spending (authorities used) 2012-2013 | Difference 2012-2013 |
|---|---|---|---|---|
| 5,105,563 | 233,392 | 348,007 | 237,611 | (4,219) |
Human Resources (Full-Time Equivalents (FTE)) for section 2.2.1 Program: Provincial-Territorial Infrastructure Base Fund
| Planned | Actual | Difference |
|---|---|---|
| 2 | 2 | 0 |
| Program Expected Results | Performance Indicators | Targets | Actual Results |
|---|---|---|---|
| Infrastructure Canada funding through the Provincial-Territorial Infrastructure Base Fund leverages investments in infrastructure by other partners | Funding leveraged from the provinces, and other partners, as a percentage of federal funding | 100% | 156% |
| Funding leveraged from the territories, and other partners, as a percentage of federal funding | 33% | 49% | |
| Recipient organizations are accountable for funding provided through the Provincial-Territorial Infrastructure Base Fund | Number of jurisdictions in compliance with annual expenditure reporting requirements in accordance with signed Funding Agreements | 9 | 6 |
| Capital plans submitted by the provinces and territories are accepted, allowing infrastructure initiatives to proceed | Number of capital plans accepted | 3 | 4 |
Performance Analysis and Lessons Learned for section 2.2.1 Program: Provincial-Territorial Infrastructure Base Fund
Following the acceleration of the Provincial-Territorial Infrastructure Base Fund (PT Base Fund) as part of the 2009 Economic Action Plan, as of April 1, 2012 only $254 million remained to be committed under the program, which represents approximately 11 percent of the total $2.3 billion funding envelope.
Overall, four new capital plans and seven amended plans were approved during the reporting period, committing an additional $251 million in federal funding to 69 new initiatives and leveraging $318 million from partners. During the year, another three jurisdictions fully committed the balance of their PT Base funding, leaving less than $4 million to be committed as of the end of the reporting period.
The Government of Canada has concluded PT Base funding agreements with all 13 jurisdictions. Each agreement sets out the conditions relating to the submission of a jurisdiction's expenditure reports which are a requirement to flow federal funding. As such, the specific reporting timeframes can vary from one jurisdiction to another. For example, in August 2012, an agreement was amended to allow one jurisdiction to postpone the submission of its first expenditure report beyond fiscal year 2012-2013. Two other jurisdictions also experienced delays in submitting final versions of their expenditures reports by March 31, 2013, as planned. Infrastructure Canada has been working closely with all provinces and territories to resolve outstanding issues with delayed expenditures reports and it is expected that these will be submitted shortly, allowing federal funding to flow.
While provincial and territorial governments are responsible for meeting the reporting requirements, Infrastructure Canada will continue to work with them to ensure that the required reports are submitted in a timely fashion, and will provide guidance on any issues that may arise during the provincial or territorial audit that would potentially delay their report submissions and related payments.
An internal evaluation report completed in November 2012 confirmed that the PT Base Fund is managed effectively and efficiently, and is meeting the dual purpose set out for its design by contributing to the development and improvement of Canada's infrastructure base and by responding to fiscal balance consultations. The Evaluation of the Provincial-Territorial Infrastructure Base Fund - November 2012 report is available on Infrastructure Canada's website.
2.2.2 Program: Gas Tax Fund 2012-2013 Main Estimates - $ 1,976,117,852
Stable, Predictable and Long-Term Funding for Municipalities
Program Description: for section 2.2.2 Program: Gas Tax Fund
This program provides municipalities with predictable long-term funding, enabling local decision making in the building and rehabilitation of core public infrastructure. The federal government entered into Gas Tax Fund Agreements with provinces, territories, the Association of Municipalities of Ontario, the Union of British Columbia Municipalities, and the City of Toronto. These agreements establish an accountability framework allowing the Government of Canada to flow Gas Tax funding twice a year to signatories, which in turn flow funds to municipalities based on an agreed-upon allocation formula. For their part, municipalities decide which projects to prioritize within established investment categories. Projects focus on environmental objectives, including cleaner air, cleaner water and reduced greenhouse gas emissions, and increase communities' long-term planning capacities. Municipalities can pool, bank and borrow against this funding, providing significant additional financial flexibility. Eligible recipients are required to report annually on their use of funds and their compliance to terms and conditions of the Gas Tax Fund Agreements.
Financial Resources for section 2.2.2 Program: Gas Tax Fund
| Total Budgetary Expenditures (Main Estimates 2012-2013) | Planned Spending 2012-2013 | Total Authorities (available for use) 2012-2013 | Actual Spending (authorities used) 2012-2013 | Difference 2012-2013 |
|---|---|---|---|---|
| 5,105,563 | 1,976,118 | 2,098,118 | 1,966,919 | 9,199 |
Human Resources (FTE) for section 2.2.2 Program: Gas Tax Fund
| Planned | Actual | Difference |
|---|---|---|
| 11 | 16 | (5) |
| Program Expected Results | Performance Indicators | Targets | Actual Results |
|---|---|---|---|
| Provinces, territories and municipal associations are accountable for funding provided to local governments through the Gas Tax Fund | Percentage of jurisdictions in compliance with annual expenditure reporting and periodic outcomes reporting requirements | 100% | 87% |
| Municipalities have access to stable and predictable funding to build and improve infrastructure | Amount of funding flowed to municipalities for spending on municipal infrastructure priorities (as a percentage of annual allocation) | 95% | 94%* |
| Gas Tax Fund promotes investments in environmentally sustainable municipal infrastructure | Value of spending on projects that contribute to a cleaner and sustainable environment and make communities more liveable is maintained or increased | $1.4 billion | $1.3 billion** |
*Calculation is based on previous year amounts flowed to municipalities.
**Calculation is based on actual 2011-2012 spending reported by municipalities.
Performance Analysis and Lessons Learned for section 2.2.2 Program: Gas Tax Fund
During 2012-2013, Infrastructure Canada provided provinces, territories and municipalities with stable and predictable Gas Tax funding. This funding continued to help build and improve public infrastructure that contributes to cleaner air, cleaner water and reduced greenhouse gas emissions.
Infrastructure Canada is working with provinces, territories and municipal associations where there is a delay in meeting reporting requirements. Delays have been the result of signatories working on audit requirements/interpretations, difficulty in obtaining information from smaller communities, and/or submitting incomplete reports.
The Department also continued to enhance controls to effectively manage the program and ensure recipient compliance with existing Gas Tax Fund requirements. By fiscal year end 2012-2013, the Gas Tax Fund surpassed $10 billion in federal funding transferred since the program's inception in 2005. Funding under this program supports quality public transit, water, wastewater, solid waste, local roads and bridges, community energy systems and community capacity building, while improving a municipality's ability to plan.
In Budget 2012, the Government reconfirmed its commitment to working with the provinces, territories and the Federation of Canadian Municipalities (FCM) to develop a new long-term plan for public infrastructure. In the summer of 2012, Infrastructure Canada launched roundtable discussions for the long-term plan engagement process for public infrastructure beyond the expiry of the Building Canada Plan, which includes the Building Canada Fund and the Gas Tax Fund. Extensive consultations across the country were led by the Department with partners and stakeholders resulting in high-level recommendations in relation to the New Building Canada Plan and the renewed Gas Tax Fund.
Partners and stakeholders asked for more flexibility, more funding and a long-term plan. The Government responded by introducing the new plan in Economic Action Plan (EAP) 2013. EAP 2013 introduced the Community Improvement Fund, including a permanent, indexed Gas Tax Fund of $21.8 billion over ten years with an expanded list of investment categories. The Gas Tax Fund offers stable, predictable funding to support community infrastructure projects as well as longer-term infrastructure planning.
2.3 Programs under Strategic Outcome 2
2.3.1 Program: Building Canada Fund-Communities Component 2012-2013 Main Estimates - $251,814,397
Supporting the Infrastructure Needs of Smaller Communities
Program Description: for section 2.3.1 Program: Building Canada Fund-Communities Component
This program addresses the unique infrastructure pressures facing smaller communities with populations of less than 100,000. Projects are cost-shared with provincial, territorial and municipal governments, with each order of government generally contributing one-third of the eligible costs. The Building Canada Fund – Communities Component (BCF-CC) supports the construction, renewal and enhancement of basic infrastructure such as potable water, wastewater treatment, local roads and other infrastructure needs of small communities.13
Financial Resources for section 2.3.1 Program: Building Canada Fund-Communities Component
| Total Budgetary Expenditures (Main Estimates 2012-2013) | Planned Spending 2012-2013 | Total Authorities (available for use) 2012-2013 | Actual Spending (authorities used) 2012-2013 | Difference 2012-2013 |
|---|---|---|---|---|
| 5,105,563 | 251,814 | 232,608 | 187,046 | 64,768 |
Human Resources (FTE) for section 2.3.1 Program: Building Canada Fund-Communities Component
| Planned | Actual | Difference |
|---|---|---|
| 16 | 16 | 0 |
| Program Expected Results | Performance Indicators | Targets | Actual Results |
|---|---|---|---|
| Infrastructure Canada funding through the Building Canada Fund-Communities Component leverages investments in infrastructure by other partners | Funding leveraged from partners as a percentage of federal funding (committed) | 200% | 213% |
| Infrastructure is implemented that promotes a cleaner environment for smaller communities | Number/Value of projects completed that contribute to cleaner air, water and land and contribute to green energy | 189 projects $734.3 million* | 177 projects $539.7 million |
| Infrastructure is implemented that supports a competitive economy for smaller communities | Number/Value of projects completed that promote a stronger, competitive and sustainable economy | 4 projects $7.2 million* | 5 projects $8.4 million |
| Infrastructure is implemented that promotes liveable small communities | Number/Value of projects completed that improve the safety in communities and makes communities more liveable | 417 projects $1.3 billion* | 451 projects $1.2 billion |
*Cumulative number/value of projects to be completed under the program, up to and including March 31, 2013.
Performance Analysis and Lessons Learned for section 2.3.1 Program: Building Canada Fund-Communities Component
During 2012-2013:
- 79 approved projects valued at $261 million were completed
- 40 additional approved projects worth $163 million began construction
- 272 projects worth more than $1.5 billion are still underway
In addition, as a result of available funding from cost savings and projects cancelled by proponents, Infrastructure Canada committed $7 million in federal funds to three new projects, leveraging an additional $19 million in infrastructure investment. Since the inception of the program in 2007, more than $1 billion of federal funding has been committed generating an additional $2.1 billion (more than doubling committed federal funding) in infrastructure investment. Infrastructure Canada continues to support an additional 14 projects in Quebec funded through the Large Urban Centres Component of the Building Canada Fund through a federal allocation of $200 million.
Working with Federal Delivery Partners, through a Service Level Agreement, Infrastructure Canada continues to engage in joint program delivery with provincial partners in support of projects in communities with populations fewer than 100,000 persons. The largest categories of investments are wastewater infrastructure, water infrastructure and local road infrastructure.
Project Spotlight
Marystown Water Treatment Facility
Project location: Marystown, Newfoundland-Labrador
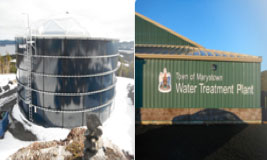
(photos courtesy of the Town of Marystown)
Enhancing drinking water treatment
Thanks to federal, provincial and municipal investments, a progressive new drinking water treatment plant is now in place in Marystown, a community of 5,500 people on Newfoundland's Burin Peninsula. The new plant has more storage capacity and uses modern technologies to enhance water quality. Marystown now meets all current provincial, municipal and federal drinking water quality guidelines. This project means the community can enjoy safe, reliable drinking water.
Federal contribution: $4,000,000 under the Building Canada Fund – Communities Component.
2.3.2 Program: Building Canada Fund-Major Infrastructure Component 2012-2013 Main Estimates - $1,965,119,511
Supporting Nationally and Regionally Significant Projects
Program Description: for section 2.3.2 Program: Building Canada Fund-Major Infrastructure Component
This program targets larger infrastructure projects of national or regional significance. It increases overall investment in public infrastructure and contributes to broad federal objectives: economic growth, a cleaner environment, and strong and prosperous communities. At least two-thirds of the funding is targeted to national priorities: water, wastewater, public transit, the core national highway system and green energy. The Building Canada Fund - Major Infrastructure Component (BCF-MIC) has 13 additional eligible categories of investment, and priority projects are identified through discussions with provinces. By providing federal funding on a cost-shared basis, it leverages additional contributions from other partners to increase overall investment in infrastructure. Eligible recipients include provinces, local or regional governments and private sector bodies, including non-profit organizations. Projects must be supported by a business case and undergo a federal review against key program criteria.14
Financial Resources for section 2.3.2 Program: Building Canada Fund-Major Infrastructure Component
| Total Budgetary Expenditures (Main Estimates 2012-2013) | Planned Spending 2012-2013 | Total Authorities (available for use) 2012-2013 | Actual Spending (authorities used) 2012-2013 | Difference 2012-2013 |
|---|---|---|---|---|
| 5,105,563 | 1,965,120 | 1,984,462 | 927,180 | 1,037,940 |
Human Resources (FTE) for section 2.3.2 Program: Building Canada Fund-Major Infrastructure Component
| Planned | Actual | Difference |
|---|---|---|
| 32 | 44 | (12) |
| Program Expected Results | Performance Indicators | Targets | Actual Results |
|---|---|---|---|
| Infrastructure Canada funding through the Building Canada Fund-Major Infrastructure Component leverages investments in infrastructure by other partners | Funding leveraged from partners as a percentage of federal funding (committed) | 100% | 222% |
| Large infrastructure is implemented that promotes a cleaner environment | Number/Value of projects completed that contribute to cleaner air, water and land and contribute to green energy | 5 projects $147 million* | 2 projects $20.4 million** |
| Large Infrastructure is implemented that supports a competitive economy | Number/Value of projects completed that improve efficiency and integration of Canada's transportation networks, expand broadband networks, and economic development | 38 projects $3.3 billion* | 27 projects $970 million** |
| Large Infrastructure is implemented that promotes liveable communities | Number/Value of projects completed that improve safety in communities and make communities more liveable | 33 projects $2 billion* | 15 projects $307 million** |
*The target value of projects completed as cited in the 2012-2013 RPP has been corrected to reflect the total eligible costs of projects completed as intended.
**Calculated number/value of projects completed under the program, up to and including March 31, 2013.
Performance Analysis and Lessons Learned for section 2.3.2 Program: Building Canada Fund-Major Infrastructure Component
In 2012-2013, Infrastructure Canada focused on project approvals and negotiating funding agreements. By March 31, 2013 more than $6.1 billion had been committed to a total of 167 projects, representing 91.4 percent of available project funding under the Building Canada Fund – Major Infrastructure Component. This funding is leveraging more than $13.6 billion from funding partners.
As of March 31, 2013, 107 projects were underway, with total eligible costs of $18.1 billion. The combined federal contribution for these projects is approximately $5.5 billion, leveraging over $12.6 billion from funding partners. At the end of fiscal year 2012-2013, a total of 46 projects were completed and 14 projects were in the review phase.
The total number/value of projects completed by project proponents was lower than the target as some of these large-scale and complex projects encountered delays and were not completed by year end as forecast. Typically, project delays occur as a result of inclement weather, technical and other construction-related complexities.
Infrastructure Canada will continue to oversee the implementation of project-specific agreements of the Building Canada Fund – Major Infrastructure Component, ensuring that the terms of agreements are respected and that claims for payment are processed efficiently.
2.3.3 Program: Green Infrastructure Fund 2012-2013 Main Estimates - $82,105,333
Investing in Environmental Infrastructure
Program Description: for section 2.3.3 Program: Green Infrastructure Fund
This program supports environmental infrastructure projects that promote cleaner air, cleaner water and reduced greenhouse gas emissions. Targeted investments in green infrastructure can contribute to improving the quality of the environment and a more sustainable economy over the longer term. There are five eligible categories of investment: wastewater infrastructure, green energy generation infrastructure, green energy transmission infrastructure, solid waste infrastructure, and carbon transmission and storage infrastructure. By providing up to 50 percent federal funding on a cost-shared basis, the fund leverages additional investments from other partners. Eligible recipients include provinces, territories, local or regional governments, public sector bodies, other eligible non-profit organizations and private sector companies, either alone or in partnership with a province, territory or a government body.15
Financial Resources for section 2.3.3 Program: Green Infrastructure Fund
| Total Budgetary Expenditures (Main Estimates 2012-2013) | Planned Spending 2012-2013 | Total Authorities (available for use) 2012-2013 | Actual Spending (authorities used) 2012-2013 | Difference 2012-2013 |
|---|---|---|---|---|
| 5,105,563 | 82,105 | 157,922 | 117,858 | (35,753) |
Human Resources (FTE) for section 2.3.3 Program: Green Infrastructure Fund
| Planned | Actual | Difference |
|---|---|---|
| 11 | 18 | (7) |
| Program Expected Results | Performance Indicators | Targets | Actual Results |
|---|---|---|---|
| Infrastructure Canada funding through the Green Infrastructure Fund leverages investments in infrastructure by other partners | Funding leveraged from partners as a percentage of federal funding (committed) | 100% | 176% |
| Infrastructure is implemented that supports cleaner air, cleaner water and cleaner land | Number/Value of projects completed that reduce environmental impacts to air, water and land | 1 project* $71 million* | 1 project $71 million** |
*The target number/value of projects completed as cited in the 2012-2013 RPP has been corrected to reflect the correct number and total eligible costs of projects completed as intended.
**Calculated number/value of projects completed under the program, up to and including March 31, 2013.
Performance Analysis and Lessons Learned for section 2.3.3 Program: Green Infrastructure Fund
In 2012-2013, Infrastructure Canada focused on project approvals and negotiating funding agreements. By March 31, 2013, all remaining project funding under the Green Infrastructure Fund was effectively allocated. Since the inception of the program, the federal funding that has been committed is leveraging more than $1.1 billion from funding partners.
As of March 31, 2013, 12 projects were underway, with total eligible costs of $967 million. The combined federal contribution to these projects is over $363 million, leveraging approximately $604 million from funding partners. At the end of fiscal year 2012-2013, one project had been completed and six projects were in the review phase.
Infrastructure Canada will continue to oversee the implementation of project-specific agreements of the Green Infrastructure Fund, ensuring that the terms of agreements are respected and that claims for payment are processed efficiently.
2.3.4 Program: Canada Strategic Infrastructure Fund 2012-2013 Main Estimates - $410,882,148
Enhancing Quality of Life and Economic Prosperity
Program Description: for section 2.3.4 Program: Canada Strategic Infrastructure Fund
This program supports projects that sustain economic growth and enhance the quality of life of Canadians. Investments are made in cooperation with the provinces, territories, municipalities, and the private sector, and contribute to the construction, renewal and/or enhancement of public infrastructure. The Canada Strategic Infrastructure Fund (CSIF) leverages additional contributions from other partners by providing up to 50 percent funding for eligible projects.16
Financial Resources for section 2.3.4 Program: Canada Strategic Infrastructure Fund
| Total Budgetary Expenditures (Main Estimates 2012-2013) | Planned Spending 2012-2013 | Total Authorities (available for use) 2012-2013 | Actual Spending (authorities used) 2012-2013 | Difference 2012-2013 |
|---|---|---|---|---|
| 5,105,563 | 410,882 | 357,154 | 241,178 | 169,704 |
Human Resources (FTE) for section 2.3.4 Program: Canada Strategic Infrastructure Fund
| Planned | Actual | Difference |
|---|---|---|
| 7 | 12 | (5) |
| Program Expected Results | Performance Indicators | Targets | Actual Results |
|---|---|---|---|
| Infrastructure Canada funding through the Canada Strategic Infrastructure Fund leverages investments in infrastructure by other partners | Funding leveraged from partners as a percentage of federal funding (committed) | 100% | 215% |
| Large-scale Infrastructure is implemented that supports a competitive economy | Number/Value of projects completed that promote a stronger, competitive and a sustainable economy | 35 projects $4.3 billion* | 34 projects $4.3 billion |
| Large-scale infrastructure is implemented that supports liveable communities | Number/Value of projects completed that contribute to liveable communities | 13 projects $3.7 billion* | 9 projects $2.5 billion |
| Large-scale infrastructure is implemented that promotes a cleaner environment | Number/Value of projects completed that contribute to environmentally sustainable treatment of wastewater | 12 projects $1.2 billion* | 8 projects $547 million |
*Cumulative number/value of projects to be completed under the program, up to and including March 31, 2013. A portion of the federal contribution for CSIF projects is coming from other federal sources such as the Building Canada Fund and the Municipal Rural Infrastructure Fund.
Performance Analysis and Lessons Learned for section 2.3.4 Program: Canada Strategic Infrastructure Fund
During 2012-2013, the Department continued to monitor the progress of projects. The Department collaborated with partners and stakeholders to extend the program's terms and conditions, to amend individual project funding agreements and to allow sufficient time for recipients to complete all projects. Eight projects worth $541.5 million were completed by project proponents during the reporting period. This is fewer than forecasted. Delays were caused by inclement weather, technical and other construction-related issues. The Department continues to oversee project completion and their close out using consistent monitoring and review procedures.
Since the inception of the program, Infrastructure Canada has committed more than $4.3 billion in federal funding to 75 projects, generating about $8.4 billion in investment from funding partners. The largest categories of investments in terms of the number of funded projects are highway/rail infrastructure, urban development and water/sewage treatment infrastructure. So far, 51 projects have been completed under the program, improving infrastructure across the country.
2.3.5 Program: Municipal Rural Infrastructure Fund 2012-2013 Main Estimates - $96,549,837
Long-Term Commitment to Communities
Program Description: for section 2.3.5 Program: Municipal Rural Infrastructure Fund
This program supports small-scale municipal infrastructure projects designed to promote and improve quality of life in both urban and rural communities. The program initially provided $1 billion in federal funding and was augmented with an additional $200 million in Budget 2007. At least 80 percent of funding under the program has been dedicated to municipalities with a population of less than 250,000. For most projects, the Municipal Rural Infrastructure Fund (MRIF) provides up to one-third federal funding for eligible projects. Its long-term commitment to public infrastructure helps promote sustainable economic growth, innovation and healthy communities. Projects contribute to the construction, renewal and/or enhancement of public infrastructure to build capacity in partnership with recipients. It is delivered through a partnership with federal regional development agencies.17
Financial Resources for section 2.3.5 Program: Municipal Rural Infrastructure Fund
| Total Budgetary Expenditures (Main Estimates 2012-2013) | Planned Spending 2012-2013 | Total Authorities (available for use) 2012-2013 | Actual Spending (authorities used) 2012-2013 | Difference 2012-2013 |
|---|---|---|---|---|
| 5,105,563 | 96,550 | 58,471 | 36,719 | 59,831 |
Human Resources (FTE) for section 2.3.5 Program: Municipal Rural Infrastructure Fund
| Planned | Actual | Difference |
|---|---|---|
| 6 | 9 | (3) |
| Program Expected Results | Performance Indicators | Targets | Actual Results |
|---|---|---|---|
| Infrastructure Canada funding through the Municipal Rural Infrastructure Fund leverages investments in infrastructure by other partners | Funding leveraged from partners as a percentage of federal funding (committed) | 200% | 258% |
| Small-scale infrastructure is implemented that supports a competitive economy for rural and urban communities | Number/Value of projects completed that promote a stronger, competitive and a sustainable economy | 22 projects $74.4 million* | 21 projects $72.4 million |
| Small-scale infrastructure is implemented that promotes liveable rural and urban communities | Number/Value of projects completed that contribute to liveable communities | 1,459 projects $2.2 billion* | 1,374 projects $1.9 billion |
| Small-scale infrastructure is implemented that promotes a cleaner environment for rural and urban communities | Number/Value of projects completed that contribute to a cleaner environment | 406 projects $1.1 billion* | 375 projects $991.7 million |
*Cumulative number/value of projects to be completed under the program, up to and including March 31, 2013.
Performance Analysis and Lessons Learned for section 2.3.5 Program: Municipal Rural Infrastructure Fund
During 2012-2013, in collaboration with Federal Delivery Partners, the Department continued to deliver the program with provincial and territorial partners, resulting in 45 projects valued at $212 million completed in this reporting period. This brings the total number of completed projects to 1,770, with a total value of $3 billion.
Since the inception of the program, Infrastructure Canada has committed more than $988 million in federal funding to 1,917 projects generating an additional $2.5 billion in investments from funding partners. The largest categories of investments, in terms of total eligible costs, are water ($964 million) and wastewater infrastructure ($962 million).
2.3.6 Program: Border Infrastructure Fund 2012-2013 Main Estimates - $41,837,914
Improving Canada's Border Crossings
Program Description: for section 2.3.6 Program: Border Infrastructure Fund
This program provides funding for investments in physical infrastructure, transportation system infrastructure and improved analytical capacity at the largest surface border crossings between Canada and the United States, as well as several other crossing points in Canada. Established in 2002, the Border Infrastructure Fund (BIF) provides up to 50 percent federal funding to support eligible projects at Canada's border crossings. Transport Canada is the federal delivery partner for this program.18
Financial Resources for section 2.3.6 Program: Border Infrastructure Fund
| Total Budgetary Expenditures (Main Estimates 2012-2013) | Planned Spending 2012-2013 | Total Authorities (available for use) 2012-2013 | Actual Spending (authorities used) 2012-2013 | Difference 2012-2013 |
|---|---|---|---|---|
| 5,105,563 | 41,838 | 28,782 | 8,099 | 33,739 |
Human Resources (FTE) for section 2.3.6 Program: Border Infrastructure Fund
| Planned | Actual | Difference |
|---|---|---|
| 1 | 3 | (2) |
| Program Expected Results | Performance Indicators | Targets | Actual Results |
|---|---|---|---|
| Infrastructure Canada funding through the Border Infrastructure Fund leverages investments in infrastructure by other partners | Funding leveraged from partners as a percentage of federal funding (committed) | 100% | 100% |
| Transportation system infrastructure is implemented that improves the flow of people and goods at the border crossings | Number/Value of transportation systems projects completed that improve the efficiency and capacity at border crossings | 9 projects $610 million* | 9 projects $639.0 million. |
*Cumulative number/value of projects to be completed under the program, up to and including March 31, 2013.
Performance Analysis and Lessons Learned for section 2.3.6 Program: Border Infrastructure Fund
As of March 31, 2013, a total of nine projects under the Border Infrastructure Fund have been completed, representing 100 percent of the planned target. The ninth project was completed in fiscal year 2012-2013 with a total value of $15 million.
Since the inception of the program, the federal government has announced support for 13 border improvement infrastructure projects, generating $1.2 billion in infrastructure investment from its partners.
2.3.7 Program: Economic Analysis and Research 2012-2013 Main Estimates - $3,797,292
Supporting Delivery and Management of Infrastructure Programs
Program Description: for section 2.3.7 Program: Economic Analysis and Research
This program helps to ensure that Canada's infrastructure investment priorities and activities include the building, connecting and sharing of applied knowledge and research on infrastructure issues, projects and programs. It targets key gaps in infrastructure knowledge and information, promotes the development of an enhanced evidence base for sound decision making at all levels of government, and contributes to improved measurement of the impacts of infrastructure policy and investment decisions. This program activity supports strategic research capacity and knowledge generation and applications at the national level, as well as cooperation with other levels of government in addressing their unique research and capacity-building needs. It leverages research resources and expertise across various levels of government and stakeholder groups to address the infrastructure challenges and proposed solutions for Canada's economy, environment and community.19
Financial Resources for section 2.3.7 Program: Economic Analysis and Research
| Total Budgetary Expenditures (Main Estimates 2012-2013) | Planned Spending 2012-2013 | Total Authorities (available for use) 2012-2013 | Actual Spending20 (authorities used) 2012-2013 | Difference 2012-2013 |
|---|---|---|---|---|
| 5,105,563 | 3,797 | 3,877 | 80 | 3,717 |
Human Resources (FTE) for section 2.3.7 Program: Economic Analysis and Research
| Planned | Actual | Difference |
|---|---|---|
| 2721 | 0 | 27 |
| Program Expected Results | Performance Indicators | Targets | Actual Results |
|---|---|---|---|
| Outreach, engagement and consultation with provinces/territories and stakeholders in all aspects of infrastructure | Number of engagement activities that examine the impacts of investments, state of infrastructure across the nation, and future infrastructure needs (includes conferences, roundtables, workshops, seminars and committee meetings) | N/A* | 35 |
| Infrastructure knowledge, policy development and partnership across all levels of government and amongst stakeholder groups | Number of products developed for dissemination of information on investments and state of infrastructure (includes thematic papers, brochures and other communication products) | N/A* | 19 |
| Number of research studies published to inform and guide the long-term infrastructure plan | N/A* | 6 |
*Details of the work activities for the Long-Term Infrastructure Plan engagement process (launched November 2011) were not available when the 2012-2013 Performance Measurement Framework was finalized (September 2011).
Performance Analysis and Lessons Learned for section 2.3.7 Program: Economic Analysis and Research
In Budget 2012, the Government of Canada reconfirmed its commitment to working with partners and stakeholders to develop a long-term plan for public infrastructure that extends beyond the expiry of the Building Canada plan in 2014.
Over the summer of 2012, Infrastructure Canada led a long-term plan engagement process, meeting with provinces, territories, municipalities, municipal associations and other stakeholders to reflect on past accomplishments, to build knowledge, and to discuss the broad principles of a future long-term plan. This work included a series of 14 ministerial roundtable meetings held across the country, bilateral meetings with provinces and territories at the officials' level, and an invitation for interested parties to provide written submissions on the plan.
2.4 Program: Internal Services 2012-2013 Main Estimates - $43,946,941
Program Description: for section 2.4 Program: Internal Services
Internal Services are groups of related activities and resources that are administered to support the needs of programs and other corporate obligations of an organization. These groups are: Management and Oversight Services, Communications Services, Legal Services, Human Resources Management Services, Financial Management Services, Information Management Services, Information Technology Services, Real Property Services, Material Services, Acquisition Services, and Travel and Other Administrative Services. Internal Services include only those activities and resources that apply across an organization and not to those provided specifically to a program.
Financial Resources for section 2.4 Program: Internal Services
| Total Budgetary Expenditures (Main Estimates 2012-2013) | Planned Spending 2012-2013 | Total Authorities (available for use) 2012-2013 | Actual Spending (authorities used) 2012-2013 | Difference 2012-2013 |
|---|---|---|---|---|
| 5,105,563 | 43,947 | 44,866 | 29,96622 | 13,981 |
Human Resources (FTE) for section 2.4 Program: Internal Services
| Planned 2012-2013 | Actual 2012-2013 | Difference 2012-2013 |
|---|---|---|
| 216 | 200 | 16 |
Performance Summary for section 2.4 Program: Internal Services
The results achieved for Internal Services are focused on the activities below, which will strengthen the enabling services that support the Department in its mandate.
Management and Oversight Services for section 2.4 Program: Internal Services
Internal Audit and Evaluation23:
During 2012-2013, the Audit and Evaluation Branch:
- Completed three audits based on the approved risk-based audit plan and reported the results to the external Audit Committee:
- Audit of Human Resources Management – Payroll Administration,
- Audit of Infrastructure Stimulus Fund, and
- Audit of Canada Strategic Infrastructure Fund.
- Completed two evaluations based on the approved evaluation plan and reported the results to the Evaluation Committee:
- Evaluation of the Provincial-Territorial Infrastructure Base Fund, and
- Evaluation of Infrastructure Canada's Economic Action Plan initiatives.
- Periodically followed up on and assessed the implementation of outstanding audit and evaluation recommendations, and reported the results to the external Audit Committee and Evaluation Committee respectively.
Risk Management
During 2012-2013, the Department:
- Ensured that the 2012 Corporate Risk Profile continued to adequately reflect the risks associated with changing risk factors and progress achieved in implementing risk responses;
- Communicated significant risks to senior management for consideration in both the decision-making and planning processes within the Department; and
- Published a series of risk management articles to promote a common understanding of risk concepts within the Department.
Communications Services for section 2.4 Program: Internal Services
During 2012-2013, the Department continued to tell Canadians and stakeholders the story of federal infrastructure investments, activities and results, nationally and locally. Specifically, the Department:
- Completed 215 media announcements;
- Responded to 130 enquiries from the media and 784 from the public;
- Revamped the Department's internet site to meet the government's web accessibility and usability standards, and ensured the site continued to feature easy-to-find information about Infrastructure Canada's programs and projects;
- Produced and disseminated over 190 stories about projects across Canada on its website and in various reports;
- Contributed to 42 blogs, videos and photo compilations;
- Provided communications support to the Minister's roundtable meetings with the partners and stakeholders as part of the Long-Term Infrastructure Plan engagement process;
- Coordinated the production of 15 e-publications that highlighted recent infrastructure investments and results, also as part of the engagement process; and
- Promoted Infrastructure Canada programs to about 8,000 delegates through information booths at six major conferences.
Human Resources Management Services for section 2.4 Program: Internal Services
During 2012-2013, the Department:
- Delivered on its Integrated Business and Human Resources Plan (IBHRP) and people management priorities and strategies to support recruitment and staffing, learning and development, workplace well-being, performance management and recognition, and a representative workforce;
- Continued to implement Infrastructure Canada's Learning Strategy, which is designed to promote a strong learning culture;
- Continued to focus on employee development through talent management and provided targeted, relevant and innovative learning opportunities; and
- Supported and determined operating efficiencies related to the internal budget reduction exercise.
Financial Management Services for section 2.4 Program: Internal Services
During 2012-2013, the Department:
- Continued to strengthen the overall effectiveness of its financial management by:
- Continuing to implement the Department's Action Plan for the Policy on Internal Control (PIC), including the assessment of design effectiveness of internal controls over financial reporting (ICFR), and associated quality assurance processes. Assessments under PIC are planned on a three-year cycle, and as Infrastructure Canada was part of a third wave of departments to implement the policy, a complete assessment is expected to be complete by March 31, 2014; and
- Refining and using the departmental Corporate Costing Model to support the determination of ongoing departmental operating requirements for 2014-2015 and beyond.
- Supporting and determining operating efficiencies related to the internal budget reduction exercise.
Information Management/Information Technology: for section 2.4 Program: Internal Services
During 2012-2013, the Department:
- Ensured appropriate support in the area of information management/information technology (IM/IT) services through two continuing projects that were initiated to improve the Shared Information Management System for Infrastructure (SIMSI). These projects contribute to risk mitigation strategies identified for data management and reporting. The first project focuses on integrating a project management module for major infrastructure programs with the existing Financial Planning and Analysis Application in order to improve the user interface, avoid data duplication, reduce costs and streamline technology in the Department. The second project, the Enterprise Data Warehouse Re-Engineering project, will lead to improved data quality, the ability to provide cross-program reporting, and reduced ongoing maintenance costs. Both projects will be completed in 2013-2014;
- Took measures to facilitate the transition to the Shared Services Canada (SSC) environment by adapting processes for e-mail, data centre hosting and telecommunications services and by transferring associated funding. The Department worked closely with SSC throughout the year, focusing on maintaining levels of service, driving down costs, and planning for the migration of SIMSI from private sector hosting to a federal data centre; and
- Delivered on plans to continue to invest strategically in its IM/IT tools and initiatives, specifically in implementing software applications to facilitate information sharing and standardized systems across the Department. It completed the introduction of a standard desktop computing platform, with up-to-date productivity suites and e-mail software. Industry-standard tools were also introduced to improve security and to monitor corporate asset use in the Department. To reduce costs, the use of applications that were not aligned with broader standardization efforts across government was eliminated.
Access to Information and Privacy Services: for section 2.4 Program: Internal Services
During 2012-2013, the Department:
- Ensured timely responses to Access to Information and Privacy Act (ATIP) inquiries through adequate resourcing and ongoing training for employees. Specifically, the Department:
- Responded to 90 percent of requests within statutory time limits as prescribed by the Access to Information and Privacy Act, despite the significant increase in volume of pages to review;
- Submitted annual statistical reports, reports to Parliament prior to tabling deadlines, and updates to the Department's Info Source descriptions;
- Completed a comprehensive Privacy Management Framework including the development of Privacy Awareness training for all employees; and
- Increased internal capacity by hiring a full-time indeterminate employee.
- Date modified: