
Evaluation of Building Canada Fund
Evaluation of Building Canada Fund - Major Infrastructure Component — April 2021

Evaluation of Building Canada Fund
Major Infrastructure Component
April 2021
(PDF Version)
Table of Contents
- List of Acronyms
- 1.0 Executive Summary
- 2.0 Program Overview
- 3.0 Evaluation Objectives, Scope and Questions
- 4.0 Methodology, Limitations and Mitigation Strategies
- 5.0 Findings
- 6.0 Conclusions
- Annex A: Mapping of MIC Outcomes, Indicators and Themes
- Annex B: MIC Results Matrix
List of Acronyms
- CCPI
- Canada’s Core Public Infrastructure
- FAA
- Financial Administration Act
- GBA+
- Gender-Based Analysis Plus
- IFC
- Infrastructure Framework Committee
- IFR
- Infrastructure Financial Report
- MIC
- Major Infrastructure Component
1.0 Executive Summary
Program Overview
The Building Canada Fund Major Infrastructure Component (MIC) (2008-09 to 2019-20) funded large-scale infrastructure projects of national or regional significance in the areas of water, wastewater, public transit, green energy, highway and roads, disaster mitigation, solid waste management, brownfield redevelopment, broadband, culture, tourism, local roads, short-line rail, short-sea shipping, regional and local airports, and sport and recreational infrastructure.
Evaluation Objective and Scope
The objective of this evaluation was to meet the requirements of section 42.1 of the Financial Administration Act (FAA) and to consider Gender-based Analysis Plus (GBA+) as expressed in the Treasury Board Directive on Results.
The evaluation looked at all approved and announced projects for MIC from April 1, 2008 to March 31, 2019. Claims for MIC projects continued to be paid and outcome reports received after this period, though these were outside of the scope of this evaluation.
Key Findings and Conclusions
Relevance
MIC has addressed infrastructure needs through larger scale projects.
Progress towards achievement of outcomes
MIC has leveraged funding from partners.
MIC has made progress towards funding infrastructure projects that promote economic growth, a cleaner environment, and strong and prosperous communities. As of March 31, 2019 all of the available funding was committed to the following projects:
- 92 approved projects that promoted economic growth, with claims paid totaling $1.97 billion;
- 14 approved projects that promoted a cleaner environment, with claims paid totaling $186 million; and
- 78 approved projects that promoted strong and prosperous communities, with claims paid totaling $3.15 billion.
Inclusivity
The 2016 Directive on Results requires evaluators to consider government-wide policy commitments, including Gender-based Analysis Plus (GBA+). MIC met the government’s Gender-based Analysis requirementsFootnote 1 in its development and implementation.
The evaluation went beyond assessing the extent to which MIC met the requirements for Gender-based Analysis in program development and implementation, to examine program results and external data through an inclusiveness lens more broadly. The intention of this analysis was not to draw conclusions on the relevance or effectiveness of MIC, but rather to use available data to identify potential areas to consider in the development of future infrastructure programming. The analysis was conducted in line with the spirit of GBA+ to “assess how diverse groups of… people may experience government…programs”, Footnote 2 and should be considered supplemental to the evaluation of MIC itself.
This supplemental GBA+ analysis looked at the distribution of MIC projects across different population centre sizes and across all provinces and territories. The evaluation found that despite being designed mostly for larger population centres, MIC benefitted communities of diverse sizes.
Recommendations
The evaluation has no recommendations as MIC is sunsetting and all funds are committed.
2.0 Program Overview
MIC was a $6.5 billion program that funded large-scale infrastructure projects of national or regional significanceFootnote 3.The program started in 2008-09 and ended in 2019-20. Under the program, the eligible funding categories were: water, wastewater, public transit, green energy, highway and roads, disaster mitigation, solid waste management, brownfield redevelopment, broadband, culture, tourism, local roads, short-line rail, short-sea shipping, regional and local airports, and sport and recreational infrastructure.
Federal funding was cost-shared with the provinces/territories, municipalities, and/or the private sector. Federal funding could not exceed 50% of total eligible project costs for provincial, municipal and not-for-profit, non-governmental assets and 25% of total eligible project costs for profit and private sector assets. Eligible recipients included provinces, local or regional governments, private sector, First Nations, and non-profits. Table 1 illustrates the number of approved projects under MIC, INFC’s contribution, and claims paid as of March 31, 2019.
| Number of Approved Projects | Number of completed projects | INFC Program Contribution | Claims Paid |
|---|---|---|---|
| 199 | 137 | $ 6,566,614,763 | $5,279,967,646 |
Source: INFC Financial Report, April 3, 2019.
3.0 Evaluation Objectives, Scope and Questions
The objective of this evaluation was to meet the requirements of section 42.1 of the Financial Administration Act (FAA). Programs with average spending greater than $5 million per year require an assessment every five years of relevance and effectiveness as defined by the Treasury Board:
- Relevance: the extent to which a program, policy or other entity addresses and is responsive to a demonstrable need. Relevance may also consider if a program, policy or other entity is a government priority or a federal responsibility.
- Effectiveness: the impacts of a program, policy or other entity, or the extent to which it is achieving its expected outcomesFootnote 4.
This evaluation also considered a government-wide commitment to include GBA+ in evaluations as outlined in the Treasury Board Directive on Results.
The evaluation looked at all approved and announced projects for MIC from April 1, 2008 to March 31, 2019. Claims for MIC projects continued to be paid and outcome reports received after this period, though these were outside of the scope of this evaluation.
Based on the evaluation objectives, the evaluation examined the following questions:
- Q1. Has the program addressed the infrastructure needs of Canadians?
- Q2. What progress has been made towards expected outcomes?
- Q3. To what extent is the program efficient?
- Q4. To what extent did the program take into account inclusiveness?
4.0 Methodology, Limitations and Mitigation Strategies
In view of the Department shifting its capacity to focus on responding to the COVID-19 pandemic, the project was scoped in a way to make use of data the Evaluation Directorate already had access to, eliminating the need for additional data requests. Data collected as part of previous thematic evaluations, including the Combined Audit and Evaluation of the Impacts of INFC Programs in the Territories and the Evaluation of the Impact of INFC Programs in the Vancouver Area, was also leveraged as applicable. Due to the shift in priorities, it was decided to not conduct interviews as part of this evaluation.
The lines of evidence for this evaluation included the following:
4.1 Document Review
The document review was used to assess program relevance and effectiveness. Progress implementation and site visit reports were used where available to gather information on progress towards program outcomes. News releases related to MIC were also reviewed, to provide information on communications made to the public. A limitation of the document review was that under MIC, recipients were not required to submit annual progress outcome reports. To mitigate this limitation, news releases and program data were also reviewed.
4.2 Data Review
Program data available through the Infrastructure Financial Report (IFR) provided an overview of all funded projects (number of projects by funding category, status of project, funds allocated, and claims paid) and was used to assess program relevance and effectiveness. Additional data sources from Statistics Canada related to infrastructure, such as Canada’s Core Public Infrastructure (CCPI) survey, were used to assess relevance.
4.3 Literature Review
The literature review examined academic and non-academic literature to identify infrastructure needs. The main source for the literature review was EBSCO, an academic library that provides a research database of e-journals, magazines, and e-books. The literature review was included in the evaluation to supplement existing data in support of the evaluation question of relevance and mitigate existing limitations to the methodology.
5.0 Findings
5.1 Relevance
Canadian communities’ needs for large infrastructure projects and the extent to which MIC has been able to address them was assessed through this evaluation.
Finding 1: MIC has addressed infrastructure needs through funding for larger projects.
As seen in Table 2, 42% of MIC-approved projects were larger highway and roads projects, followed by 12% for culture and recreation projects, and 11% for public transit projects. The public transit category had the third highest number of approved projects, and MIC committed the highest percent of funding, 45%, to public transit, followed by 29% of funding for highways and roads projects. Under MIC, examples of projects that addressed the identified infrastructure needs include:
- Public transit projects including expansion of bus services and construction of bus stations:
- New LRT line and Union Station Revitalization Project, Toronto, Ontario;
- Improvements to connections between GO transit and Toronto Transit Commission Subway transit in the Greater Toronto Area, Ontario;
- Various upgrades to stations and buses in Calgary, Alberta;
- LRT expansion in Edmonton, Alberta;
- Improvements to the Montreal Metro in Montreal, Quebec; and
New LRT line, upgrades to the existing Expo Line, rebuilding and extending stations, and purchase of passenger car rails in the Vancouver Area, British Columbia.
- Various highways and roads projects across Canada, including reconstruction of bridges, widening of highways, and rehabilitation of portions of the Trans-Canada Highway:
- widening of Highway 63 from Morrison Street to the Athabasca River Bridge Project connecting Fort McMurray to Edmonton, Alberta;
- rehabilitation of the Trans-Canada Highway (various projects rehabilitating different section of the highway, notably seven projects in Newfoundland; and
- construction of the new Johnson Street Bridge in Victoria, British Columbia.
- Drinking water projects such as dam and reservoir construction, updating treatments plants, and water distribution systems.
|
Priorities/Needs identified from lines of evidence |
Number of Projects by Funded Categories |
Percent of Projects by Funded Categories |
Federal Contribution per Funding Categories (in $ millions) |
Percent of Dollars Spent per Funding Category |
|---|---|---|---|---|
| Broadband and Connectivity | 1 | 0.50% | 54.63 | 0.83% |
| Brownfield Remediation | 1 | 0.50% | 30.00 | 0.46% |
| Capacity Building | 5 | 2.51% | 4.05 | 0.06% |
| Footnote *Culture | 23 | 11.56% | 483.17 | 7.36% |
| Disaster Mitigation | 2 | 1.01% | 18.55 | 0.28% |
| Footnote *Drinking Water | 8 | 4.02% | 193.48 | 2.95% |
| Footnote *Green Energy | 1 | 0.50% | 4.50 | 0.07% |
| Footnote *Highways and roads | 83 | 41.71% | 1 926.20 | 29.33% |
| Footnote *Public Transit | 22 | 11.06% | 2 951.42 | 44.95% |
| Recreation | 23 | 11.56% | 178.52 | 2.72% |
| Short-line Rail | 1 | 0.50% | 14.88 | 0.23% |
| Footnote *Sport | 10 | 5.03% | 158.92 | 2.42% |
| Tourism | 7 | 3.52% | 181.78 | 2.77% |
| Footnote *Wastewater | 12 | 6.03% | 366.43 | 5.58% |
| Total | 199 | 100% | 6 566.61 | 100% |
Source: INFC Financial Report, April 3, 2019.
Document and literature review identified nationally and regionally significant needs for roads, bridges, sports and recreation, culture, public transit, water systems, solid waste, and major trade corridors Footnote 5.
In its program design, MIC identified the following five funding categories as national priorities and provided funding in these categories for large projects of national and regional significance:
- Highways and Roads;
- Drinking Water;
- Public Transit;
- Wastewater; and,
- Green Energy.
The total claims paid to approved projects for the five national priorities was $4,353,141,441 as of March 31 2019. These priority areas align with the needs identified through the document and literature review. The majority, 63%, of approved MIC projects were under the five national priorities.
5.2 Progress Towards Expected Outcomes
The findings in this section are based on the program outcomes and indicators identified in the MIC performance measurement strategy. The assessment was conducted by looking at the indicators and the data sources identified in the performance measurement strategy. The data sources is the IFR as under MIC there was no requirement for annual progress reports. A mapping of the findings related to progress towards outcomes and the program performance measurement strategy can be found in Annex A.
Finding 2: MIC has leveraged funding from partners.
Under MIC from 2008 to March 31 2019, the total federal funds flowed were $5,279,967,646. This is 80% of the $6,566,614,763 of federal funds committed through the programFootnote 6. The program required that provinces meet funding levels from the federal government and municipalities contribute 33% of project costs. Municipalities leveraged part of the funding they needed for projects from non-governmental partners. MIC leveraged funding from other levels of government and non-governmental partners in excess of the minimum required, as seen in Figure 1.

Description of figure 1: Funding Leveraged from Partners (Total and as a Percent of Federal Funding Committed)
This figure represents the dollar value of funding leveraged by funding partner. The distribution is as follows:
- Provincial: $7,070,637,821.00 or 108% of federal funds committed.
- Municipal: $5,780,848,102.00 or 88% of federal funds committed.
- Non-governmental: $1,464,211,438.00 or 22% of federal funds committed.
Source: INFC Financial Report, April 3, 2019.
Finding 3: MIC has funded infrastructure projects that promote economic growth.
As defined by the program design, various project categories were identified as supporting economic growthFootnote 7. As seen in Figure 2, a total of 92 approved projects under MIC fell under the categories that promoted economic growth, with claims paid totaling $1.97 billion as of March 31, 2019. Of these, 83 supported highways and roads work.

Description of figure 2: Federal Funding Committed and Claims Paid for Approved Projects towards Economic Growth
This figure represents the funds committed and claims paid for approved projects that help economic growth. The distribution is as follows ($ in millions):
- Highway and roads; 83 approved projects, $1,926.21 federal funding committed, and $1,726.25 claims paid to approved projects.
- Tourism: 7 approved projects, $181.79 in federal funding committed and $181.79 in claims paid to approved projects.
- Broadband and connectivity:1 approved project, $54.64 in federal funding committed and $54.64 in claims paid to approved projects.
- Shortline rail: 1 approved project, $14.89 in federal funding committed and $14.89 in claims paid to approved projects.
Source: INFC Financial Report April 3, 2019.
Finding 4: MIC has funded infrastructure projects that promote a cleaner environment.
As defined by the program design, various project categories were identified as supporting a cleaner environmentFootnote 8. As seen in Figure 3, there were a total of 14 approved projects that promoted a cleaner environment, with claims paid totaling $186 million as of March 31, 2019. Of these, 12 supported wastewater work.

Description of figure 3: Federal Funding Committed and Claims Paid for Approved Projects towards a Cleaner Environment
This figure represents the funds committed and claims paid for approved projects that help a cleaner environment. The distribution is as follows ($ in millions):
- Wastewater:12 approved projects, $366.44 in federal funding committed and $176.90 in claims paid to approved projects.
- Green Energy:1 approved project, $4.50 in federal funding committed and $4.50 in claims paid to approved projects.
- Brownfield Remediation and Redevelopment: 1 approved project; $30.00 in federal funding committed and $5.47 in claims paid to approved projects.
Source: INFC Financial Report, April 3, 2019.
Finding 5: MIC has funded infrastructure projects that promote strong and prosperous communities.
As defined by the program design, various project categories were identified as supporting strong and prosperous communitiesFootnote 9. As seen in Figure 4, there was a total of 78 approved projects that promoted strong and prosperous communities, with claims paid totaling $3.15 billion as of March 31, 2019. Of these, 23 supported recreation, 23 culture and 22 public transit work.

Description of figure 4: Federal Funding Committed and Claims Paid for Approved Projects towards Strong and Prosperous Communities
This figure represents the funds committed and claims paid for approved projects that help towards strong and prosperous communities.The distribution is as follows ($ in millions):
- Recreation: 23 approved projects, $178.53 in federal funding committed and $148.63 in claims paid to approved projects.
- Culture: 23 approved projects, $483.18 in federal funding committed and $ 414.59 in claims paid to approved projects.
- Drinking Water: 8 approved projects; $193.48 in federal funding committed and $135.91 in claims paid to approved projects.
- Public transit: 22 approved projects, $2,701.42 in federal funding committed and $2,309.57 in claims paid to approved projects.
- Sport:10 approved projects, $158.93 in federal funding committed and $139.97 in claims paid to approved projects.
- Disaster Mitigation: 2 approved projects, $18.56 in federal funding committed and $10.45 in claims paid to approved projects.
Source: INFC Financial Report, April 3, 2019.
It should be noted that MIC’s intermediate outcome indicators were: number of completed projects, and federal funding by national priority and theme. MIC’s ultimate outcome indicators were: total program funding, including federal and other level of governments, of completed projects, broken down by national priority and theme. The evaluation shows that MIC made progress towards its immediate targets. However, it was determined that the intermediate and ultimate outcome indicators chosen for the program were not at the appropriate level to show medium- and long-term impacts as a result of the program.
5.3 Inclusivity
The 2016 Directive on Results requires evaluators to consider government-wide policy commitment, including Gender-based Analysis Plus (GBA+). MIC met the government’s Gender-based Analysis requirementsFootnote 10 in its development and implementation.
The evaluation went beyond assessing the extent to which MIC met the requirements for Gender-based Analysis in program development and implementation, to examine program results and external data through an inclusiveness lens more broadly. The intention of this analysis was not to draw conclusions on the relevance or effectiveness of MIC, but rather to use available data to identify potential areas to consider in the development of future infrastructure programming. The analysis was conducted in line with the spirit of GBA+ to "assess how diverse groups of… people may experience government… programs”, Footnote 11 and should be considered supplemental to the evaluation of MIC itself.
This supplemental GBA+ analysis looked at locations where projects took place to determine the distribution across different population center sizes and across provinces and territories. Considering the limited capacity of municipalities, particularly smaller ones, to plan and deliver large scale infrastructure projects, this analysis looked at whether there was inclusive access to MIC funding for all population centre sizes.
In order to conduct this analysis, MIC project location data and Statistics Canada’s population data was used.
Finding 6: MIC benefitted communities of diverse sizes.
MIC was designed to address needs for large-scale infrastructure of regional or national significance, primarily in larger population centres. The eligibility criteria under MIC allowed for smaller communities with larger projects to apply. The evaluation examined program uptake to see if the design of MIC led to inclusive access to funding for various community sizes.
Analysis illustrated that MIC projects were distributed across all ten provinces, with a higher percentage of total projects in the larger and more populous provinces of Ontario, Quebec and British Columbia. As seen in Table 3, while MIC projects took place across population centres of various sizes, the majority took place in large population centres with only one project in a rural location.
Garcelon Civic Center in St. Stephen, New Brunswick is an example of a large and regionally significant recreation project that took place in a small municipality. Despite a small population, the newly constructed civic center benefits the areas surrounding St. Stephen, including the U.S. town across the border. Other projects taking place in small or rural municipalities included highways and roads, providing infrastructure that connects diversely sized regions across Canada.
| Size of Municipality | Number of projects | Percentage of Total Projects |
|---|---|---|
| Large (>100,000) | 79 | 40% |
| Medium (>30,000) | 28 | 14% |
| Small (>1000) | 52 | 27% |
| Rural (<1,000) | 1 | <1% |
| Mixed (more than one municipality) | 36 | 18% |
| Total | 196 | 100% |
Source: INFC Financial Report, April 3, 2019 and Statistics Canada Census Data 2016.
6.0 Conclusions
Overall MIC has met infrastructure needs.
The evaluation found that the need for larger infrastructure projects of regional or national significance applies to population centres of all sizes. Flexibility in program eligibility requirements in MIC allowed populations of all sizes to access MIC funding.
MIC’s intermediate outcome and ultimate outcomes were not well distinguished as they both measured number of projects and funds spent. That said, the program has made progress towards its targets and has contributed to expected program outcomes of economic growth, a cleaner environment and stronger and prosperous communities.
The evaluation has no recommendations as MIC is sunsetting and all funds are committed.
Annex A: Mapping of MIC Outcomes, Indicators and Themes
| Outcome | Indicator | Theme |
|---|---|---|
|
Investments leveraged between the federal/provincial governments and private sectorFootnote * |
Funding leveraged from partners and a % of federal fundingFootnote * |
Finding 2: MIC has leveraged funding from partners. |
|
Federal funds injected into economy towards public infrastructureFootnote * |
Federal funds flowedFootnote 12 Footnote * |
|
|
Federal funds flowed as % of federal committedFootnote 13 Footnote * |
||
|
Large-scale infrastructure that promotes economic growth, a cleaner environment, as well as strong and prosperous communitiesFootnote *** |
Number under the 5 National PrioritiesFootnote 14 Footnote *** |
|
|
Total value Footnote 15of substantially completed projects by National PriorityFootnote *** |
||
|
Recipient engagement and collaboration in MIC delivery Footnote * |
Type and level of support or collaboration and legal obligationFootnote * |
Unable to assess as recipient audits not available. |
|
Substantially completed assets resulting in modern public infrastructureFootnote ** |
Number of projects and $ value of federal committed funding contributing to economic growthFootnote ** |
Finding 3: MIC has funded infrastructure projects that promote economic growth. |
|
Large-scale infrastructure that promotes economic growthFootnote *** |
Total value of substantially completed projects by themeFootnote *** |
|
|
Substantially completed assets resulting in modern public infrastructurereference ** |
Number of projects and $ value of federal committed funding contributing to a cleaner environmentreference ** |
Finding 4: MIC has funded infrastructure that promotes a cleaner environment. |
|
Large-scale infrastructure that promotes a cleaner environmentreference *** |
Total value of substantially completed projects by themereference *** |
|
|
Substantially completed assets resulting in modern public infrastructurereference ** |
Number of Projects and $ value of federal committed funding contributing to strong and prosperous communitiesreference ** |
Finding 5: MIC has funded infrastructure that promotes strong and prosperous communities. |
|
Large-scale infrastructure that promotes strong and prosperous communitiesreference *** |
Total value of substantially completed projects by themereference *** |
Annex B: MIC Results Matrix
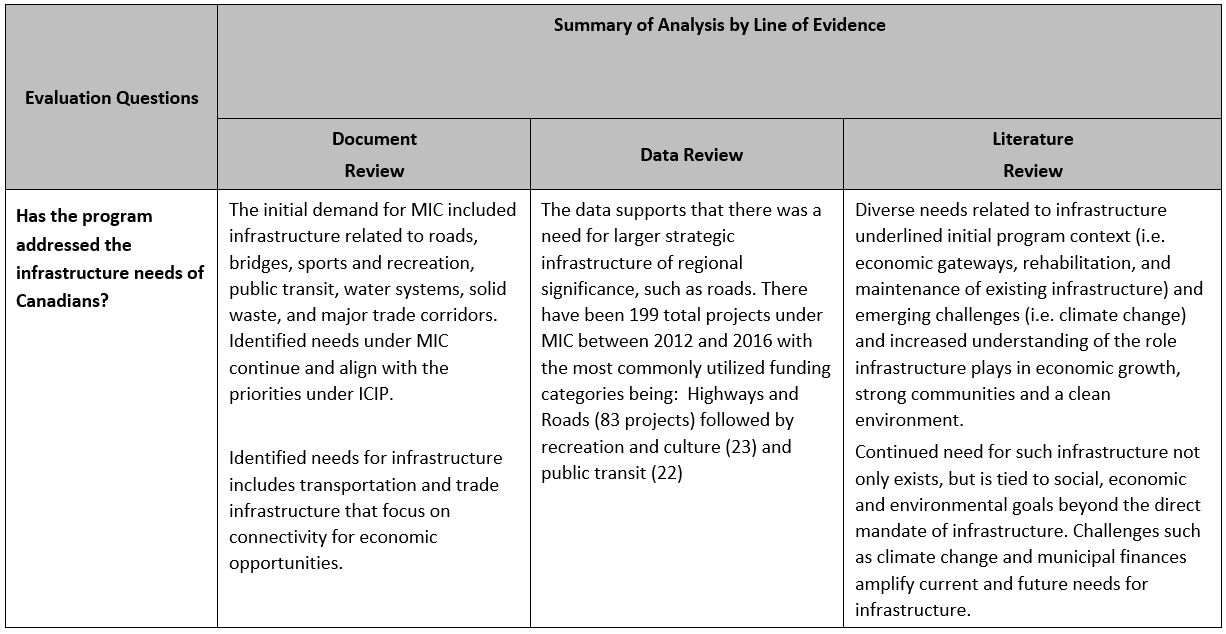
Description of figure 5: Evaluation Question - Has the program addressed the infrastructure needs of Canadians
Evaluation Question
Has the program addressed the infrastructure needs of Canadians?
Summary of Analysis by Line of Evidence
Document Review
The initial demand for MIC included infrastructure related to roads, bridges, sports and recreation, public transit, water systems, solid waste, and major trade corridors. Identified needs under MIC continue and align with the priorities under ICIP.
Identified needs for infrastructure includes transportation and trade infrastructure that focus on connectivity for economic opportunities.
Data Review
The data supports that there was a need for larger strategic infrastructure of regional significance, such as roads. There have been 199 total projects under MIC between 2012 and 2016 with the most commonly utilized funding categories being: Highways and Roads (83 projects) followed by recreation and culture (23) and public transit (22)
Literature Review
Diverse needs related to infrastructure underlined initial program context (i.e. economic gateways, rehabilitation, and maintenance of existing infrastructure) and emerging challenges (i.e. climate change) and increased understanding of the role infrastructure plays in economic growth, strong communities and a clean environment.
Continued need for such infrastructure not only exists, but is tied to social, economic and environmental goals beyond the direct mandate of infrastructure. Challenges such as climate change and municipal finances amplify current and future needs for infrastructure.

Description of figure 6: Evaluation Question - What progress has been made towards immediate outcomes?
Evaluation Question
What progress has been made towards immediate outcomes?
Summary of Analysis by Line of Evidence
Data Review
- (108% of federal funds flowed);
- Municipal share: $5,780,848,102 N/A
- (88% of federal funds flowed);
- Non-governmental share: $4,621,430,096
- (70% of federal funds flowed)
- Combined, 266% of federal funds leveraged from other levels of government and/or private sector: target met
- Target is 100% of committed funds are flowed
- Total federal funds flowed (INFC and Transport Canada) from 2011-2019: $4,556,397,993
- 77% of MIC federal funding from Transport Canada, 23% of MIC federal funding from INFC ($1,035,960,252)
- Total MIC federal budget 2011-2019: $6,803,426,026
- Total federal funds flowed did not meet total MIC federal budget target
Evaluation Question
What progress has been made towards intermediate outcomes?
Summary of Analysis by Line of Evidence
Data Review
MIC Has made progress towards having federal funds towards public infrastructure injected into the economy.
Total federal funds flowed (INFC and Transport Canada) from 2011-2019: 4,556,397,993
Federal funding flowed to MIC projects per year as percent of MIC budget of that year:
- 2011-2012: 62%;
- 2012-2013: 46%;
- 2013-2014: 73%;
- 2014-2015: 76%;
- 2015-2016: 78%;
- 2016-2017: 90%;
- 2017-2018: 82%;
- 2018-2019: 100%
MIC met its PMES performance targets of number of projects towards having funding from all levels of government for public infrastructure and contributing to economic growth, a cleaner environment and strong and prosperous communities.
PMES target for number of projects contributing to economic growth: 54
PMES target for $ value of federal funding for projects contributing to economic growth: $1.874B
| Economic Growth | Federal Funding Committed (in millions) |
Claims Paid to Approved Projects (in millions) |
|---|---|---|
| Highways and Roads (83 projects) | $ 1,926.21 | $ 1,726.25 |
| Tourism (7 projects) | $181.79 | $ 181.79 |
| Broadband Connectivity (1 project) | $ 54.64 | $ 54.64 |
| Short line Rail (1 project) | $14.89 | $ 14.89 |
PMES target for number of projects contributing to a cleaner environment: 11
PMES target for $ value of federal funding for projects contributing to a cleaner environment: $279.8M
| Cleaner Environment | Federal Funding Committed (in millions) |
Claims Paid to Approved Projects (in millions) |
|---|---|---|
| Wastewater (12 projects) | $366.44 | $176.90 |
| Green Energy (1 project) | $4.5 | $4.5 |
| Brownfield Remediation and Redevelopment (1 project) | $30 | $ 5.47 |
PMES target for number of projects contributing to strong and prosperous communities: 52
PMES target for $ value of federal funding for projects contributing to strong and prosperous communities: $2.456B
| Communities | Federal Funding Committed (in millions) |
Claims Paid to Approved Projects (in millions) |
|---|---|---|
| Recreation (23 projects) | $178.53 | $148.63 |
| Culture (23 projects) | $483.18 | $414.59 |
| Drinking Water (8 projects) | $193.48 | $135.91 |
| Public Transit (22 projects) | $2,701.42 | $2,309.57 |
| Sport (10 projects) | $158.93 | $135.97 |
| Disaster Mitigation (2 projects) | $18.56 | $ 10.45 |
| National Priority | Number of approved projects | Claims paid (in millions) |
|---|---|---|
| Highways and Roads | 83 | $1,726.25 |
| Drinking Water | 8 | $135.91 |
| Public Transit | 22 | $2,309.57 |
| Wastewater | 12 | $176.89 |
| Green Energy | 1 | $4.50 |
| TOTAL | $4,353.14 | |
- PMES target for # of projects under 5 national priorities: 82
- Target met through highways and roads alone.
- IFR data N/A by level of completion and lack of project reports, therefore unable to speak to value of substantially completed infrastructure by national priority.
- Project numbers met their PMES targets.
- Project funding target N/A
- Projects under short sea shipping, tourism, and national core highway
- (As per PMES)
- Highways and roads 83 (But this includes highways and local roads); Tourism 7- PMES target 53
- Projects under wastewater and green energy (as per PMES)
- Wastewater 12; Green Energy 1- PMES target 11
- Sport, PT, local roads, Culture, Recreation
- (As per PMES)
- Culture 23; Recreation 23; PT 22; Sport 10; Local roads N/A- PMES target 52
Committed Funds:
- Broadband And Connectivity - $54,638,695.0
- Brownfield Remediation And Redevelopment – $30,000,000.0
- Capacity Building - $4,058,418.0
- Culture - $483,179,498.9
- Disaster Mitigation – $18,556,986
- Drinking Water - $193,484,591.5
- Green Energy – 4,500,000.0
- Highways and Roads - $1,926,206,264.0
- Public Transit – $2,951,422,729.0
- Recreation – $178,527,121.0
- Short line Rail – $14,889,614.8
- Sport – $158,925,250.0
- Tourism – $181,785,599.0
- Wastewater - $366,439,994.6
- Grand Total – $6,566,614,763.0

Description of figure 7: Evaluation Question - What progress has been made towards intermediate outcomes? (Doc review)
Doc Review
Economic growth:
- Garcelon Civic Center expected to bring new investment to the area (evidenced by new hotel being built)
- The town of St. Stephen has an economic strategy centered around the new Center, including the surrounding areas (cross-border and Canadian)
- The Garcelon Civic Center is expected to help nurture the cross-border relationship, which supports cross-border economic activity
- Reported cash flow into St. Stephen due to the Civic Center project
- The Kinnear Centre will increase programming in several disciplines, drawing more program artists to The Banff Centre
Cleaner environment:
- LEED standards for both Garcelon Civic Center and the Kinnear Centre require that design and construction must follow specifications to increase operating efficiencies, improve the facility's lifespan, and restrain operating costs during that lifespan at an energy efficiency level of 73%
- Kinnear Centre documents indicate that the most efficient technology and materials are considered for new developments
- Kinnear Centre: Angled sunshades deflect solar heat in summer months to reduce cooling costs, but permit maximum light and solar warming in the winter months, providing the Centre with highly energy-efficient heating, cooling and mechanical systems; Natural light is used alongside LED fluorescent, contributing to energy efficiencies; The building materials for the centre were selected to be sustainable and low-maintenance; An innovative storm water management system will prevent soil erosion, and use bioswales and ponds to remove sediments, surface pollutants, and prevent dumping into the Bow River
Strong and prosperous communities:
- Garcelon Center was designed to support an active and healthy lifestyle for Canadians, and anchor and stimulate community building and revitalization
- Civic centre provides space and opportunity for community-building activities, including spaces for arts, sports, recreational and social activities for all members of the surrounding area
- A hotel, providing 30-50 people full- and part-time jobs, is still being built in response to the opportunities the Garcelon Civic Center was bringing the area, anticipating increased tourism and local economic activity
- Reported cash flow into St. Stephen due to the Civic Center project
- Hiring was kept local within NB and NS (other than 1 firm from Montreal), and hyper local, with electricians and plumbers, site line surveying work and concrete work coming from the Town itself, with most employees living in St. Stephen
- The Kinnear Centre is expected to serve over 25,000 users annually through high level programming, think tanks, conferences, research, performances and presentations, including showcasing the work of local artists

Description of figure 8: Evaluation Question - To what extent is MIC efficient?
Evaluation Question
To what extent is MIC efficient?
Summary of Analysis by Line of Evidence
Doc Review
INFC $ carve out: $183,269,875
Provincial $ carve out: $0
Extent to which service standards are being met: No service standards were established for MIC.
IFR reports indicate that 3% of MIC program funding was allocated to MIC INFC internal management. A 5% internal administration ratio would generally be considered efficient, but of the 4 programs being reviewed here, GIF is the highest, MIC being at 3% and PTIF and CWWF being below 1%. So relatively speaking, MIC is the 2nd most expensive in terms of consumption of INFC resources for its administration.
Data Review
N/A
Lit Review
MIC can be considered efficient when compared with other transfer payment programs. Less than 3% of program funding was spent on administration while the ratio for the other federal transfer payment programs fluctuates between 3% and 7%.

Description of figure 9: Evaluation Question - To what extent did MIC take into account inclusiveness?
Evaluation Question
To what extent did MIC take into account inclusiveness?
Summary of Analysis by Line of Evidence
Doc Review
- Large Population centre = 40%
- Medium Population centre= 14%
- Small Population centre= 27%
- Rural= 1%
- Mixed= 18% (Where mixed is a project with more than 1 location, shared amongst municipalities)
PT distribution:
AB= 12%; BC= 20%; MB= 3%; NB= 1%; NL= 9.5%; NS= 11.5%; ON= 19%; PE= 1.5%; QC= 16%; SK= 6%
Data Review
N/A
Lit Review
GBA+ assesses how diverse groups of people experience MIC programs: communities of different sizes experience different infrastructure needs and difficulties, where inclusiveness in regional implementation assists in more inclusive access for all Canadians.
Infrastructure access reduces various inequalities. Rural inequalities are reduced with infrastructure such as broadband and transport infrastructure. Urban inequalities are reduced with infrastructure such as public transit and the updating of basic infrastructure in low-income neighborhoods. Already present inequalities due to identity-based barriers are exacerbated when infrastructure projects are not implemented in certain geographical regions. Alternatively, implementation of basic infrastructure across diverse regions across Canada can aid in overcoming barriers for people experiencing inequalities.
Report a problem on this page
- Date modified: